适用于MetaTrader 4的EA交易和指标 - 283

Autobot Retracement Code (ARC) A robot trading that works based on retracement strategy while following the market trend.It has made average profits up to 25% /month that is relatively a High Return of Investment.Real Account proof. Fully automation. Auto Lot sizing, Auto TakeProfit Calculation, Auto StopLoss Calculation. Currently Running on Real account , it has more than 100% growth / 5 months. NEW UPDATE RELEASED, VERSION 3.0 FEATURES on Version 3:
FIFO rules
Auto LotSize Auto StopLoss

Everse is an Expert Advisor (EA) that build based on martingale, anti-martingale and hedging method. The main idea is place buy and sell in parallel, save the unprofitable positions with martingale, and take profitable positions as a bonus. The RSI, iClose, iHighest and iLowest indicators are used for entries. The highest and lowest prices are to indicate the range of new orders, where the next order, with same type must be higher than 75% of difference between this lowest and highest prices. An

the indicator showed excellent results in the scalping trade, and the same excellent results in the trading of exact instruments led to the fact that of these indicators showed themselves perfectly during the exit from the news with an during low volatility, This instrument has been tested for more than 1 month. What can we say about the number? It is reliable, accurate, at any time of trading. Atom Pro Maximum, this indicator showed excellent results in scalping trading. The accuracy of this

SpeedChan Leading indicator. Marks in the future two price channels - if the price comes into the channel, then the quote changes with the speed specified in the parameters. In these areas, price reversals are most likely. Two price channels are displayed - one on top, showing the growth rate; the second one - below, shows the speed of the fall. Channels are displayed as a solid center line and two borders drawn with a dotted line. In many cases, the area between the channels is not important fo

Karman is a fully automated trading advisor working on a М30 timeframe. The settings of the advisor are based on the safe trading, the essence of which is to close the transaction, while achieving a positive profitability dynamism of several points, which allows the user to reduce the costs of opening losing trades. The Expert Advisor is multi-functional and does not require a specific type of account for the normal operation of all functions embedded in it. The advisor’s manual involves encapsu

ZhiBiScalping是一个真正的手动剥头皮交易系统,适合任何图表周期使用,适合所有市场品种。 市场报价向下突破Aqua虚线,就可以做Buy单;继续向下突破Aqua实线,可以增加Buy单量。 市场报价向上突破Red虚线,就可以做Sell单;继续向上突破Red实线,可以增加Sell单量。 参数设置: 【SPPeriod】:ZhiBiScalping的主要周期。 【ATRMultiplier1】:虚线所使用的ATR倍数。 【ATRMultiplier2】:实线所使用的ATR倍数。 【ATRPeriod】:ATR周期。 【alertsMessage】:这是警报开关,设置成true,如果出现箭头就会自动警报提示;设置成false,则不会警报提示。 【alertsEmail】:这是发送邮件的开关,设置成true,如果出现箭头就会发送邮件到你在MT4设置好的邮箱里面;设置成false,则不会发邮件。 【alertsSound】:这是声音提示开关,设置成true,如果出现箭头就会有声音;设置成false,则不会发出声音。 【alertsNotification】:这是发送即时消息的开关,设置成t

STFX MARTINGALIC FX Technologies EA STFX MartingalicFX The Expert Advisor can be used for Full Automatic and Semi Automated trading. EA STFX Martingalic has various strategies such as: Scalping, Averagging , Martingale, Anti Martingale and or combine the two Trading positions can be closed easily using panels such as close profit only, close buy, close sell, close all transactions The choice of indicators for position entries used is Smooth Moving Average , Multy Moving Average , MACD Divergence

You can choose any timeframe because all calculations are carried out according to special algorithms. The advisor trades only the symbols listed in the property Symbols, regardless of the symbol in which it is working. The market is subject to pattern-based fluctuations, which means it is fluctuations that often repeat themselves. A neural network has an undisputable advantage which is to memorize market fluctuations which generated both positive and negative trades. The neural network of this
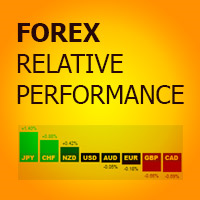
Forex Relative Performance indicator This indicator calculates the relative strength of major currencies against the US dollar. The basic idea behind this indicator is "to buy strong currency and to sell weak currency". This indicator allows you to quickly identify the best forex pair to trade according to your trading style (Intraday, Scalping, Swing, or Long Term) For demo testing please use MT5 version, because MT4 does not support Multicurrency Testing https://www.mql5.com/en/market/product/
This adviser finds the trend of the currency pair on a given number of bars, after that, determines the time of the correction. If the trend is strong enough, and the correction becomes equal to the one set in the parameters, the adviser can open a trade in the direction of the trend, if additional indications of indicators confirm the opening of the trade. This is good because it will not buy at the high or sell at the low of the trend, but only after the correction. Nevertheless, it is possibl

The principle of the indicator. A simple moving average (SMA) with an averaging period (2n + 1) of bars is always obtained lagging by n bars. If SMA or other types of moving averages are the basis for making trading decisions, then their strong delay does not allow to open positions in time and close positions, which leads to losses. The Estimation moving average without lag ( EMAWL ) indicator calculates the non-lagging moving average, which is calcula

Эксперт для работы на основных валютных парах. Открытие сделок на основе анализа ценового движения. Вход в рынок отложенными динамическими ордерами, всегда выставляет StopLoss и TakeProfit, не использует мартингейл и усреднение. Робот не выходит за границы заложенной в него стратегии, соблюдает заданный уровень риска и контролирует расширения спреда, выбирая наиболее благоприятные моменты входа в сделку. Для эффективной работы желательно провести оптимизацию для каждой валютной пары. Для ускор

You can choose any timeframe because all calculations are carried out according to special algorithms. The advisor trades only the symbols listed in the property Symbols, regardless of the symbol in which it is working. The market is subject to pattern-based fluctuations, which means it is fluctuations that often repeat themselves. A neural network has an undisputable advantage which is to memorize market fluctuations which generated both positive and negative trades. The neural network of this

Идеология советника построена на постановке прямых и обратных ордеров. Прямые ставятся с постоянной начальной ставкой, ставка обратных постоянно возрастает. В момент достижения достаточного профита, все ордера закрываются одновременно, после чего начинается новая итерация. Пример работы советника в режиме реального времени можно посмотреть здесь. Входные параметры Program Language – выбор языка, на котором советник будет выводить сообщения (может быть русский или английский). Delay – время задер

The most effective signals generated by Ichimoku strategies. Ichimoku Trade Alarm is a supplement for Ichimoku Trade Panel and it shows the signals that Expert Advisor reacts to.
Visualization of signals: Price / Kijun sen cross - the candle body must be between Min_Candlestick_Body and Max_Candlestick_Body. The candle must close above / below Kijun sen, minimum in 1/3 of its body. Open candle must be located above / below Kijun sen. Chinkou span must be under the price of 26 periods in advanc

库卡充满了开放的设置。
EA使用时间模式。 金融市场的交易在白天有周期性的活动。 优化的EA允许您识别和交易在白天最活跃的阶段。
EA交易趋势模式和反转模式。 设置EA并不复杂,但需要很长时间。 因此,在"讨论"部分中,将附加许多货币对的设置文件
发布了设置自己的说明。 EA由20块组成,每个块代表一个独立的EA,具有自己的设置。
所有之前从库卡系列购买的ea交易将使用一个set文件应用程序更新到这个版本。
设置。
批次大小-批次大小(如果使用风险%"0"")
风险%-取决于存款的手数
滑点允许的滑点
点差-一个有效的点差扩展
Magik_Number-唯一号码顾问
块#-块编号
使用块-true/false使用此块
开始小时-进入交易
开始分钟-分钟进入交易
Close Candles-交易结束后的蜡烛数量(在当前时间范围内)
止损-止损交易
获利-获利的贸易
Revers-与趋势或趋势相反的真/假输入
星期一-星期五-块作品的一周的真/假天
使用尾随-true/false
尾随开始-尾随开始尾随
追踪止损-追踪止损

Venom indicator is a new type of indicator for scalping with high accuracy of correct predictions in the indicator you can select the indicator signal does not redraw, does not disappear, you can trust it 100% When a red blue arrow appears under the candlestick, an UP option is purchased. When red arrows appear, the DOWN option is purchased. the indicator is based on our new development, if there is an order with a large amount that opens in the direction we need, according to the analysis of th

Каждый трейдер должен периодически проводить анализ результатов своей работы на валютном рынке, чтобы выявить сильные и слабые стороны своей системы. Для этого было бы не плохо видеть всю статистику в понятных глазу цифрах, желательно объединенных в табличную форму, чтобы оценка стала более детальной, была возможность узнать текущую доходность, просадку, профит фактор и многие другие характеристики. Существует множество серверов в интернете, которые могут создать мониторинг вашей торговли, обр
The Power 通过价格突破幅度与前期一段行情平均振幅比值计算多空力量强度,力度较强时则在图表上出现信号提示,以此预估下一波行情的涨跌方向。 指标没有未来函数,所有的信号出现后都不会移动或者消失,具有很好的实盘参考价值。 指标参数允许用户做个性化调整。 来自作者的更多EA和指标 https://www.mql5.com/zh/users/chenshaofei/seller
指标优势: 1、带有通道突破计算方案,短期的反弹不会干扰信号方向,有效过滤回调行情。 2、突破力度需要达到一定强度才会出信号,有效过滤假突破行情。 3、通道计算带平移指数,可有效识别巨幅V型反转。
参数说明:
FastMove - 短期波动幅度 SlowMove - 长期波动幅度 Shift - 平移指数(长期波幅统计偏移K线数) Power - 波动力量系数 BreakoutRange - 有效突破范围

This is a four strategy in one EA , but two of them have the same closing conditions if the Profit Target or Stop Loss is not reached , Strategy 2 and 3. The first strategy places Buystop/Sellstop orders at key price levels with small stops and closes by implemented indicator,after a certain number of bars or Take Profit function.The user may choose what option for closing may preffer . Close by Macd Offset parameter closes the order by Macd only after the number of bars for the open order h

Y-tax Telegram Bot sends text messages only to a group of telegrams or a channel of your choice. Messages are configured to display information about any trading activity on the account. A daily, weekly and monthly report is also displayed.
Below are the features of sending messages by a Y-tax Telegram Bot expert to a group / channel in a telegram:
Trading activities: opening, changing, closing deals and pending orders. This adviser does not need an active Auto Trading button. This Expert Advi

Hello investor! The author of ATS gave me the name Boom Boom Smer4 because I can break one currency pair into small pieces in four variations at the same time! This is far from my limit. What does an investor need from me!?
A large number of transactions?
Minimum deposit load?
Quality entry into the market?
Multicurrency?
Stable daily profit? The Trading Strategy, which the author laid in me, can do all this on his own!
PBX features: "Boom Boom Smer4" Analysis of several timeframes at t

Ultimate Price Predictor (Trade like a pro) Message Me Immediately After Purchase For Installation Help and Strategy
This is an arrow indicator that shows precise price reversals. A great arsenal to add to any chart.
Ultimate Price Predictor points price reversals with high degree of accuracy and it is great for scalping on the 5min time frame, Or swing trading on the 1hr time frame. Buy and sell arrows are shown on the chart as for entry signals. They do not repaint. *Great For Scalping *Grea
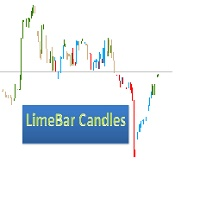
Colored candlesticks showing the trend. Based on the price action, it shows the trend and the possible moment of reversal.
No settings required. You can change the colors according to your preference.
Red and green show a trend beginning. The other two colors indicate a withdrawal or a contratrend. The indicator is used with resistance or support analysis. Make sure you use SL and TP, according to the price action.

BeST_Chande TrendScore Indicator points the start of a trend with high degree of accuracy and it is amazing for scalping on the 1min timeframe. It is also a simple way to rate trend strength. It indicates both the direction and strength of a trend and can be easily combined with various trend-following, swing and scalping strategies. As of a trend’s direction and strength a value of +10 signals a strong uptrend while a value of -10 signals a strong downtrend. Generally a positive score show

Boomerang Порядок работы
Советник не открывает следующий ордер, пока не закроется предыдущий. Советник не имеет блок модификации и не позволяет выставлять уровни TakeProfit и StopLoss, вместо этого выставляются уровни прибыли и убытка в денежном выражении. Это позволяет обойти минимальные уровни, установленные брокером. Номинальные значения, предустановленные в советнике соответствуют наибольшей эффективности на пятизнаке EURUSD и GBPUSD. Если в вашем терминале (у брокера) валютные пары имеют н

JRFX Trade Manager This product is a must have tool for every trader even if you trade manually or follow any signal providers via Telegram. You can set maximum 10 Take Profit levels and also you can choose the lot size what you wish to close as partial close at any Take Profit levels. At Take Profit 1 the EA will move SL to BE + X pips which is specified by you. At the next Take Profit levels you can set where you want the EA to move your Stoploss.
Settings Stoploss (Pips)
TakeProfit1 - Tak
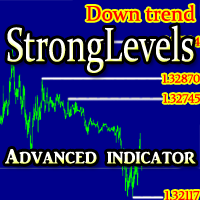
The indicator determines and reflects the significant support / resistance levels based on the algorithm for determining the volatility and the pattern in which the body of the candle is more than 2 times smaller than the size of the candle.
In addition, based on the received data, the indicator determines the prevailing current market movement. Settings: TimeFrame - timeframe to calculate; Candles in history - How many candles to take for analysis; Line color - the color of the support / resis
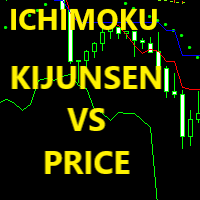
KijunSen vs Price Ichimoku Strategy MM Description in English and Italian =
This Indicator is based on one of the Strategies with Ichimoku Indicator, in particular is the cross of the KijunSen with the Current Price; it will give you of Buy and Sell when they Cross, with Arrows and Alerts.
When you attach the indicator on the chart , a window will open where , in the INPUT section, you can also choose to change the main Ichimoku values.
SIGNAL INPUT =
· BUY = when Price cross above the K

EA 處理急劇的價格變動,可以使用鎖定未平倉頭寸和金字塔。使用虛擬止損(止盈、追踪止損),訂單鎖定和止損佔餘額的百分比用於限制損失。可以同時打開幾十個訂單,顧問將需要自由資金來擺脫鎖定並根據總利潤關閉所有頭寸,在選擇交易工具數量時應考慮到這一點。
Expert Advisor 不依賴於它設置的時間範圍;計算中只使用價格和時間(但為了測試和優化,最好使用 M1)。要在真實賬戶上工作,建議使用具有最小點差和高波動性的貨幣對:EURUSD、GBPUSD、AUDUSD、USDCAD、USDCHF、USDJPY、NZDUSD。智能交易系統是為交易貨幣對而開發的,尚未針對金屬、合約、股票等進行測試。在真實賬戶上安裝之前,至少在過去 3 個月內在真實價格變動上測試智能交易系統。起始 0.01 手的推薦最低存款額為 500 美元。
如果價格沒有朝著我們的方向移動,那麼訂單被鎖定在指定的距離 FIX_LOCK_DISTANCE
下一個訂單的手數是這樣計算的,通過EXIT_LOCK_DISTANCE點,訂單上的利潤等於所有鎖定的頭寸的回撤,然後所有的頭寸從盈虧平衡點通過止盈或追踪止損。 LOT

If you use Resistance and Support Trendlines in your trading, this tool will be very useful for you! The Trendline Trading EA is a smart and easy tool to helps you in your trading using trendlines on your chart. Just create a trendline for the Resistance and Support, and the EA will create pending orders when the price touch the trendline. The following orders will be created when the price touch the trendline: Pending order in case the price breaks the trendline Pending order in case the price

TrailingAll_8 The utility determines an average value of the same-direction orders and a starting profit profit provided that the directions of orders are different (SELL or BUY outweighs). It can set a general TP estimating it based on the profit pips. It is also capable of tralling the profit. The utility marks the points where the orders are opened, too.
Input paremeters
Find by comment - a space where you can specify the parameter of order choice within the "comment" column of t

Arrow indicator, for timely entry on price reversals The arrow appears on the closed bar and does not disappear. Allows you to enter the transaction at the very beginning of the movement Can be used on any currency pairs, metals and cryptocurrency Suitable for working with binary options
Distinctive features Does not redraw; Determines the price correction; Advanced settings for fine tuning; Works on all timeframes and on all symbols; Suitable for trading currencies, metals, options and cryptoc

AutoTrader GBPUSD is a fully automated Expert Advisor. Stop Loss on every trade Trailing Stops Good Risk/Reward Ratio The EA can trade 24/7 without the need of News Filter VPS is optional Timeframe: M1 Recommended deposit: 1,000 USD Recommended Leverage: 1:500 For better results you must use a broker with Low Spreads Recommended Setting: StopLoss: 65.0 TakeProfit: 00.0 TrailingStop: 90 The EA open buy/sell trades only in trends so by not having a fix TP and instead using trailing stops we

ALPC forex Matrix produces signals based on five different strategies . ALPC forex Matrix copies itself to all charts. Quick and easy management is your responsibility. Forex trading is fast control. ALPC MATRIX FOREX SYSTEM DOCUMENTATION !Please open the scalp process according to the hourly trend direction. (does not work with strategy test)
ALPC MATRIX 2015-2019 Supportive EA Tool for all Forex Pairs Producer: Mehmet Ozhan Hastaoglu ALPC MATRIX Forex System is actually a supportive tool wher

Expert Advisor was designed for traders who use Ichimoku strategy in their own trade. The control panel and its excellent functionality allow you to quickly set parameters for transactions and positioning. Ichimoku Trade Panel is a fully complet system that I created for my own trading needs. The strategy conveniently combines manual trading with automatic trading. Some unusual functions are the result of my individual experience and several years of my presence on the market. Having a ready sce
Macd Martingale is an automatic expert advisor that uses a fully adjustable martingale. The MACD indicator with adjustable parameters is used as inputs. The specified takeprofit and stoploss levels are used to exit the position. General recommendation
The minimum recommended deposit is 1000 cents or other currency depending on the parameters of your account. Spread is recommended not more than 3 points. It is better to use those currency pairs where there are a lot of trend movements in any dir

SCISSORS — is an automated trading scalping system. The strategy is based on enter signals given by a modified indicator Zig Zag; the EA opens two pending orders - sell stop и buy stop - on peaks of the indicator, at break (false break) the order activates and runs profit trail. Simply the EA is cutting all that higher/lower to Zig Zag peaks. Trading strategy —trend scalping without use of grid, martingale, averaging, using stop loss, take profit and trailing stop. The number of trades per mo

【ZhiBiCCI】指标适合所有的周期使用,也适合所有的市场品种。 【ZhiBiCCI】绿色实线是逆转看涨背离。绿色虚线是经典的看涨背离。 【ZhiBiCCI】向红色实线是反向看跌背离。红色虚线是古典看跌背离。 【ZhiBiCCI】可以在参数里面设置(Alert、Send mail、Send notification),设置为(true)就可以发送即时信号到警报窗口、电子邮件、即时消息。 参数设置说明: 【displayAlert】:这是警报开关,设置成true,如果出现箭头就会自动警报提示;设置成false,则不会警报提示。 【sendmail_NO_OFF】:这是发送邮件的开关,设置成true,如果出现箭头就会发送邮件到你在MT4设置好的邮箱里面;设置成false,则不会发邮件。 【sendnotification_NO_OFF】:这是发送即时消息的开关,设置成true,如果出现箭头就会发送消息到你的移动设备;设置成false,则不会发消息。 更多好用的指标网址: https://www.mql5.com/en/users/zhengqiuyang/seller

This robot works in 60-minute periods. Opens a limited number of transactions when it reaches a specific transaction volume. You can run the following system if you want to open operations.
Set the amount of the lot from the set You can start the strategy test by typing the broker name of the Us30 or Dow symbol type and selecting the lot amount.
Symbol EA = US.30+ ( Sample Symbol Name Your Brokers )
Period : H1
( Cancellation and Money Back Guarantee within 7 Days )

No fabricated fake forward tests or meaningless optimized backtests. No artificial intelligence and similar things. In fact, there are frequently sharp differences between backtest results and actual results. One of the limitations of backtest is that they are generally prepared with the benefit of hindsight. Spider Bot Pro uses a developed innovative technology involving virtual grid. Simply put, Spider will build virtual grid in the background, using them to constantly monitor the market to he

This robot works in 15-minute periods. Opens a limited number of transactions when it reaches a specific transaction volume. You can run the following system if you want to open operations. Set the amount of the lot from the set You can start the strategy test by typing the broker name of the Brent or WTI symbol type and selecting the lot amount. Symbol EA = Oils+ ( Sample Symbol Name Your Brokers ) Period : M15 ( Cancellation and Money Back Guarantee within 7 Days )
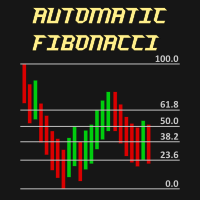
Automatic Fibonacci is an indicator for automatic Fibonacci Levels drawing. It is fully customizable by user. User can also select different Fibobonacci Levels by user settings or can use multiple Automatic Fibonacci indicator in one chart.
All details can be found >>HERE<<
Instructions Move Indicator to the chart (simply drag and drop) When pop up window appears select desired settings. Confirm settings and enjoy the Automatic Fibonacci indicator.
Features Any chart Any time-frame Custom

Eagle scalping is a fully automated Expert Advisor based on 3 EMAs and supporting 4 and 5-digit quotes. This EA provides the best results in an uptrend or a downtrend market. Main features: Scalping M5, M15 (best results M5) -Main Pair EUR/USD and any other pair -Money management (Risk reward and ratio % based on the account free margin) -Break Even and Trailing Stop -Days and Time Trading Management Recommendations EA Settings: Use default settings or the set file provided. Symbol: EURUSD Ti

Entry and Exit indicator simplifies the trading process by automatically providing the entry price and the take profit price with the appropriate stop loss. The indicator constantly monitors the market for the right entry conditions and send outs signals via push notifications to the trader's mobile phone or pc as desired. Hence a trader do not need to watch the chart all day but only act when signals are sent. This indicator is built around the 'H4 Engulfing System' and the 'Triple Stochastic S

A technical indicator that displays information about the trading volume in the form of a histogram of distribution by price levels. It is used as an independent indicator that helps to evaluate the current objective situation of the instrument, as well as in the format of integration with other methods of analysis, to confirm or filter when making trading decisions. Key Features:
Interactive profile update, real-time work Five modes of histogram calculation The possibility of separating the vol

ShangXia-指标适合所有的周期使用,也适合所有的市场品种。
【ShangXia】向上的箭头是(Buy)信号。 【ShangXia】向下的箭头是(Sell)信号。 【ShangXia】可以在参数里面设置(Alert、Send mail、Send notification),设置为(true)就可以发送即时信号到警报窗口、电子邮件、即时消息。 参数设置说明: 【alert_NO_OFF】:这是警报开关,设置成true,如果出现箭头就会自动警报提示;设置成false,则不会警报提示。 【sendmail_NO_OFF】:这是发送邮件的开关,设置成true,如果出现箭头就会发送邮件到你在MT4设置好的邮箱里面;设置成false,则不会发邮件。 【sendnotification_NO_OFF】:这是发送即时消息的开关,设置成true,如果出现箭头就会发送消息到你的移动设备;设置成false,则不会发消息。 更多好用的指标网址: https://www.mql5.com/en/users/zhengqiuyang/seller

The Gold30 Expert Adviser, uses simple moving average crossover system on the XAU/USD pair.Best optimized perform in H1 chart.
Don't use any kind of martingale, grid or hedge. Is very lightweight in CPU / RAM resources. Only launches once at the beginning of the bar.
Is very easy to setup and don't require any extra supervision, can be connected 24x7. It can be used by newbies. Try Back Test and Try on Demo Account and execute on Real Account.

This expert has been designed with manual traders in mind. It allows you to: Place and manage orders faster with keyboard shortcuts and in a visual manner Setup entry and exit points directly in chart Easily control risk and money involved in each operation DEMO warning: If you want to try the demo version do not download it directly as keyboard events do not work in the strategy tester. Please go to the following link instead for a limited trial version : https://www.mql5.com/en/market/pro

This indicator show you the begin of the Trend by drawing (Up/Down) arrow. It works using compatibility of current fame and the next 3 frames to make it more professional and more profitable. Features:- Simply it gives you entry point as arrow (Buy / Sell) after candle closed. You can use it on time frames ( M1 , M5 , M15 , M30 ) are more profitable. You can use it on any currencies pair. It is historical indicator. No Repaint. No additional indicator needed. Easy to use.
Indicator parameters:-

Leprechaun Scalper是一个多货币专家顾问,使用"恢复"(锁定)和平衡恢复的集成系统。 EA基于自定义指标"Elf",这本身就是一个交易策略。 顾问的工作原则-细分/回滚支助水平。 在这个版本中,为任何货币对和时间间隔成功交易配置参数的潜在能力得到了扩展。
添加了2个定时器,用于在消息发布时禁用ea交易。
添加了一个额外的指标来确定趋势的方向。
EA可以配置为任何交易风格-攻击性(高风险高收入)或平静(风险最小)
. 对冲头寸(锁定)和退出"锁定"的系统集成在一起,以保护您的余额。
"锁定"退出系统以统一的手数平仓,而不会干扰买入/卖出余额。
https://youtu.be/Bo7H6P3PQEc 的。 专家 顾问可以与12货币对和不同的时间图表同时工作。
只有1GBPUSD-5min货币对在ea中注册。 要获得的建议列表,请与我联系。
https://www.mql5.com/ru/users/alexkapkov/
碌莽禄掳:: -准确的市场条目
-集成位置锁定系统("锁定")
-集成平衡恢复系统(从"锁退出")
-有没有必要禁用顾问

该指标是两个改进的Lanczos滤波器的组合。 第一个过滤器用于推断价格。根据过去的价值,他预测当前柱内可能的价格变动。也就是说,它表明如果过去的趋势保持不变,价格会是多少。 第二个过滤器,用于平滑和平均窗口内的价格,由过滤器的级别决定。由于选择了权重,此过滤器最积极地响应价格变动中存在的周期性组件。 可以使用EF和IF参数调整指标。通过选择 EF 和 IF 的值,您可以获得有关趋势价格变动开始的信号。 EF - 指数滤波器的窗口大小。有效值为 EF = 0 ... 255 。并且在计算期间处理的条数是 2 * EF + 1 。该参数越大,价格序列的过去价值的影响越大。结果以实线绘制。 IF - 调整平均窗口的大小。 IF = 0 ... 255 的值。要计算的条数是 2 * IF + 1 。 IF 值越大,使用此过滤器检测到价格变动的较长时段。结果以虚线显示在图表上。
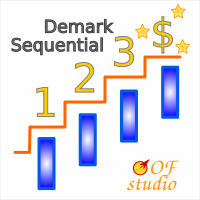
Demark Sequential - is an indicator that shows a structure of the trend, its start point and main turning points. And it check it's conditions on the beginning of the candle, so it will be never repainted.
This indicator hasn't any complex formulas, only some bars countdown, but it can be very helpful, especially with some levels indicator such as Fibo or Gann levels (like this ). Algorithm is so simple, but powerful: Setup - starting when current bar closed higher (or lower for short) then clos

这款ZiYouShuaDanWangEA只能用在EURGBP的30分钟周期。EURGBP M30 下面是参数介绍: 【Daily_Profit_Value_Switch】如果设置成:true;也就是【 Profit_as_of_today 】达到后就不再开单
【Profit_as_of_today】当日盈利是否大于100,如果大于100,当天就不开仓了
【Single_switch_on_Friday】如果设置成:false;也就是每周五不开仓,因为周五一般是比较重大的新闻公布时段,对市场的冲击大,所以行情波动会比较大,最好是尽量避开! 【Initial_Lots】也就是第一单下单的手数;后面加仓根据这单乘以倍数加仓! 【Maximum_odd_number_of_holdings】也就是允许有多少个没有平仓的单; 【Add_single_switch】 加仓开关, 如果设置成:true;也就是打开状态; 【Odd_multiple】就是加仓每单的单量相隔的倍数! 【Stop_Loss_and_Profit_Switch】如果设置成:true;就是打开状态; 然后每单就是设置【St

用在EURUSD M15. 用在市场【EUR/USD】的15分钟图表 全自动分析出顶部和底部,再根据顶和低下单,并且会立即设置止损。下单后,如果行情逆向行走,EA会再次加单,加单的次数和距离在参数里面可以设置,参数里显示的加单5次,实际最多加4次,并且加的单也都会立即设置止损,设置的止损跟第一单的止损是一样的价位。订单会在盈利的时候自动保护利润。 因为这款EA使用的是传统交易方式,带有止损,而且止损很小,所以测试的资金图不好看。 注意:使用的时候请把参数【Interval_or_continuous】设置为false。设置为false,保护利润会实时跟着行情走。 【Initial_lot】是初始下单的手数,如果【Auto_Lots】设置为true,此项参数就无效。 【Auto_Lots】是根据净值自动调整Lots,平均每1000美元会下0.01单。以此内推。 【Maximum_multiple】是最大加单次数,实际次数是【Maximum_multiple】-1次。 【Stop_points】是第一单的止损点数,后面的加单也都是第一单的价位。 【Adding_positions】是前一单

Introducing AMAN Signals.
An MT4 Indicator that predicts the trend where the prices are heading!
Indicator parameters Period 1 : the number of bars used for the indicator calculations. Proper values - Above 21. Multiplier 1 : Proper values - from: 5. Period 2 : the number of bars used for the indicator calculations. Proper values - Above 21. Multiplier 1 : Proper values - from: 5. Using the AMAN Signals FAST Indicator: Green: Buy or Bullish Candle Red: Sell or Bearish Candle Strength Percentag

这种多时间框架和多品种背离仪表板指示器会在在多个时间框架而不是单个背离中识别出一个或两个不同的背离时发送警报。它可以用于从 M5 到 MN 的所有时间范围。可以启用移动平均线或 RSI 趋势过滤器以仅过滤掉最强的设置。结合您自己的规则和技术,该指标将允许您创建(或增强)您自己的强大系统。 特征 可以检测以下振荡器/指标的背离:MACD(信号线或主线(直方图))、随机指标、OsMA、RSI、CCI、Awesome、OBV、ADX、ATR、MFI、动量和加速器。 可以选择要在仪表板中显示的时间范围。 在仪表板内持续执行发散等级排序。可以禁用此排序,以便更轻松地找到特定符号。然后,交易品种将按照它们在交易品种参数中输入的相同顺序显示,或者按照它们在市场观察窗口中的显示顺序显示。 通过在矩形内单击,将打开一个带有相关交易品种和时间范围的新图表。 指标可以将信号写入全局变量,智能交易系统可以使用这些变量进行自动交易。比如 这个产品 。 将指标放在一张图表上就足够了,您将收到来自您选择的任何交易品种的警报。支持所有 Metatrader 原生警报类型。 将考虑常规/经典(趋势逆转)和隐藏(趋势延续

Trade with Gann on your side!! MASTER CIRCLE 360 CIRCLE CHART, originally created by Gann admitted that this is “The Mother of all charts”. It is one of the last studies that this great trader left for us. The numeric tab le is apparently quite simple like all the tables and is based on square numbers, the SQUARE OF 12 and is by evolution, one of the most important square numbers. Here we can find CYCLE, PRICE AND TIME thanks to angles and grades, to show past and future support and resistance.

This indicator MA Alerts with Arrows gives you the opportunity to receive signals about the intersection of two moving averages (Moving Average), as well as signals about the price rollback to MA - to enter the transaction. Alert options: Sound and text alerts (alert). Push notification to the mobile terminal. Email notification (message to your e-mail). Visual alert (arrows on the chart). The indicator has the following features: To display or hide the moving averages and arrows themselves. T

T-Explorer is a Real Time Optimized MetaTrader 4 tool that provides tradable information based on the 10 of the most popular and reliable technical indicators in many timeframes. Our machine learning models calculate the optimum rules and configuration for each indicator in order to provide high probability signals of success. Users are able to customize T-Explorer by selecting suitable timeframes and mode ( FAST, MEDIUM, SLOW ) for the indicators to be used. T-Explorer aggregates an

Currency Explorer is the absolute tool for traders that want to know with quantified certainty the currency strength & weakness of each currency and to trade these by using applicable strategies. Our machine learning models run and provide the strength/weakness of each currency based on multiple factors besides price action. It provides the trader with a QUANTIFIED result for the strength of the 8 most popular and major currencies (EUR, USD, JPY, GBP, AUD, NZD, CAD and CHF) with a scale

Χ15 indicator is a MetaTrader 4 tool that allows you to BUILD & BACKTEST ON REAL TIME your own strategies quickly, easily and efficiently. It contains 15 of the most popular technical analysis indicators that you can use, each one in a different way. Choose the indicators that you want to use, select how you will use them and you will see on the chart BUY (green) and SELL (red) arrows implementing your strategy. Choose Take Profit and Stop Loss and you will see the results of your strategy w

Pattern Explorer is a reliable tool for applying all the power of the most popular Japanese Candlestick Patterns . It uses Machine Learning algorithms to confirm all the patterns. What is the most impressive thing about it? Select Take Profit and Stop Loss and click on “Backtest your strategy” button to backtest your strategy in real time and to see according to your selection: Total signals Testable signals (signals that are reliable to be tested) Profitable signals (%) Loss signals (%) T

With this software you can test your Forex strategies live. Compatible with Meta Trader 4. Extra features are available. You can trade through the panel. You can put signs with Fish Hook. In addition, your strategy test is saved to the file folder in csv format. You can review these reports with CSV Quick Viewer. One Lot can do with Scalp. Your account also determines the lot based on the amount of money found. It gives you information about the transaction before you open the transaction. You c

This is our Expert Advisor base on research over the Internet. This Expert Advisor use RSI check TF 1 Hour and for execution, Install it at TF 5 Minutes (double Check 24 last bar), It's code contains CCI Filter as consideration for Long or Short Trade. When the market turned to wrong direction, expert advisor will double it lot in the same direction, until all the losses on the OP before it will be covered. This EA include News Management, so it doesn't trade when there is high impact news. It's

ATTENTION : The Tiger Locker EA can not be tested in the MT4 strategy tester !!!
Tiger Locker EA robot is a very Powerful tools and a fully automated robot for Forex trade. Tiger Locker EA is a combination numerous special trend strategy ,that It provides the possibility the best entries of the trade . Tiger Locker EA robot is designed for medium and long term trading ,the robot will help you deal with and manage emotions ,and you don't need worry about news release any more !! The tren
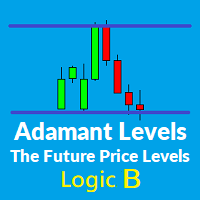
首先,我要感謝大家“Adamant Levels Logic A”取得的巨大成功
有關邏輯A的更多詳細信息,請參閱以下鏈接:
https://www.mql5.com/en/market/product/36082
在成功之後,我很有信心,這個“Adamant Levels Logic B”指標也將在您成功的交易運營商中發揮重要作用。
堅定級別簡介:
免責聲明: 如果您正在尋找一個花哨,色彩鮮豔,引人注目的指示,請遠離。
沒有考慮價格可以保持,反彈或突破的水平,任何交易者都不能成為一個好交易者。
這些水平幫助交易者以更便宜的價格進入市場。它們可以是支撐阻力,需求供給,支點,斐波納契水平等。
經過多年對價格圖表的研究和分析,我發現很少有復雜的算法和邏輯來找出未來可能的價格行為。
在某些價格點上應用這些邏輯和算法,我達到了價格可以反彈或突破的水平。
我將它們命名為“Adamant Levels”。
是的,它們本質上是堅定的和靜態的。
價格被這些水平吸引並擊退。
這些是未來的價格行為水平,交易者可以通過更高的風險回報率進入市場。
大多數觸發點如價格模

An automated Expert Advisor that uses Price action techniques.
It is developed and tested repeatedly.
It is the only EA in the market that has passed 29 years of backtesting from 1990 to 2019.
Recommendation:
EURUSD
1hr timeframe
Use the settings found on the comment page.
You can play around with the settings like the deposits and lots. Do not change the take profit and stoploss settings.
Pivot Point Breakout Tracker is a "Lite" version of the Pivot Point Trading System expert advisor (EA) that implements only one of its strategies – the strategy based on the Pivot Point level breakout . The EA works best with GBP/USD on the M15 time frame in the GMT+2 time zone . The time zone is set by the user that allows overcoming the restriction associated with the time settings of the terminal. The principle of the EA is to open a position in the direction of the Pivot Point level breakout
MetaTrader市场是一个简单方便的网站,在这里开发者可以出售自己的交易应用程序。
我们将帮助您发布您的产品,并向您解释如何为市场准备您的产品描述。市场上所有的应用程序都是加密保护并且只能在买家的电脑上运行。非法拷贝是不可能的。
您错过了交易机会:
- 免费交易应用程序
- 8,000+信号可供复制
- 探索金融市场的经济新闻
注册
登录