YouTubeにあるマーケットチュートリアルビデオをご覧ください
ロボットや指標を購入する
仮想ホスティングで
EAを実行
EAを実行
ロボットや指標を購入前にテストする
マーケットで収入を得る
販売のためにプロダクトをプレゼンテーションする方法
MetaTrader 4のための有料のテクニカル指標 - 118
Overview The MACD Divergence Indicator is a powerful tool designed to detect potential trend reversals by analyzing divergences between price action and the MACD (Moving Average Convergence Divergence) indicator. It automatically identifies and highlights bullish and bearish divergence signals directly on the chart, making it easier for traders to spot high-probability trading opportunities. Key Features Customizable Settings: Includes adjustable parameters to suit various trading styles and tim

How the Indicator Works MultiMarket Direction is a powerful and versatile indicator for the MetaTrader platform, designed to help traders visualize market trends and identify potential entry points. By combining time-tested technical analysis tools such as Exponential Moving Averages (EMAs) and high/low levels, this indicator provides a clear and comprehensive view of market dynamics. The indicator displays the following on the chart: EMA 21, EMA 81, and EMA 200 : Three moving averages with cust
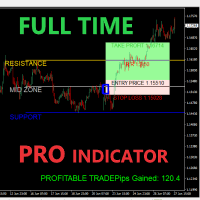
Dear traders,
Welcome to the Full Time Pro Indicator – a professional-grade trading assistant built to help you make informed decisions through a visually intelligent and highly interactive chart interface. Whether you're a beginner or an advanced trader, this guide will walk you through every feature of the indicator so you can maximize your charting experience with precision and ease.
️ Recommended Timeframe Best used on the 1-Hour (H1) timeframe
While the indicator works on all timefra
I'm not here to sell you dreams or promise you'll quit your job next month. This indicator identifies three proprietary patterns that 99% of traders have never seen before. Why? Because I discovered them myself and spent countless hours refining the detection algorithm to only show you the absolute best setups. I've included 11 real chart screenshots across different assets. Go ahead—try to spot these patterns yourself. If you can identify them without the indicator, then congratulations. You ha
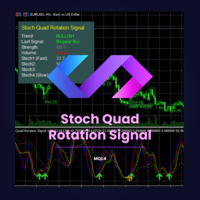
Stoch Quad Rotation Signal (MQL4)は、MetaTrader 4向けの高度なテクニカルインジケーターで、複数のストキャスティックオシレーターと強力なトレンドフィルター、ボリュームフィルター、パターンフィルターを統合し、スコアリングシステムやマルチタイムフレーム分析も備えています。高確率のトレード機会を明確かつ正確に特定することを目的として設計されています。 主要機能: 四重ストキャスティック分析: ストキャスティックオシレーターの異なる4つの設定(カスタマイズ可能なK、D、スムージング期間)を同時に使用し、オーバー売買状況の詳細な多感度な視点を提供します。これにより、市場のさまざまな「スピード」での動きを捉えることができます。 スマートトレンドフィルター: ファスト、ミディアム、スロウの指数移動平均線(EMA)に基づく堅牢なシステムを採用しています。主なトレンドに対して逆方向の信号をフィルタリングしたり、EMAの傾きを確認したり、価格が重要なEMAとの位置関係を検証することができます。 多様なトレード信号: 次のようなさまざまなタイプの信号を生成します:
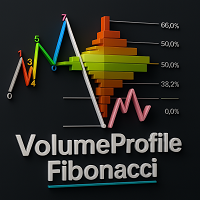
Description: Elevate your chart analysis with this advanced indicator that seamlessly integrates Zigzag structures, Fibonacci retracements, and Volume Profile insights. Designed for traders who seek clarity and precision, this tool visually identifies high-probability price patterns and market turning points.
Whether you're tracking CHOCH shifts, pinpointing POIs, or analyzing TRIPLE tops and FLAG formations, this indicator offers the depth and flexibility to adapt to any trading strategy.
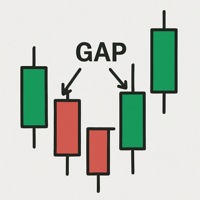
A gap is a space on the chart between two consecutive candlesticks where no trading occurred between the close of one candle and the open of the next. In the Forex market, gaps mainly appear at the weekly open, reflecting events or expectations from the weekend. Technically, a gap may indicate an imbalance between supply and demand. Strategies use gaps as signals of possible trend continuation or reversal, offering opportunities for technical analysis based on liquidity and momentum.
SNR INTRADAY is a non-repainting support and resistance indicator built for intraday trading. It automatically projects horizontal levels based on the average daily percentage movement, calculated from over 20 years of historical daily candle data . The indicator is designed to help you identify high-probability entry zones , target areas , and risk levels that are likely to be reached within the same trading day .
If your broker uses symbols with suffixes (e.g., “XAUUSD.m”, “EURUSD.pro”), the
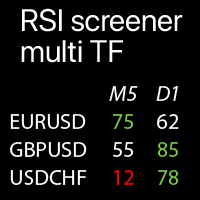
選択したシンボルのマルチタイムフレームRSI値:現在の市場トレンドを比較 この インジケーター は、選択したすべてのタイムフレームとシンボルのRSI値を1つのテーブルに表示し、現在の市場価格トレンドをすばやく分析できます。
私の 多機能ユーティリティ : 66+機能 | お問い合わせ ご質問はこちら | MT5バージョン 各 シンボル はカスタマイズ可能です:削除/置換。最大40シンボルまで追加できます。 パネルはチャート上の任意の場所に移動できます(ドラッグして移動)。
入力設定 で以下を設定できます: RSIインジケーター設定: 期間と適用価格 。 各タイムフレーム を有効/無効にできます 。 ハイライト オプション:有効にすると、極端なレベルがカスタムカラーで強調表示されます。 極端なレベル 設定:例えば、入力が25の場合:25以下の値は低いと見なされ、RSI 75+は高いと見なされます。 アラート :極端なレベルに対して有効にできます:高いRSI / 低いRSI / 両方。 視覚的 スタイル:サイズ、ダーク/ライトテーマ、ハイライトカラー。 相
Multi-Timeframe Order Block Indicator for MT4 This indicator automatically detects and draws bullish and bearish order blocks from up to three different timeframes on your chart. Each OB is clearly labeled with its timeframe, direction (Bullish/Bearish), and an arrow for easy identification.
You can set a separate color for bullish and bearish blocks for every timeframe, choose how many recent OBs to show, and customize all settings easily from the inputs. Supports any timeframe (M1, M5, M15, et

ストライクブレイクアウト – レンジベースのブレイクアウトレベル
ストライクブレイクアウト インジケーターは、カスタマイズ可能な日中範囲を毎日チャート上に描画し、トレーダーが主要なブレイクアウトゾーンと潜在的な価格変動を正確に特定するのに役立ちます。
カスタム時間範囲 ユーザーは日次レンジの開始時間と終了時間を正確に設定できるため、さまざまな戦略や取引セッション(日次オープンレンジ、ロンドンオープン、ニューヨークオープン、アジアセッションなど)に柔軟に対応できます。
レンジ乗数に基づくブレイクアウトレベル このインジケーターは、メインレンジに加えて、ユーザー定義のレンジ乗数(例:0.0倍、1.0倍、2.0倍)に基づいて追加のレベルをプロットします。これらのレベルは、ブレイクアウトターゲット、サポート/レジスタンスゾーン、または取引のエントリー/エグジットシグナルとして機能します。
完全にカスタマイズ可能なビジュアル レンジボックスとブレイクアウトレベルの色はすべてカスタマイズ可能です。チャートのテーマや取引の好みに合わせて、外観をカスタマイズできます。
表示履歴の制御 チャー

ตัวบ่งชี้ Sniper Zones Pro - คำอธิบายการใช้งาน ตัว บ่งชี้ Sniper Zones Pro ออกแบบมาเพื่อช่วยให้ผู้ซื้อขายระบุ "โซน" ราคาที่สำคัญและจุดเข้า/ออกที่แม่นยำสำหรับการซื้อขายได้อย่างรวดเร็ว โดยมุ่งหวังที่จะเพิ่มผลกำไรสูงสุดหรือจำกัดความเสี่ยง ตัวบ่งชี้ทำงานโดยคำนวณและแสดงระดับราคาตามค่าเฉลี่ยเคลื่อนที่ถ่วงน้ำหนักเชิงเส้น (LWMA) และให้คำแนะนำในการทำกำไร (TP) และหยุดการขาดทุน (SL) แบบไดนามิก ส่วนประกอบและหลักการทำงาน: การคำนวณระดับราคา: เส้นหลัก (L2 - จุดเข้า): เส้นสีแดงนี้แสดง ค่าเฉลี่ยเคลื่อนที่ถ่วงน้
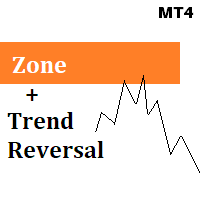
Zone + Trend Reversal System
There are many many situations you may want to use this indicator and you may not want to. Please refer the doc attached in the comment section for complete guidance. Check comments for manual. Keep in mind, Once you make the purchase please reach out to me when you are in the testing phase so i could answer your queries when you are stuck and confused because most of the time we fail because we keep going in a wrong direction without asking for the help. Read the m
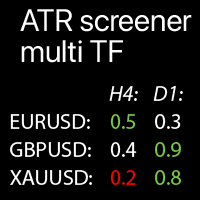
選択したシンボルのマルチタイムフレームATR値:現在の市場トレンドを比較 この インジケーター は 、 選択した すべての タイムフレーム と シンボルの ATR値を 1つの テーブルに 表示 し、 現在の 市場価格の トレンドを すばやく 分析 できます。
私の 多機能ユーティリティ : 66+ 機能 | ご質問は お問い合わせください | MT5版 各 シンボル はカスタマイズ可能です:削除/置換。最大40シンボルまで追加できます。 現在のATRの 偏差率 (平均値との比較): マウス ホバーで 確認 できます。 パネルはチャートの任意の場所に移動できます(ドラッグ可能)。
設定 では以下を構成できます: ATRインジケーター設定: 期間 。 各タイムフレーム を有効/無効にできます 。 ハイライト オプション:有効にすると、極値レベルがカスタム色で強調表示されます。 極値%値 :例えば25%を入力した場合: 平均ATRの125%以上の値は高と見なされます; 平均ATRの75%以下の値は低と見なされます;
平均ATR値を計算するために分析される バーの数

GANN Forecaster – Precision Tool for Forex Traders (MT4) Elevate your trading with the Gann Forecaster Scanner for MetaTrader 4. This powerful, interactive tool provides precise price and time projections, giving you a professional edge across Forex, Gold, Indices, and Crypto markets. Building on the robust functionality of the Gann Forecaster indicator, this advanced scanner offers multi-pair analysis, continuously calculating Gann levels and alerting you to optimal trade entry points. A clea
A binary options styled indicator to trade fair value gaps and line breaks. Its robust nature makes it standout from other binary options indicators. With the right setup strategy, which I will provide after purchase, you will enjoy smooth operations of the indicator. BinaryBlockBreaker is coded with third-party applications such as http://www.mt2trading.com/?ref=1341 Please signup and download the needed software to provide smooth user experience.
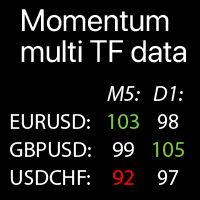
選択したシンボルのマルチタイムフレームモメンタム値:現在の市場トレンドを比較 この インジケーター は、 選択した すべての タイムフレーム と シンボルの モメンタム インジケーター の 値を 1つの テーブルに 表示し、 現在の 市場 価格 トレンドを すばやく 分析 できます。
私の 多機能ツール : 66+ 機能 | ご質問は お問い合わせください | MT5版 各 シンボル はカスタマイズ可能です:削除/置換。最大40シンボルまで追加できます。 パネルはチャート上の任意の場所に移動できます(ドラッグしてください)。
設定 で以下を構成できます: モメンタムインジケーター設定: 期間、適用価格タイプ 。 各タイムフレーム を有効/無効にできます 。 ハイライト オプション:有効にすると、キーレベルがカスタムカラーで強調表示されます。 極値(キーレベル) : 高値と低値; アラート : 極値レベルで有効にできます:高モメンタム / 低 モメンタム / 両方。 視覚的 スタイル:サイズ、ダーク/ライトテーマ、ハイライトカラー。 モメンタム指標 (
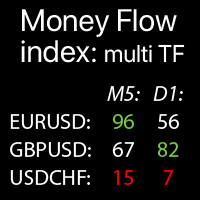
マルチタイムフレームマネーフローインデックス:選択したシンボルのデータ:現在の市場トレンドを比較 この インジケーター は 、 選択した すべての タイムフレーム と シンボル の MTF(マネーフローインデックス) データ を 1つの テーブル に 表示 し 、 現在の 市場 価格 トレンド を すばやく 分析 できます。
私の 多機能ツール : 66+ 機能 | ご質問はこちら まで | MT5版 各 シンボル はカスタマイズ可能です:削除/置換。最大40シンボルまで追加できます。 パネルはチャート上の任意の場所に移動できます(ドラッグ可能)。
設定 では以下を設定できます: MFIインジケーター設定: 期間 。 各タイムフレーム を有効/無効にできます 。 ハイライト オプション:有効にすると、キーレベルがカスタムカラーで強調表示されます。 極値(キーレベル) : 高値と安値; アラート : 極値レベルで有効にできます:高MFI / 低 MFI / 両方。 視覚的 スタイル:サイズ、ダーク/ライトテーマ、ハイライトカラー。
MFIの仕組み:

The Dragon's Pulse Oracle - A Mystical Market Divination Tool In the ancient halls of trading lore, where fortunes rise and fall like the breath of dragons, the Dragon's Pulse Oracle emerges—a powerful indicator forged from the wisdom of seers and the primal energy of the markets. This mystical tool reveals the hidden currents of price action, transforming raw data into prophetic visions of bullish fire and bearish shadow. The Oracle's Wisdom The Dragon's Pulse Oracle interprets the market's
The Multi-Currency Indicator Dashboard for MT4 is an assisting tool designed to monitor up to 10 currency pairs across 6 essential indicators in one compact, color-coded dashboard. Ideal for traders who value efficiency, this tool eliminates the need to switch between charts or timeframes. Whether you're a scalper, swing trader, or trend follower, this dashboard gives you an instant visual overview of market conditions across your preferred symbols and indicators. Note : This indicat
Average Sentiment Indicator for MT4 is a composite oscillator that combines the insights of five conventional technical indicators — Relative Strength Index ( RSI ), Stochastic ( STO ), Money Flow Index ( MFI ), DeMarker ( DeM ), and William's %R ( WPR ) — into a single line ranging from 0 to 100. It is the arithmetic average of the five indicators after normalization. This tool is ideal for traders who want a noise-reduced perspective of overbought and oversold zones, potential

Auto Price Squeeze Levels The Auto Price Squeeze Levels indicator is designed to help traders easily and automatically identify and track "Price Compression" (or Price Squeeze) conditions on their charts. Price compression refers to periods where market volatility decreases, and price movements become increasingly confined within a narrow range. This often serves as a significant signal indicating the accumulation of energy before a major price movement (Breakout) is likely to occur in the near
RSI Momentum Shift Detector is designed to detect significant changes in price momentum using the Relative Strength Index (RSI) and divergence patterns, with the goal of providing visual signals and useful alerts for trading in financial markets. Main Features RSI Divergence Detection: Identifies four types of divergence: Regular Bullish Divergence: when price makes a lower low, but RSI makes a higher low. Regular Bearish Divergence: when price makes a higher high, but RSI makes a lower high.

Auto Buy/Sell with MA Cross for MT4 – Your Smart Trade Assistant! Take the guesswork out of trading with this powerful Moving Average crossover indicator for MetaTrader 4 .
It automatically identifies Buy and Sell opportunities using fast and slow MA crossovers – and shows clear visual signals on your chart. Whether you're a beginner or pro, this tool brings precision, clarity, and confidence to your trading strategy. Key Features: Auto Buy/Sell Signals based on MA crossover Up & Down

Double Fractal Entry generates precise entry signals based on smart fractal breakouts or rebounds. It visualizes market structure with dynamic channels and plots clear SL/TP levels. A powerful tool for trend and reversal traders. This product is also available for MetaTrader 5 => https://www.mql5.com/en/market/product/143601 The indicator generates entry points based on two configurable strategies: Fractal Breakout – when price breaks the last key fractal; Fractal Rebound – when price bounces

Professional Cumulative Delta & Volume Median Indicator Track real buying/selling pressure with this powerful volume analysis tool. The Volume Compare Indicator combines Cumulative Delta and Volume Medians to help you identify institutional activity, imbalances, and potential reversals. Key Features: Cumulative Delta Histogram – Visualizes net buying vs. selling volume in real-time.
Buy/Sell Volume Medians – Horizontal lines showing average buy & sell volume lev

Dynamic CMF Calculation: Customize the period for the Chaikin Money Flow (CMF) to fine-tune your analysis and maximize signal precision. Intuitive Color-Coded Alerts: Instantly interpret market conditions with clear visual cues: Green Alert: Indicates the Overbought zone – signaling a potential selling opportunity. Red Alert: Indicates the Oversold zone – suggesting a potential buying opportunity. Gray Alert: Represents the Neutral zone – a signal to wait for a confirmed trend or re

Presentation of the Indicator: Volume Divergence Pro Discover hidden market opportunities at a glance. Volume Divergence Pro is an advanced technical analysis tool specifically designed for the MetaTrader 4 platform. This powerful indicator combines three of the most widely used volume indicators — OBV , ADL , and VPT — along with automatic divergence detection, visual lines, entry signals, and a complete alert system, all in one intuitive interface. Perfect for both beginner and professional

The Color Change MA is a versatile custom indicator designed for MetaTrader 4, providing clear visual signals on trend direction and momentum. It features a Moving Average (MA) line that intelligently changes color based on the MA's position relative to the current candle's open and close prices, with an optional but powerful RSI (Relative Strength Index) filter for enhanced confirmation. Key Features: Dynamic Color-Changing MA: Green: Indicates a bullish bias. By default, this occurs when the M

https://youtu.be/DhM7se_ePw8
ACE 4X FIBONACCI - Professional Trading Intelligence The Ultimate Fibonacci Retracement System Transform your trading with ACE 4X FIBONACCI - a meticulously engineered indicator that brings institutional-grade Fibonacci analysis directly to your MT4 platform. Built for serious traders who demand precision, speed, and style. PROFESSIONAL TRADING REDEFINED Experience the power of advanced Fibonacci retracement analysis through our revolutionary Luxury Theme interfac
Oscillator Alerts MultiPanel All oscillator signals — in a single panel!
A professional multi-panel tool for market control, based on major oscillators with a flexible alert system and unique interactive management features. Description Oscillator Alerts MultiPanel is an innovative tool for traders that brings together multi-symbol and multi-timeframe analysis, flexible notifications, and the most convenient interactive control — all right on your chart. Key Advantages Interactive Oscillator Se
# Apex Arrows – Professional Trading Signals Indicator
## General Description
**Apex Arrows** is a powerful technical indicator specifically designed for advanced traders seeking accurate and automated real-time signals. This indicator combines multiple technical strategies into a single visually intuitive tool, ideal for trading markets such as forex, indices, and commodities on the **MetaTrader 4/5** platform.
Based on Exponential Moving Averages (EMA), RSI, Stochastic, ADX, and auto
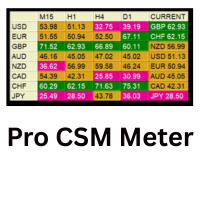
Pro CSM Meter – Professional Currency Meter Pro CSM Meter is a powerful tool for analyzing the strength and weakness of currencies in real time. It helps traders identify the strongest and weakest currencies at any given moment and understand the current trend direction more clearly. This can be used to filter currency pairs and improve decision-making in manual trading strategies. https://youtu.be/YUA-yD_khLM
The price will increase by $50 with every 5 purchases. Final price $300 Key Features

PLEASE REVIEW THE ATTACHED IMAGE CAREFULLY BEFORE READING FURTHER This indicator is designed for MetaTrader 4 (MT4) and focuses on a dual-band envelope system to help traders identify liquidity zones and extreme price levels with clarity and precision. If you purchase this indicator, please contact me via email with your payment receipt attached. I will provide you with a detailed user guide and trading strategy for effective application. I. DUAL ENVELOPE INDICATOR FOR MT4 A simplified yet power
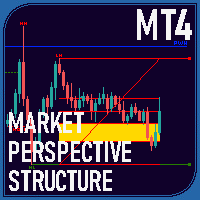
Overview The Market Perspective Structure Indicator is a comprehensive MetaTrader indicator designed to provide traders with a detailed analysis of market structure across multiple timeframes. It identifies and visualizes key price action elements, including swing highs and lows, Break of Structure (BOS), Change of Character (CHOCH), internal structures, equal highs/lows, premium/discount levels, previous levels from higher timeframes, and trading session zones. With extensive customization opt
One Shot One Kill — Trend-Based Entries Precision entries. No clutter. No tweaking. Just add to chart and trade. About the Indicator One Shot One Kill is a clean, plug-and-play signal algorithm designed to deliver high-probability trade entries using a proprietary algorithm. Whether it’s a trend reversal or a trend continuation , this tool identifies precise entry points — with no inputs, no recalibration, and no second-guessing. Key Features: Simple & Automatic : Add to chart, and you're ready

MurreyGannQuantum - Professional Trading Indicator Advanced Murrey Math & Gann Angle Technical Analysis with Complete EA Integration Professional technical indicator combining Murrey Math level analysis with Gann angle calculations. Features comprehensive visual analysis, multi-timeframe adaptation, and complete EA integration capabilities for automated trading systems. The blog: https://www.mql5.com/en/blogs/post/763757
CORE FEATURES Technical Implementation: Murrey Math Levels: 9 dynamic su

The Volli v9 indicator is based on the analysis of zones built on volumes. That is, it is based on the analysis of how the price behaves near/in these zones, whether it rebounds, moves further, or does not react. The indicator also displays the aggregate strength of currencies, recommended stops, trend direction, volume trend and their changes.
Also there is EA. https://www.mql5.com/en/market/product/145026?source=Site +Profile
Description 1) The arrows. Drawn on the current candle. On the

指標はトレンドの方向、エントリー用の矢印、および取引における最適なエグジットポイントを表示します。すべてのシグナルの統計情報も表示され、より詳細な取引分析が可能です。
MT5用インジケーターバージョン
機能 この指標は再描画しません。 暗号資産、株式、金属、指数、商品、通貨など、あらゆる資産の取引に利用可能です。 すべての時間枠で機能します。 エントリーシグナルは新しいローソク足の開始時に表示されます。 トレードの退出シグナルは概算値であり、より高い利益でトレードを終了できる場合があります。 左上部に詳細なトレード統計パネルがあり、折りたたむことができます。 M1からW1までの時間枠でトレンドの方向を即時表示します。 軽量なコードのため、ターミナルを過負荷にしたり遅くしたりしません。 取引エントリーシグナルを逃さないため、アラートウィンドウとプッシュ通知で通知を受け取ることができます。 初心者から専門家まで、すべてのレベルのユーザー向けです。 統計パネル シグナル履歴の取得対象日数。 統計が提供されるシグナルの総数。 利益と損失のシグナルの比率。 総数に対する利益シグ

Purpose : The AllAverages indicator plots a moving average line on the chart, with options to select from a wide range of MA types and price applications. It also displays buy and sell signals as arrows when the trend changes, and supports alerts (sound, email, push notifications) for these signals. Key Features : Supports multiple moving average types (e.g., SMA, EMA, HMA, TEMA, etc.). Allows customization of the price type (e.g., Close, Open, High, Low, Heiken Ashi variants). Displays a colore

Momentum Hunter – 高度なリペイントなしモメンタムインジケーター Momentum Hunter は、新しいモメンタムを検出し、トレーダーが市場の動きを正確に捉えるために設計された強力で信頼性の高いインジケーターです。特に M1タイムフレーム 用に最適化されていますが、上位タイムフレームでもシームレスに動作し、スキャルパーやスイングトレーダーにも適しています。 主な特徴: リペイントなし & 遅延なし :シグナルは安定しており、矢印はローソク足が確定した後にのみ表示されます。 シンプルなインターフェース :矢印、ストップロスラベル、トレーリングストップラベルのみが表示され、複雑なボタンなどはありません。 即時アラート :シグナルが表示されるとすぐにMetaTraderとモバイルデバイスに通知が届きます。 全てのトレーダー向けに設計 :M1でスキャルピングをする場合でも、上位タイムフレームでトレードする場合でも、Momentum Hunterはあなたのスタイルに適応します。 この高度なツールは、複数の実証済み戦略を組み合わせています:
移動平均線 でトレンド方向を分析
ボ

このインジケーターは、トレンドの方向、参入ポイント、最適な取引の退出ポイントを示します。また、トレード分析を向上させるためにすべてのシグナルの統計情報を表示します。 MT5用インジケーターバージョン
特徴 このインジケーターは再描画しません。 暗号通貨、株式、金属、インデックス、商品、通貨など、あらゆる資産の取引に使用できます。 すべての時間枠で機能します。 参入シグナルは新しいローソク足の開始時に表示されます。 退出シグナルはおおよそのもので、しばしばより大きな利益で取引を終了できます。 左上に詳細な取引統計パネルが表示され、折りたたむことができます。 M1からW1までの時間枠でトレンドの方向を表示します。 軽量なコードで、ターミナルに負荷をかけたり遅くしたりしません。 参入シグナルを見逃さないように、アラートウィンドウやプッシュ通知で通知を受け取ることができます。 初心者からエキスパートまで、あらゆるレベルのユーザーに適しています。 統計パネル シグナルの履歴を取得する日数。 統計が提供されるシグナルの総数。 利益を上げたシグナルと損失を出したシグナルの比率。 総シグナルに対する
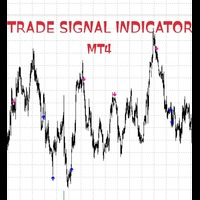
ULTIMATE BUY & SELL ARROW INDICATOR MT4 - Professional Trading Signals! CRYSTAL CLEAR TRADING SIGNALS WITH PRECISION ACCURACY. WORKS ON ALL TIME FRAME, BEST ON 1HR TIME FRAME WHAT MAKES THIS INDICATOR REVOLUTIONARY? NO REPAINTING - NO GUESSWORK - NO REGRETS! 100% ACCURATE SIGNALS that never change or disappear ZERO OFFSET - Signals appear exactly when they should PERFECT PRECISION - Best O INSTANT VISUAL CLARITY CRYSTAL CLEAR BLUE ARROWS for BUY signals STRIKING PINK ARROWS for SELL s
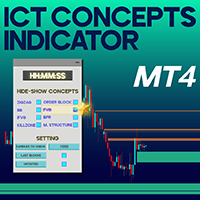
ICT Concepts Indicator for MetaTrader 4 The ICT Concepts Indicator for MetaTrader 4 is a specialized tool crafted for advanced traders. It delivers a comprehensive suite of Smart Money and ICT methodology elements via an intuitive control panel. This indicator enables traders using ICT principles to effortlessly incorporate elements like Order Blocks, Fair Value Gaps (FVG), Breaker Blocks, Market Structure insights, and Kill Zones into their market analysis workflow. «Indicator Installation & Us
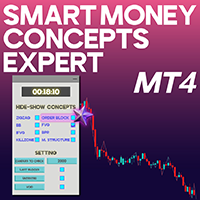
Smart Money Concepts Expert MT4 The Smart Money Concepts Expert MT4 is developed to automatically showcase Smart Money-related elements directly on the chart. This expert tool adds a floating control panel, letting traders manage visibility for different analysis components. Each part of the panel reflects a vital market structure element, allowing users to toggle automatic drawing on or off as needed. «Indicator Installation & User Guide» MT4 Indicator Installation | Smart Mony Concepts SMC I
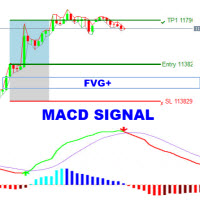
The MACD-FVG Signal System is a hybrid trading indicator that combines the power of momentum analysis through the MACD (Moving Average Convergence Divergence) with the precision of Fair Value Gap (FVG) detection to generate high-probability buy and sell signals. This indicator enhances traditional MACD signals by validating momentum shifts with market inefficiencies, offering traders a more refined entry strategy. Key Features: MACD with Histogram Display
Clearly visualizes the MAC

複数のEAを戦略ごとにグループ化し、チャート上に集計結果を表示できる高機能インジケーターです。 グループ化しなくてもご利用いただけます。 指定した集計期間内の成績を、自動で合算・視覚化。 マジックナンバーごとの除外設定や、複数マジックナンバーのグループ集計に対応しています。 さらに、EA名に含まれる文字列をキーにして部分一致の成績をグループ化でき、戦略単位でのパフォーマンス把握や比較が可能です。 設定で表示を、EA名順、マジックナンバー順、最初の取引が古い順、最後の取引が古い順、取引数順、勝率順、損益順、PF順で並べ替え出来ます。 表示がチャートに収まらない時、スクロール出来るように>>最大表示行数より多い場合有効 上,下,PgUP,PgDn,Home,Endキーでスクロールされる。マウスホイールは非対応。

candlestick pattern , MT4 pattern detector , forex signals , trend reversal , candle scanner , pattern recognition , MetaTrader 4 , forex indicator - QuantumPro Pattern Detector / Advanced Candle Pattern Recognition System for Smart Traders QuantumPro Pattern Detector is a powerful and lightweight indicator designed to recognize the most important candlestick patterns used by professional traders for technical analysis. Whether you're a beginner or an advanced trader, this tool helps you m

Arsi Scalper Pro – Smart Entry/Exit Signal System Arsi Scalper Pro is a powerful, non-repainting signal indicator built for precision scalping and intraday trading. Designed with statistical logic and volatility filtering, it helps traders enter and exit with clarity and speed. It works across multiple timeframes and pairs, especially effective on M1 to M30 charts. Key Features Buy ( ^ ) and Sell ( v ) text signals directly on chart Advanced logic with ATR and dynamic smoothing Timef

Robinhood Gold EA – Smart Auto Trading Expert (MT4) Version: 1.00
Platform: MetaTrader 4
Recommended Timeframes: M15 & H1
Main Pair: XAUUSD (Gold), also works with GBPUSD, EURUSD, GBPJPY What is Robinhood Gold EA? Robinhood Gold EA is a fully automated trading system designed to enter trades only at the most confirmed breakout moments. It combines trend structure logic with RSI confirmation and executes trades based on visual arrow signals provided by the Robinhood Arrow Indicator , which

QuantumEdge Trader v1.0
AI-Powered Precision Signals for Serious Traders
QuantumEdge Trader is a smart and reliable indicator that delivers accurate BUY and SELL signals using advanced market analysis and trend detection. Designed for M1 to M60 timeframes, it's ideal for scalping and intraday strategies.
---
Key Features:
No Repaint – Signals never change after appearing
Smart trend filters to reduce noise
Adjustable sensitivity and alerts
Perfect for XAUUSD, EURUSD, and m
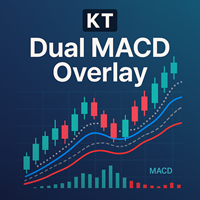
KT Dual MACD Overlay は、現在足と上位足の 2 本の完全な MACD オシレーターを価格チャート上に重ねて表示します。高速 MACD は短期モメンタムを捉え、低速 MACD は大局的なトレンドとの整合性を保ちます。 2 本をローソク足に重ねることで、ウインドウを切り替えることなく市場モメンタムを一望できます。
買いエントリー
メイン買い: 上昇トレンド開始時に青い縦線を表示。 追撃買い: 高速 MACD がシグナルラインを上抜け、低速 MACD と上昇トレンドが一致したときに発生。 売りエントリー メイン売り: 下降トレンド開始時にオレンジの縦線を表示。 追撃売り: 高速 MACD がシグナルラインを下抜け、低速 MACD と下降トレンドが一致したときに発生。
特徴 高速+低速の 2本 MACD で構成され、単体 MACD より文脈が明確。 新トレンド開始を示す縦線をチャートに描画。 メインサインを逃しても、複数回の再エントリー機会を提供。 標準 MACD クロスと比べて精度と視認性が大幅に向上。 3 つの主要イベントでアラート送信:トレンド変化・高速 MACD

Clearly displays uptrend and downtrend lines based on SmartTrend333 logic
Shows arrow signals at key trend reversals to help you catch early entries
Works great for scalping, intraday, and swing strategies across all timeframes
Trend detection based on advanced mathematical smoothing and normalization
Helps reduce noise and filter fakeouts in sideways markets
Lightweight and optimized for fast performance with zero lag
Compatible with all MT4 brokers and instruments (forex, crypto

Core Concept: Naveen Saroha's Advanced time and price angles are drawn from significant highs or lows at specific geometric ratios that represent the relationship between price movement and time. The Main Gann Angles: Most Important: 1x1 Angle : One units of price for one unit of time 1x2 Angle : One unit of price for two units of time 1x3 Angle 1x4 Angle
1x5 Angle
1x6 Angle
1x7 Angle
1x8 Angle: (45) : Eight unit of price for one unit of time - considered the most important trend line
Co
Welcome to order block indicator – your complete solution for identifying high-probability zones using order blocks , BOS (Break of Structure) , and CHOCH (Change of Character) .
Designed for precision and speed, this tool gives you the edge in spotting potential reversal and continuation zones just like the pros.
Features : Automatic Order Block Detection: Effortlessly identifies valid bullish and bearish order blocks based on price structure and market behavior. BOS & CHOCH Detect

Last frontier. Spartan is a premium "AI powered indicator" designed to identify the direction of price movements and potential reversal and exhaustion points. This tool is particularly beneficial for individuals seeking a clearer price movement. It can function as an enhancement to existing trading systems, operate independently, or assist in scalping strategies.
Price $499 for the first 5 customers, then it will reach $1999
Suggested time frame M1
1. Open BUY trades on arrow signal. Open S

VWAP Ultimate Pro MT4 – Anchored VWAP | Session VWAP | Dynamic Bands & Smart Alerts Bring Institutional‑Grade VWAP Precision to the Classic MetaTrader 4 Platform
WHY TRADERS CHOOSE VWAP ULTIMATE PRO MT4?
VWAP (Volume‑Weighted Average Price) is the benchmark used by banks, prop desks, and hedge funds to gauge fair value. VWAP Ultimate Pro MT4 delivers that same power to retail traders, optimised for MT4’s architecture while preserving every professional feature you expect. This Indicator is cu
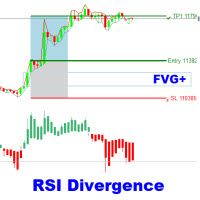
The RSI Divergence + FVG Signal indicator combines Relative Strength Index (RSI) Divergence with Fair Value Gap (FVG) detection to generate high-probability buy and sell signals based on both momentum shifts and institutional imbalance zones. Core Features: RSI Divergence Detection :
Identifies both regular and hidden bullish/bearish divergences between price and RSI. Divergences indicate potential trend reversals or continuation. FVG Zone Recognition :
Detects Fair Value Gaps (imbal

It's a very convenient and easy to use indicator, as well as powerful and accurate. It detects and visually displays the start of a new trend. It is presented in a two-color bar chart: one for the start of an uptrend and one for the start of a downtrend. The indicator only requires the number of bars to look at for its calculation. Calculation. a) The indicator compares the current candlestick close with the high or low of the previous candle group. If it's higher than the high, it indicates an

The Big Short – MetaTrader 4 向けインジケーター 本格的なトレーダーのために設計されたツール "The Big Short" は、MT4 用に開発された高度なインジケーターで、相場の反転ポイントとエントリータイミングを視覚的に分かりやすく表示します。 主な機能 すべてのシンボルに対応(FX、指数、コモディティ、仮想通貨) あらゆる時間足に対応(M1〜D1 以上) 統計情報表示:勝率、平均pips、シグナル数 視認性の高い矢印や価格帯、ターゲット表示 裁量トレードやスキャルピング、デイトレードに最適 シグナル頻度が高く、継続的なチャンスを提供 なぜ The Big Short を選ぶのか 価格反応が起こりやすいゾーンを的確に表示。シンプルな操作性ながら、構造は強力で戦略的です。 こんな方におすすめ 裁量トレーダー スキャルパーやデイトレーダー プライスアクショントレーダー 明確なテクニカルサポートを求める人 発売特別価格:177.90ドル(通常249.90ドル)

Range Filtered AlgoAlphaは、市場のボラティリティを分析することで潜在的な取引機会を特定するためのテクニカル分析ツールです。このMetaTrader向けAlgoAlphaオリジナルTradingViewインジケーターの改訂版は、複数の分析方法を組み合わせて視覚的な市場評価を提供します。 技術的特徴
価格平滑化にカルマンフィルター(Kalman Filtering)を採用
ボラティリティ測定にATRベースバンド(ATR-based Bands)を統合
トレンド分析にスーパートレンド(Supertrend)要素を組み込み
カラーろうそく足(Candles)とマーカー(Markers)で視覚的シグナルを提供
設定可能なアラート機能(Configurable Alerts)を装備 機能性
当インジケーターは市場データを処理し以下を実現:
ATR(平均真の範囲)を使用したボラティリティレンジ計算
市場ノイズ低減のためのフィルタリング技術(Filtering Techniques)適用
視覚的要素(Visual Elements)による潜在的なトレンド方向の表示 使用事例
ボ
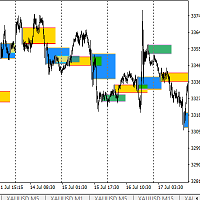
Trade are base on Breakout Session Box ( based on Time Setting ) . Can use for scalping , intraday or reversal ( based on your experience ) Can be use on M1 to M30 chart . Best use on M30 and Trade on M5 . Trade can be use buy limit/sell limit or buy stop/sell stop depend on your trading style .
Setting file are The best time setup to trade for Gold or Xauusd as per my trading style .

RSIBandsTREND is a custom trend-focused indicator that enhances the classic RSI approach by visualizing dynamic upper and lower bands based on RSI calculations.
It plots three clean bands (upper, lower, and midline) directly on the chart, helping traders identify overbought and oversold zones with precision. Features: Three-band system: upper, lower, and center RSI lines EMA-smoothed RSI band calculation Clear trend zone visualization on chart Works on all timeframes (M1 to Monthly) Fully opt

Here is a summary of the main advantages: 1. Automated Market Structure Analysis Identifies BOS and CHoCH: The indicator automatically detects and draws lines at points of Break of Structure (BOS) and Change of Character (CHoCH). These are the core components of ICT trading, helping you to easily visualize price movements and find high-probability trade entries. Adjustable Analysis Term: You can choose between three levels of structure detection (Short, Intermediate, Long) to fit your trading s

Advance Gann Grid and Percentage tool is world's first auto scale dynamic grid created by Naveen Saroha will new unknown features Key Features of Modern Dynamic Gann Grid Real-time Updates : Unlike traditional static grids, dynamic versions automatically adjust as new price data comes in Multiple Timeframe Analysis : Simultaneous calculation across different timeframes Automated Scaling : Software automatically determines optimal price-to-time ratios Interactive Elements : indicator is create 1
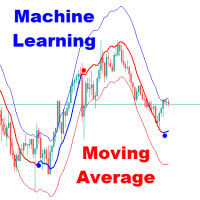
The Adaptive Gaussian Moving Average or also known as Machine Learning Moving Average (MLMA) is an advanced technical indicator that computes a dynamic moving average using a Gaussian Process Regression (GPR) model. Unlike traditional moving averages that rely on simple arithmetic or exponential smoothing, MLMA applies a data-driven, non-linear weighting function derived from the Gaussian process, allowing it to adaptively smooth the price while incorporating short-term forecasting cap
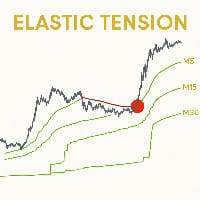
Elastic Tension MTF (M5 Only)
Индикатор многотаймфреймового натяжения цены Автор: Александр Лапин Профиль на MQL5
---
Описание
Elastic Tension MTF — это интеллектуальный авторский индикатор, основанный на концепции «упругой силы» в движении цены. Он анализирует рыночные данные с нескольких таймфреймов и визуализирует потенциальные уровни натяжения цены, отображая их на графике M5.
Индикатор моделирует поведение цены как движение под действием силы упругости, рассчитываемой по
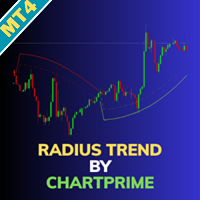
Radius Trend by ChartPrime MT5 で取引戦略を強化しましょう。この先進的なツールは, 価格アクションとボラティリティに基づいてトレンドバンドを動的に調整し, トレンド方向, 強度, 潜在的な反転についてのリアルタイムインサイトを提供します. ChartPrimeによって開発されたこのインジケーターは, 静的なトレンドラインとは異なり, グラフをレーダーのようにスキャンするユニークな半径ベースの方法を使用し, 市場条件に適応します. MQL5で革新的なアプローチにより人気があり, マルチタイムフレームサポートとExpert Advisor統合で好評を博し, ボラティリティの高い環境でトレンドの流動的なビューを提供します. Radius Trend はボラティリティに拡張/収縮する外部と内部バンドでトレンドを視覚化し, 正確な配置のために平滑化計算を使用します. メイントレンドラインはステップベースの半径を通じて角度をシフトし, 上昇トレンド (chartreuse) または下降トレンド (赤) を強調し, 点線の内部バンドは反転や継続を検知するのに役立ちます.

High Gravity Reversal signals made by Naveen Saroha a completely new concept using physics universal law of speed and Gravity. Made a simple signals using complex mathematics to match trading concepts. High accurate sell signals and buy potential of reversal of market one of unique invented by core universal laws. We are working on gravity signals since 2019 consistently...high probability reversals with minimal stop losses. 100% Non repainted no legging tools for mt4/mt5 also can use in binary

Gann time and price reversal signals are sophisticated trading concepts developed by Naveen Saroha using W.D. Gann concepts that focus on predicting market turning points through the confluence of time cycles and price movements. Here are the key elements: Time-Price Balance : Gann famously stated, "When time is up, the market will reverse regardless of the price. This emphasizes that time cycles often take precedence over price levels in determining market reversals. Key Reversal Signals Price
MetaTraderプラットフォームのためのアプリのストアであるMetaTraderアプリストアで自動売買ロボットを購入する方法をご覧ください。
MQL5.community支払いシステムでは、PayPalや銀行カードおよび人気の支払いシステムを通してトランザクションをすることができます。ご満足いただけるように購入前に自動売買ロボットをテストすることを強くお勧めします。
取引の機会を逃しています。
- 無料取引アプリ
- 8千を超えるシグナルをコピー
- 金融ニュースで金融マーケットを探索
新規登録
ログイン