MetaTrader 4용 유료 기술 지표 - 118
Overview The MACD Divergence Indicator is a powerful tool designed to detect potential trend reversals by analyzing divergences between price action and the MACD (Moving Average Convergence Divergence) indicator. It automatically identifies and highlights bullish and bearish divergence signals directly on the chart, making it easier for traders to spot high-probability trading opportunities. Key Features Customizable Settings: Includes adjustable parameters to suit various trading styles and tim

How the Indicator Works MultiMarket Direction is a powerful and versatile indicator for the MetaTrader platform, designed to help traders visualize market trends and identify potential entry points. By combining time-tested technical analysis tools such as Exponential Moving Averages (EMAs) and high/low levels, this indicator provides a clear and comprehensive view of market dynamics. The indicator displays the following on the chart: EMA 21, EMA 81, and EMA 200 : Three moving averages with cust
Dear traders,
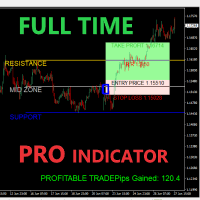
Welcome to the Full Time Pro Indicator – a professional-grade trading assistant built to help you make informed decisions through a visually intelligent and highly interactive chart interface. Whether you're a beginner or an advanced trader, this guide will walk you through every feature of the indicator so you can maximize your charting experience with precision and ease.
️ Recommended Timeframe Best used on the 1-Hour (H1) timeframe
While the indicator works on all timefra
I'm not here to sell you dreams or promise you'll quit your job next month. This indicator identifies three proprietary patterns that 99% of traders have never seen before. Why? Because I discovered them myself and spent countless hours refining the detection algorithm to only show you the absolute best setups. I've included 11 real chart screenshots across different assets. Go ahead—try to spot these patterns yourself. If you can identify them without the indicator, then congratulations. You ha
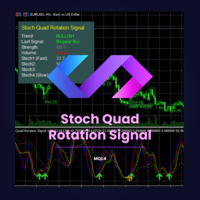
Stoch Quad Rotation Signal (MQL4)은 MetaTrader 4용 고급 기술적 지표로, 여러 스토캐스틱 오실레이터와 강력한 추세 필터, 볼륨 필터, 패턴 필터를 통합하고 신호 점수 시스템 및 다중 시간대 분석을 제공합니다. 높은 확률의 거래 기회를 명확하고 정확하게 식별하기 위해 설계되었습니다.
주요 특징:
사양 스토캐스틱 분석: 4가지 다른 스토캐스틱 오실레이터 설정(개인화 가능한 K, D 및 스무딩 기간 포함)을 동시에 사용하여 과매수/과매도 조건에 대한 세부적이고 다중 감도의 관점을 제공합니다. 이는 시장의 다양한 "속도"에서 움직임을 포착할 수 있게 합니다. 스마트 추세 필터: 빠른, 중간, 느린 지수 이동 평균선(EMA)을 기반으로 하는 견고한 시스템을 포함합니다. 주요 추세에 반하는 신호를 필터링하거나 EMA 경사를 확인하고 가격이 중요한 EMA와의 위치를 검증할 수 있습니다. 다양한 거래 신호: 다양한 유형의 신호를 생성합니다: 일반 신호: 주
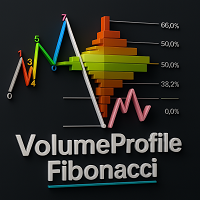
Description: Elevate your chart analysis with this advanced indicator that seamlessly integrates Zigzag structures, Fibonacci retracements, and Volume Profile insights. Designed for traders who seek clarity and precision, this tool visually identifies high-probability price patterns and market turning points.
Whether you're tracking CHOCH shifts, pinpointing POIs, or analyzing TRIPLE tops and FLAG formations, this indicator offers the depth and flexibility to adapt to any trading strategy.
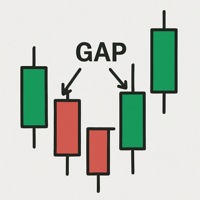
A gap is a space on the chart between two consecutive candlesticks where no trading occurred between the close of one candle and the open of the next. In the Forex market, gaps mainly appear at the weekly open, reflecting events or expectations from the weekend. Technically, a gap may indicate an imbalance between supply and demand. Strategies use gaps as signals of possible trend continuation or reversal, offering opportunities for technical analysis based on liquidity and momentum.
SNR INTRADAY is a non-repainting support and resistance indicator built for intraday trading. It automatically projects horizontal levels based on the average daily percentage movement, calculated from over 20 years of historical daily candle data . The indicator is designed to help you identify high-probability entry zones , target areas , and risk levels that are likely to be reached within the same trading day .
If your broker uses symbols with suffixes (e.g., “XAUUSD.m”, “EURUSD.pro”), the
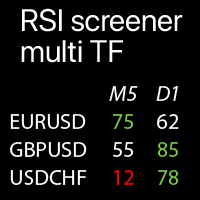
선택한 심볼의 다중 시간대 RSI 값: 현재 시장 추세 비교 이 지표 는 선택한 모든 시간대와 심볼의 RSI 값을 단일 테이블에 표시하여 현재 시장 가격 추세를 빠르게 분석할 수 있도록 합니다.
나의 다기능 유틸리티 : 66+ 기능 | 문의하기 질문이 있으시면 | MT5 버전 각 심볼 은 사용자 정의 가능합니다: 제거 / 교체. 최대 40개의 심볼을 추가할 수 있습니다. 패널은 차트의 어느 곳으로든 이동할 수 있습니다 (드래그하여 이동).
입력 설정 에서 다음을 구성할 수 있습니다: RSI 지표 설정: 기간 및 적용 가격 . 각 시간대 를 활성화 / 비활성화할 수 있습니다 . 강조 옵션: 활성화된 경우 - 극단적인 수준이 사용자 정의 색상으로 강조 표시됩니다. 극단 수준 설정: 예를 들어 입력이 25인 경우: 25 이하의 값은 낮음으로 간주되며, RSI 75+는 높음으로 간주됩니다. 알림 : 극단 수준에 대해 활성화할 수 있습니다: 높은 RSI / 낮은 R
Multi-Timeframe Order Block Indicator for MT4 This indicator automatically detects and draws bullish and bearish order blocks from up to three different timeframes on your chart. Each OB is clearly labeled with its timeframe, direction (Bullish/Bearish), and an arrow for easy identification.
You can set a separate color for bullish and bearish blocks for every timeframe, choose how many recent OBs to show, and customize all settings easily from the inputs. Supports any timeframe (M1, M5, M15, et

스트라이크 브레이크아웃 – 범위 기반 브레이크아웃 레벨
Strike Breakout 지표는 매일 차트에서 사용자 정의 가능한 일중 범위를 그려서 트레이더가 주요 돌파 구역과 잠재적인 가격 변동을 정확하게 파악하는 데 도움이 됩니다.
사용자 정의 시간 범위 사용자는 일일 범위에 대한 정확한 시작 및 종료 시간을 설정할 수 있으므로 다양한 전략과 거래 세션(예: 일일 오픈 범위, 런던 오픈, 뉴욕 오픈, 아시아 세션 등)에 대한 완전한 유연성이 제공됩니다.
범위 배수에 따른 브레이크아웃 레벨 이 지표는 기본 범위 외에도 사용자가 정의한 범위 배수(예: 0.0x, 1.0x, 2.0x)를 기반으로 추가 레벨을 표시합니다. 이러한 레벨은 돌파 목표, 지지/저항 영역, 또는 매매 진입/청산 신호 역할을 할 수 있습니다.
완벽하게 사용자 정의 가능한 비주얼 범위 상자와 브레이크아웃 레벨의 모든 색상은 자유롭게 사용자 지정할 수 있습니다. 차트 테마나 거래 선호도에 맞춰 모양을 조정할

ตัวบ่งชี้ Sniper Zones Pro - คำอธิบายการใช้งาน ตัว บ่งชี้ Sniper Zones Pro ออกแบบมาเพื่อช่วยให้ผู้ซื้อขายระบุ "โซน" ราคาที่สำคัญและจุดเข้า/ออกที่แม่นยำสำหรับการซื้อขายได้อย่างรวดเร็ว โดยมุ่งหวังที่จะเพิ่มผลกำไรสูงสุดหรือจำกัดความเสี่ยง ตัวบ่งชี้ทำงานโดยคำนวณและแสดงระดับราคาตามค่าเฉลี่ยเคลื่อนที่ถ่วงน้ำหนักเชิงเส้น (LWMA) และให้คำแนะนำในการทำกำไร (TP) และหยุดการขาดทุน (SL) แบบไดนามิก ส่วนประกอบและหลักการทำงาน: การคำนวณระดับราคา: เส้นหลัก (L2 - จุดเข้า): เส้นสีแดงนี้แสดง ค่าเฉลี่ยเคลื่อนที่ถ่วงน้
Zone + Trend Reversal System
There are many many situations you may want to use this indicator and you may not want to. Please refer the doc attached in the comment section for complete guidance. Check comments for manual. Keep in mind, Once you make the purchase please reach out to me when you are in the testing phase so i could answer your queries when you are stuck and confused because most of the time we fail because we keep going in a wrong direction without asking for the help. Read the m
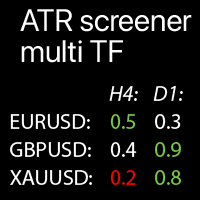
선택한 심볼의 멀티 타임프레임 ATR 값: 현재 시장 추세 비교 이 지표는 선택한 모든 타임프레임과 심볼의 ATR 값을 단일 테이블에 표시하여 현재 시장 가격 추세를 빠르게 분석할 수 있습니다 .
나의 다기능 유틸리티 : 66+ 기능 | 문의사항 연락 | MT5 버전 각 심볼 은 사용자 정의 가능합니다: 제거 / 교체. 최대 40개의 심볼을 추가할 수 있습니다. 현재 ATR의 편차 백분율 (평균값과 비교): 마우스 호버 시 확인 가능 . 패널은 차트의 아무 곳으로나 이동할 수 있습니다(드래그 가능).
설정 에서 다음을 구성할 수 있습니다: ATR 지표 설정: 기간 . 각 타임프레임 을 활성화/비활성화할 수 있습니다 . 강조 옵션: 활성화하면 극한 수준이 사용자 정의 색상으로 강조 표시됩니다. 극한 % 값 : 예를 들어 25% 입력 시: 평균 ATR의 125%+ 값은 높음으로 간주됩니다; 평균 ATR의 75%- 값은 낮음으로 간주됩니다;
평균 ATR 값을 계산하

GANN Forecaster – Precision Tool for Forex Traders (MT4) Elevate your trading with the Gann Forecaster Scanner for MetaTrader 4. This powerful, interactive tool provides precise price and time projections, giving you a professional edge across Forex, Gold, Indices, and Crypto markets. Building on the robust functionality of the Gann Forecaster indicator, this advanced scanner offers multi-pair analysis, continuously calculating Gann levels and alerting you to optimal trade entry points. A clea
A binary options styled indicator to trade fair value gaps and line breaks. Its robust nature makes it standout from other binary options indicators. With the right setup strategy, which I will provide after purchase, you will enjoy smooth operations of the indicator. BinaryBlockBreaker is coded with third-party applications such as http://www.mt2trading.com/?ref=1341 Please signup and download the needed software to provide smooth user experience.
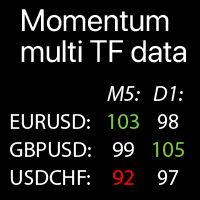
선택한 심볼에 대한 다중 시간대 모멘텀 값: 현재 시장 추세 비교 이 지표는 선택한 모든 시간대 및 심볼의 모멘텀 지표 값을 하나의 표에 표시하여 현재 시장 가격 추세를 빠르게 분석할 수 있습니다.
나의 다기능 도구 : 66+ 기능 | 문의 사항 연락 | MT5 버전 각 심볼 은 사용자 정의 가능합니다: 제거 / 교체. 최대 40개 심볼 추가 가능. 패널은 차트의 어느 곳으로나 이동 가능합니다 (드래그).
설정 에서 다음을 구성할 수 있습니다: 모멘텀 지표 설정: 기간, 적용 가격 유형 . 각 시간대 활성화 / 비활성화 가능 . 강조 옵션: 활성화 시 - 주요 수준이 사용자 정의 색상으로 강조 표시됩니다. 극값 (주요 수준) : 높은 값과 낮은 값; 알림 : 극값 수준에 대해 활성화 가능: 높은 모멘텀 / 낮은 모멘텀 / 둘 다. 시각적 스타일: 크기, 어두운 / 밝은 테마, 강조 색상. 모멘텀 지표 (Momentum) 는 특정 기간 동안 자산 가격의
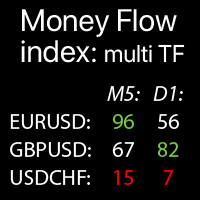
다중 시간대 머니 플로우 인덱스: 선택한 심볼의 데이터로 현재 시장 추세 비교 이 지표는 선택한 모든 시간대 및 심볼의 MTF (머니 플로우 인덱스) 데이터를 단일 테이블에 표시하여 현재 시장 가격 추세를 빠르게 분석할 수 있습니다.
나의 다기능 유틸리티 : 66+ 기능 | 문의하기 | MT5 버전 각 심볼 은 사용자 정의 가능합니다: 제거 / 교체. 최대 40개의 심볼을 추가할 수 있습니다. 패널은 차트의 어느 곳으로든 이동할 수 있습니다 (드래그 가능).
설정 에서 다음을 구성할 수 있습니다: MFI 지표 설정: 기간 . 각 시간대 를 활성화 / 비활성화할 수 있습니다 . 강조 옵션: 활성화하면 키 레벨이 사용자 정의 색상으로 강조 표시됩니다. 극값 (키 레벨) : 높은 값과 낮은 값; 알림 : 극값 레벨에 대해 활성화할 수 있습니다: 높은 MFI / 낮은 MFI / 둘 다. 시각적 스타일: 크기, 어두운 / 밝은 테마, 강조 색상.
MFI 작동

The Dragon's Pulse Oracle - A Mystical Market Divination Tool In the ancient halls of trading lore, where fortunes rise and fall like the breath of dragons, the Dragon's Pulse Oracle emerges—a powerful indicator forged from the wisdom of seers and the primal energy of the markets. This mystical tool reveals the hidden currents of price action, transforming raw data into prophetic visions of bullish fire and bearish shadow. The Oracle's Wisdom The Dragon's Pulse Oracle interprets the market's
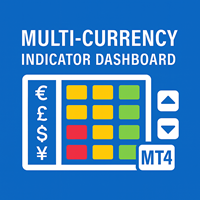
The Multi-Currency Indicator Dashboard for MT4 is an assisting tool designed to monitor up to 10 currency pairs across 6 essential indicators in one compact, color-coded dashboard. Ideal for traders who value efficiency, this tool eliminates the need to switch between charts or timeframes. Whether you're a scalper, swing trader, or trend follower, this dashboard gives you an instant visual overview of market conditions across your preferred symbols and indicators. Note : This indicat
Average Sentiment Indicator for MT4 is a composite oscillator that combines the insights of five conventional technical indicators — Relative Strength Index ( RSI ), Stochastic ( STO ), Money Flow Index ( MFI ), DeMarker ( DeM ), and William's %R ( WPR ) — into a single line ranging from 0 to 100. It is the arithmetic average of the five indicators after normalization. This tool is ideal for traders who want a noise-reduced perspective of overbought and oversold zones, potential

Auto Price Squeeze Levels The Auto Price Squeeze Levels indicator is designed to help traders easily and automatically identify and track "Price Compression" (or Price Squeeze) conditions on their charts. Price compression refers to periods where market volatility decreases, and price movements become increasingly confined within a narrow range. This often serves as a significant signal indicating the accumulation of energy before a major price movement (Breakout) is likely to occur in the near
RSI Momentum Shift Detector is designed to detect significant changes in price momentum using the Relative Strength Index (RSI) and divergence patterns, with the goal of providing visual signals and useful alerts for trading in financial markets. Main Features RSI Divergence Detection: Identifies four types of divergence: Regular Bullish Divergence: when price makes a lower low, but RSI makes a higher low. Regular Bearish Divergence: when price makes a higher high, but RSI makes a lower high.

Auto Buy/Sell with MA Cross for MT4 – Your Smart Trade Assistant! Take the guesswork out of trading with this powerful Moving Average crossover indicator for MetaTrader 4 .
It automatically identifies Buy and Sell opportunities using fast and slow MA crossovers – and shows clear visual signals on your chart. Whether you're a beginner or pro, this tool brings precision, clarity, and confidence to your trading strategy. Key Features: Auto Buy/Sell Signals based on MA crossover Up & Down

Double Fractal Entry generates precise entry signals based on smart fractal breakouts or rebounds. It visualizes market structure with dynamic channels and plots clear SL/TP levels. A powerful tool for trend and reversal traders. This product is also available for MetaTrader 5 => https://www.mql5.com/en/market/product/143601 The indicator generates entry points based on two configurable strategies: Fractal Breakout – when price breaks the last key fractal; Fractal Rebound – when price bounces

Professional Cumulative Delta & Volume Median Indicator Track real buying/selling pressure with this powerful volume analysis tool. The Volume Compare Indicator combines Cumulative Delta and Volume Medians to help you identify institutional activity, imbalances, and potential reversals. Key Features: Cumulative Delta Histogram – Visualizes net buying vs. selling volume in real-time.
Buy/Sell Volume Medians – Horizontal lines showing average buy & sell volume lev

Dynamic CMF Calculation: Customize the period for the Chaikin Money Flow (CMF) to fine-tune your analysis and maximize signal precision. Intuitive Color-Coded Alerts: Instantly interpret market conditions with clear visual cues: Green Alert: Indicates the Overbought zone – signaling a potential selling opportunity. Red Alert: Indicates the Oversold zone – suggesting a potential buying opportunity. Gray Alert: Represents the Neutral zone – a signal to wait for a confirmed trend or re

Presentation of the Indicator: Volume Divergence Pro Discover hidden market opportunities at a glance. Volume Divergence Pro is an advanced technical analysis tool specifically designed for the MetaTrader 4 platform. This powerful indicator combines three of the most widely used volume indicators — OBV , ADL , and VPT — along with automatic divergence detection, visual lines, entry signals, and a complete alert system, all in one intuitive interface. Perfect for both beginner and professional
The Color Change MA is a versatile custom indicator designed for MetaTrader 4, providing clear visual signals on trend direction and momentum. It features a Moving Average (MA) line that intelligently changes color based on the MA's position relative to the current candle's open and close prices, with an optional but powerful RSI (Relative Strength Index) filter for enhanced confirmation. Key Features: Dynamic Color-Changing MA: Green: Indicates a bullish bias. By default, this occurs when the M

https://youtu.be/DhM7se_ePw8
ACE 4X FIBONACCI - Professional Trading Intelligence The Ultimate Fibonacci Retracement System Transform your trading with ACE 4X FIBONACCI - a meticulously engineered indicator that brings institutional-grade Fibonacci analysis directly to your MT4 platform. Built for serious traders who demand precision, speed, and style. PROFESSIONAL TRADING REDEFINED Experience the power of advanced Fibonacci retracement analysis through our revolutionary Luxury Theme interfac
Oscillator Alerts MultiPanel All oscillator signals — in a single panel!
A professional multi-panel tool for market control, based on major oscillators with a flexible alert system and unique interactive management features. Description Oscillator Alerts MultiPanel is an innovative tool for traders that brings together multi-symbol and multi-timeframe analysis, flexible notifications, and the most convenient interactive control — all right on your chart. Key Advantages Interactive Oscillator Se
# Apex Arrows – Professional Trading Signals Indicator
## General Description
**Apex Arrows** is a powerful technical indicator specifically designed for advanced traders seeking accurate and automated real-time signals. This indicator combines multiple technical strategies into a single visually intuitive tool, ideal for trading markets such as forex, indices, and commodities on the **MetaTrader 4/5** platform.
Based on Exponential Moving Averages (EMA), RSI, Stochastic, ADX, and auto
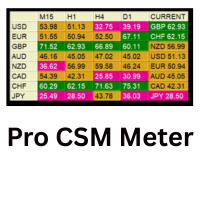
Pro CSM Meter – Professional Currency Meter Pro CSM Meter is a powerful tool for analyzing the strength and weakness of currencies in real time. It helps traders identify the strongest and weakest currencies at any given moment and understand the current trend direction more clearly. This can be used to filter currency pairs and improve decision-making in manual trading strategies. https://youtu.be/YUA-yD_khLM
The price will increase by $50 with every 5 purchases. Final price $300 Key Features

PLEASE REVIEW THE ATTACHED IMAGE CAREFULLY BEFORE READING FURTHER This indicator is designed for MetaTrader 4 (MT4) and focuses on a dual-band envelope system to help traders identify liquidity zones and extreme price levels with clarity and precision. If you purchase this indicator, please contact me via email with your payment receipt attached. I will provide you with a detailed user guide and trading strategy for effective application. I. DUAL ENVELOPE INDICATOR FOR MT4 A simplified yet power
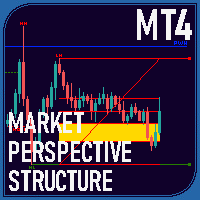
Overview The Market Perspective Structure Indicator is a comprehensive MetaTrader indicator designed to provide traders with a detailed analysis of market structure across multiple timeframes. It identifies and visualizes key price action elements, including swing highs and lows, Break of Structure (BOS), Change of Character (CHOCH), internal structures, equal highs/lows, premium/discount levels, previous levels from higher timeframes, and trading session zones. With extensive customization opt
One Shot One Kill — Trend-Based Entries Precision entries. No clutter. No tweaking. Just add to chart and trade. About the Indicator One Shot One Kill is a clean, plug-and-play signal algorithm designed to deliver high-probability trade entries using a proprietary algorithm. Whether it’s a trend reversal or a trend continuation , this tool identifies precise entry points — with no inputs, no recalibration, and no second-guessing. Key Features: Simple & Automatic : Add to chart, and you're ready

MurreyGannQuantum - Professional Trading Indicator Advanced Murrey Math & Gann Angle Technical Analysis with Complete EA Integration Professional technical indicator combining Murrey Math level analysis with Gann angle calculations. Features comprehensive visual analysis, multi-timeframe adaptation, and complete EA integration capabilities for automated trading systems. The blog: https://www.mql5.com/en/blogs/post/763757
CORE FEATURES Technical Implementation: Murrey Math Levels: 9 dynamic su

The Volli v9 indicator is based on the analysis of zones built on volumes. That is, it is based on the analysis of how the price behaves near/in these zones, whether it rebounds, moves further, or does not react. The indicator also displays the aggregate strength of currencies, recommended stops, trend direction, volume trend and their changes.
Also there is EA. https://www.mql5.com/en/market/product/145026?source=Site +Profile
Description 1) The arrows. Drawn on the current candle. On the

지표는 추세의 방향, 진입 신호용 화살표, 거래에 가장 적합한 청산 시점을 표시합니다. 모든 신호의 통계도 표시되어 거래 분석에 도움을 줍니다.
MT5용 인디케이터 버전
기능 이 지표는 재그리지 않습니다. 모든 자산에 적용 가능합니다: 암호화폐, 주식, 금속, 지수, 원자재, 통화. 모든 시간대에 적용 가능합니다. 진입 신호는 새로운 캔들이 열릴 때 표시됩니다. 거래 종료 신호는 근사치이며, 종종 더 높은 이익으로 거래를 종료할 수 있습니다. 상단 좌측에 상세한 거래 통계 패널이 있으며, 접을 수 있습니다. M1부터 W1까지의 시간대에서 추세 방향을 즉시 표시합니다. 경량 코드를 사용하므로 터미널을 과부하시키거나 느리게 하지 않습니다. 거래 진입 신호를 놓치지 않기 위해 알림 창과 푸시 알림을 통해 알림을 받을 수 있습니다. 초보자부터 전문가까지 모든 수준의 사용자에게 적합합니다. 통계 패널 신호 이력에서 데이터를 추출한 날짜 수. 통계가 제공되는 신호의 총 수. 수익성

Purpose : The AllAverages indicator plots a moving average line on the chart, with options to select from a wide range of MA types and price applications. It also displays buy and sell signals as arrows when the trend changes, and supports alerts (sound, email, push notifications) for these signals. Key Features : Supports multiple moving average types (e.g., SMA, EMA, HMA, TEMA, etc.). Allows customization of the price type (e.g., Close, Open, High, Low, Heiken Ashi variants). Displays a colore

Momentum Hunter – 고급 무재도 모멘텀 지표 Momentum Hunter 는 새로운 모멘텀을 감지하고 트레이더가 시장 움직임을 정확하게 포착하도록 돕기 위해 설계된 강력하고 신뢰할 수 있는 지표입니다. M1 타임프레임 에 최적화되어 있지만, 더 높은 타임프레임에서도 원활하게 작동하여 스캘퍼와 스윙 트레이더 모두에게 적합합니다. 주요 기능: 무재도 및 지연 없음 : 신호는 안정적이며 화살표는 캔들이 마감된 후에만 나타납니다. 심플한 인터페이스 : 복잡한 버튼 없이 깔끔한 차트에 화살표, 스톱로스 라벨 및 트레일링 스톱 라벨만 표시됩니다. 즉시 알림 : 신호가 나타나면 MetaTrader와 모바일 기기로 즉시 알림이 전송됩니다. 모든 트레이더에게 적합 : M1에서 스캘핑하거나 고타임프레임에서 거래하더라도 Momentum Hunter는 스타일에 맞게 작동합니다. 이 고급 도구는 여러 검증된 전략을 결합합니다:
이동평균선 으로 트렌드 방향 탐지
볼린저 밴드 로 변동성 분석
RS

이 인디케이터는 트렌드 방향, 진입 지점, 그리고 거래에서 가장 적합한 청산 지점을 보여줍니다. 또한 거래 분석을 개선하기 위해 모든 신호에 대한 통계를 표시합니다. MT5용 인디케이터 버전
특징 이 인디케이터는 다시 그리지 않습니다. 암호화폐, 주식, 금속, 지수, 원자재, 통화 등 모든 자산 거래에 사용할 수 있습니다. 모든 시간대에서 작동합니다. 진입 신호는 새 캔들 오픈 시 나타납니다. 청산 신호는 대략적인 것으로, 종종 더 큰 수익으로 거래를 마감할 수 있습니다. 좌측 상단에 자세한 거래 통계 패널이 표시되며, 접을 수 있습니다. M1부터 W1까지 시간대에서 트렌드 방향을 표시합니다. 가벼운 코드로 터미널에 부담을 주거나 느리게 만들지 않습니다. 진입 신호를 놓치지 않기 위해 Alert 창과 푸시 알림을 통해 알림을 받을 수 있습니다. 초보자부터 전문가까지 모든 레벨의 사용자에게 적합합니다. 통계 패널 신호 이력이 수집된 날짜 수. 통계가 제공되는 신호의 총 개수. 수익
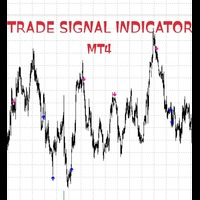
ULTIMATE BUY & SELL ARROW INDICATOR MT4 - Professional Trading Signals! CRYSTAL CLEAR TRADING SIGNALS WITH PRECISION ACCURACY. WORKS ON ALL TIME FRAME, BEST ON 1HR TIME FRAME WHAT MAKES THIS INDICATOR REVOLUTIONARY? NO REPAINTING - NO GUESSWORK - NO REGRETS! 100% ACCURATE SIGNALS that never change or disappear ZERO OFFSET - Signals appear exactly when they should PERFECT PRECISION - Best O INSTANT VISUAL CLARITY CRYSTAL CLEAR BLUE ARROWS for BUY signals STRIKING PINK ARROWS for SELL s
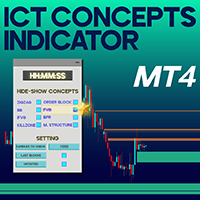
ICT Concepts Indicator for MetaTrader 4 The ICT Concepts Indicator for MetaTrader 4 is a specialized tool crafted for advanced traders. It delivers a comprehensive suite of Smart Money and ICT methodology elements via an intuitive control panel. This indicator enables traders using ICT principles to effortlessly incorporate elements like Order Blocks, Fair Value Gaps (FVG), Breaker Blocks, Market Structure insights, and Kill Zones into their market analysis workflow. «Indicator Installation & Us
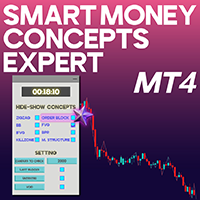
Smart Money Concepts Expert MT4 The Smart Money Concepts Expert MT4 is developed to automatically showcase Smart Money-related elements directly on the chart. This expert tool adds a floating control panel, letting traders manage visibility for different analysis components. Each part of the panel reflects a vital market structure element, allowing users to toggle automatic drawing on or off as needed. «Indicator Installation & User Guide» MT4 Indicator Installation | Smart Mony Concepts SMC I
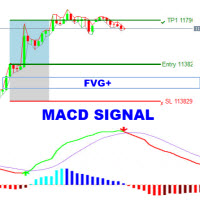
The MACD-FVG Signal System is a hybrid trading indicator that combines the power of momentum analysis through the MACD (Moving Average Convergence Divergence) with the precision of Fair Value Gap (FVG) detection to generate high-probability buy and sell signals. This indicator enhances traditional MACD signals by validating momentum shifts with market inefficiencies, offering traders a more refined entry strategy. Key Features: MACD with Histogram Display
Clearly visualizes the MAC

This is a powerful indicator that groups multiple Expert Advisors (EAs) by strategy and displays aggregated performance results directly on the chart. Grouping is optional — you can use it even without organizing EAs into groups. It automatically calculates and visualizes performance within a specified aggregation period. You can exclude specific magic numbers or aggregate results across multiple magic numbers as a group. Additionally, by using partial string matching based on EA names, you can

candlestick pattern , MT4 pattern detector , forex signals , trend reversal , candle scanner , pattern recognition , MetaTrader 4 , forex indicator - QuantumPro Pattern Detector / Advanced Candle Pattern Recognition System for Smart Traders QuantumPro Pattern Detector is a powerful and lightweight indicator designed to recognize the most important candlestick patterns used by professional traders for technical analysis. Whether you're a beginner or an advanced trader, this tool helps you m

Arsi Scalper Pro – Smart Entry/Exit Signal System Arsi Scalper Pro is a powerful, non-repainting signal indicator built for precision scalping and intraday trading. Designed with statistical logic and volatility filtering, it helps traders enter and exit with clarity and speed. It works across multiple timeframes and pairs, especially effective on M1 to M30 charts. Key Features Buy ( ^ ) and Sell ( v ) text signals directly on chart Advanced logic with ATR and dynamic smoothing Timef

Robinhood Gold EA – Smart Auto Trading Expert (MT4) Version: 1.00
Platform: MetaTrader 4
Recommended Timeframes: M15 & H1
Main Pair: XAUUSD (Gold), also works with GBPUSD, EURUSD, GBPJPY What is Robinhood Gold EA? Robinhood Gold EA is a fully automated trading system designed to enter trades only at the most confirmed breakout moments. It combines trend structure logic with RSI confirmation and executes trades based on visual arrow signals provided by the Robinhood Arrow Indicator , which
QuantumEdge Trader v1.0
AI-Powered Precision Signals for Serious Traders
QuantumEdge Trader is a smart and reliable indicator that delivers accurate BUY and SELL signals using advanced market analysis and trend detection. Designed for M1 to M60 timeframes, it's ideal for scalping and intraday strategies.
---
Key Features:
No Repaint – Signals never change after appearing
Smart trend filters to reduce noise
Adjustable sensitivity and alerts
Perfect for XAUUSD, EURUSD, and m
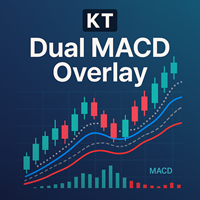
KT Dual MACD Overlay는 현재 시간대와 상위 시간대의 두 MACD 오실레이터를 가격 차트에 직접 겹쳐 표시합니다. 빠른 MACD는 단기 모멘텀을 포착하고, 느린 MACD는 더 큰 추세와의 일관성을 유지합니다. 두 MACD가 캔들 위에 겹쳐 표시되므로 창을 전환하지 않고도 시장 모멘텀을 완벽히 파악할 수 있습니다.
매수 진입
주 매수 진입: 상승 추세가 시작될 때 파란색 세로선이 나타납니다. 추가 매수: 빠른 MACD가 시그널선을 상향 돌파하고, 느린 MACD와 주요 상승 추세가 이를 확인할 때 발생합니다. 매도 진입 주 매도 진입: 하락 추세가 시작될 때 주황색 세로선이 나타납니다. 추가 매도: 빠른 MACD가 시그널선을 하향 돌파하고, 느린 MACD와 주요 하락 추세가 이를 확인할 때 발생합니다.
특징 빠른 MACD와 느린 MACD를 동시에 활용해 단일 MACD보다 완성도 높은 시스템 제공. 추세 시작 지점을 세로선으로 명확하게 표시. 주 진입을 놓쳐도 여러 번

Clearly displays uptrend and downtrend lines based on SmartTrend333 logic
Shows arrow signals at key trend reversals to help you catch early entries
Works great for scalping, intraday, and swing strategies across all timeframes
Trend detection based on advanced mathematical smoothing and normalization
Helps reduce noise and filter fakeouts in sideways markets
Lightweight and optimized for fast performance with zero lag
Compatible with all MT4 brokers and instruments (forex, crypto

Core Concept: Naveen Saroha's Advanced time and price angles are drawn from significant highs or lows at specific geometric ratios that represent the relationship between price movement and time. The Main Gann Angles: Most Important: 1x1 Angle : One units of price for one unit of time 1x2 Angle : One unit of price for two units of time 1x3 Angle 1x4 Angle
1x5 Angle
1x6 Angle
1x7 Angle
1x8 Angle: (45) : Eight unit of price for one unit of time - considered the most important trend line
Co
Welcome to order block indicator – your complete solution for identifying high-probability zones using order blocks , BOS (Break of Structure) , and CHOCH (Change of Character) .
Designed for precision and speed, this tool gives you the edge in spotting potential reversal and continuation zones just like the pros.
Features : Automatic Order Block Detection: Effortlessly identifies valid bullish and bearish order blocks based on price structure and market behavior. BOS & CHOCH Detect

Last frontier. Spartan is a premium "AI powered indicator" designed to identify the direction of price movements and potential reversal and exhaustion points. This tool is particularly beneficial for individuals seeking a clearer price movement. It can function as an enhancement to existing trading systems, operate independently, or assist in scalping strategies.
Price $499 for the first 5 customers, then it will reach $1999
Suggested time frame M1
1. Open BUY trades on arrow signal. Open S

VWAP Ultimate Pro MT4 – Anchored VWAP | Session VWAP | Dynamic Bands & Smart Alerts Bring Institutional‑Grade VWAP Precision to the Classic MetaTrader 4 Platform
WHY TRADERS CHOOSE VWAP ULTIMATE PRO MT4?
VWAP (Volume‑Weighted Average Price) is the benchmark used by banks, prop desks, and hedge funds to gauge fair value. VWAP Ultimate Pro MT4 delivers that same power to retail traders, optimised for MT4’s architecture while preserving every professional feature you expect. This Indicator is cu
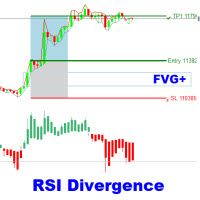
The RSI Divergence + FVG Signal indicator combines Relative Strength Index (RSI) Divergence with Fair Value Gap (FVG) detection to generate high-probability buy and sell signals based on both momentum shifts and institutional imbalance zones. Core Features: RSI Divergence Detection :
Identifies both regular and hidden bullish/bearish divergences between price and RSI. Divergences indicate potential trend reversals or continuation. FVG Zone Recognition :
Detects Fair Value Gaps (imbal

It's a very convenient and easy to use indicator, as well as powerful and accurate. It detects and visually displays the start of a new trend. It is presented in a two-color bar chart: one for the start of an uptrend and one for the start of a downtrend. The indicator only requires the number of bars to look at for its calculation. Calculation. a) The indicator compares the current candlestick close with the high or low of the previous candle group. If it's higher than the high, it indicates an


Range Filtered AlgoAlpha는 시장 변동성을 분석하여 잠재적인 거래 기회를 식별하도록 설계된 기술 분석 도구입니다. AlgoAlpha의 원래 TradingView 지표를 MetaTrader에 적용한 이 버전은 여러 분석 방법을 결합하여 시각적인 시장 평가를 제공합니다. 기술적 특징
가격 평활화를 위한 칼만 필터링(Kalman Filtering) 적용
변동성 측정을 위한 ATR 기반 밴드(ATR-based Bands) 통합
추세 분석을 위한 슈퍼트렌드(Supertrend) 요소 포함
색상 캔들(Candles) 및 마커(Markers)를 통한 시각적 신호 제공
구성 가능한 알림 옵션(Configurable Alerts) 제공 기능
이 지표는 시장 데이터를 처리하여 다음을 수행합니다:
ATR(평균 실제 범위)을 사용한 변동성 범위 계산
시장 노이즈 감소를 위한 필터링 기술(Filtering Techniques) 적용
시각적 요소(Visual Elements)를 통한 잠재적
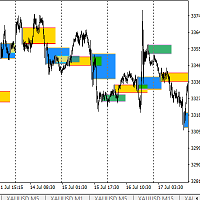
Trade are base on Breakout Session Box ( based on Time Setting ) . Can use for scalping , intraday or reversal ( based on your experience ) Can be use on M1 to M30 chart . Best use on M30 and Trade on M5 . Trade can be use buy limit/sell limit or buy stop/sell stop depend on your trading style .
Setting file are The best time setup to trade for Gold or Xauusd as per my trading style .

RSIBandsTREND is a custom trend-focused indicator that enhances the classic RSI approach by visualizing dynamic upper and lower bands based on RSI calculations.
It plots three clean bands (upper, lower, and midline) directly on the chart, helping traders identify overbought and oversold zones with precision. Features: Three-band system: upper, lower, and center RSI lines EMA-smoothed RSI band calculation Clear trend zone visualization on chart Works on all timeframes (M1 to Monthly) Fully opt
Here is a summary of the main advantages: 1. Automated Market Structure Analysis Identifies BOS and CHoCH: The indicator automatically detects and draws lines at points of Break of Structure (BOS) and Change of Character (CHoCH). These are the core components of ICT trading, helping you to easily visualize price movements and find high-probability trade entries. Adjustable Analysis Term: You can choose between three levels of structure detection (Short, Intermediate, Long) to fit your trading s

Advance Gann Grid and Percentage tool is world's first auto scale dynamic grid created by Naveen Saroha will new unknown features Key Features of Modern Dynamic Gann Grid Real-time Updates : Unlike traditional static grids, dynamic versions automatically adjust as new price data comes in Multiple Timeframe Analysis : Simultaneous calculation across different timeframes Automated Scaling : Software automatically determines optimal price-to-time ratios Interactive Elements : indicator is create 1
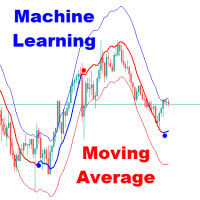
The Adaptive Gaussian Moving Average or also known as Machine Learning Moving Average (MLMA) is an advanced technical indicator that computes a dynamic moving average using a Gaussian Process Regression (GPR) model. Unlike traditional moving averages that rely on simple arithmetic or exponential smoothing, MLMA applies a data-driven, non-linear weighting function derived from the Gaussian process, allowing it to adaptively smooth the price while incorporating short-term forecasting cap
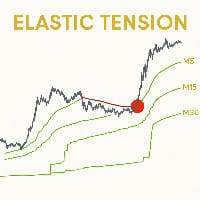
Elastic Tension MTF (M5 Only)
Индикатор многотаймфреймового натяжения цены Автор: Александр Лапин Профиль на MQL5
---
Описание
Elastic Tension MTF — это интеллектуальный авторский индикатор, основанный на концепции «упругой силы» в движении цены. Он анализирует рыночные данные с нескольких таймфреймов и визуализирует потенциальные уровни натяжения цены, отображая их на графике M5.
Индикатор моделирует поведение цены как движение под действием силы упругости, рассчитываемой по
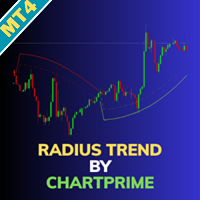
Radius Trend by ChartPrime MT5 로 거래 전략을 강화하세요, 가격 액션과 변동성에 기반한 동적 트렌드 밴드를 실시간으로 조정하여 트렌드 방향, 강도, 잠재적 반전에 대한 인사이트를 제공하는 고급 도구입니다. ChartPrime에 의해 개발된 이 인디케이터는 정적 트렌드 라인과 달리 레이더처럼 차트를 스위핑하는 독특한 반경 기반 방법으로 시장 조건에 적응합니다. MQL5에서 혁신적인 접근으로 인기 있으며, 멀티 타임프레임 지원과 Expert Advisor 통합으로 평가받아 변동성 환경에서 트렌드의 유동적인 뷰를 제공합니다. Radius Trend는 변동성과 함께 확장/수축하는 외부 및 내부 밴드로 트렌드를 시각화하며, 정확한 배치를 위한 평활화 계산을 사용합니다. 주요 트렌드 라인은 스텝 기반 반경을 통해 각도를 변경하며, 상승 트렌드 (chartreuse) 또는 하락 트렌드 (빨강)를 강조하고, 점선 내부 밴드는 반전 또는 지속을 탐지하는 데 도움이 됩니다.

High Gravity Reversal signals made by Naveen Saroha a completely new concept using physics universal law of speed and Gravity. Made a simple signals using complex mathematics to match trading concepts. High accurate sell signals and buy potential of reversal of market one of unique invented by core universal laws. We are working on gravity signals since 2019 consistently...high probability reversals with minimal stop losses. 100% Non repainted no legging tools for mt4/mt5 also can use in binary

Gann time and price reversal signals are sophisticated trading concepts developed by Naveen Saroha using W.D. Gann concepts that focus on predicting market turning points through the confluence of time cycles and price movements. Here are the key elements: Time-Price Balance : Gann famously stated, "When time is up, the market will reverse regardless of the price. This emphasizes that time cycles often take precedence over price levels in determining market reversals. Key Reversal Signals Price
MetaTrader 마켓은 거래 로봇과 기술 지표들의 독특한 스토어입니다.
MQL5.community 사용자 메모를 읽어보셔서 트레이더들에게 제공하는 고유한 서비스(거래 시그널 복사, 프리랜서가 개발한 맞춤형 애플리케이션, 결제 시스템 및 MQL5 클라우드 네트워크를 통한 자동 결제)에 대해 자세히 알아보십시오.
트레이딩 기회를 놓치고 있어요:
- 무료 트레이딩 앱
- 복사용 8,000 이상의 시그널
- 금융 시장 개척을 위한 경제 뉴스
등록
로그인
계정이 없으시면, 가입하십시오
MQL5.com 웹사이트에 로그인을 하기 위해 쿠키를 허용하십시오.
브라우저에서 필요한 설정을 활성화하시지 않으면, 로그인할 수 없습니다.