YouTubeにあるマーケットチュートリアルビデオをご覧ください
ロボットや指標を購入する
仮想ホスティングで
EAを実行
EAを実行
ロボットや指標を購入前にテストする
マーケットで収入を得る
販売のためにプロダクトをプレゼンテーションする方法
MetaTrader 4のための有料のテクニカル指標 - 117

SMCプロトレードインジケーター - 機関投資家のように取引 SMCプロトレードインジケーター - 機関投資家の取引戦略 スマートマネーの動きを可視化 機関投資家の取引に遅れを取っていませんか?このSmart Money Concepts(SMC)インジケーターは、銀行やヘッジファンドがポジションを構築している領域を正確に表示します。 期間限定オファー 初回20名様限定: 15,900円 通常価格: 40,000円(24,100円お得) 主な特徴 機関投資家の資金流動を追跡 高確率なトレードセットアップ(勝率70%以上) 明確な買い/売りゾーン表示 スキャルピングからスイングトレードまで対応 全ての時間軸で使用可能 コア機能 市場分析エンジン スウィング高値/安値検出 機関投資家のオーダーブロック表示 フェアバリューギャップ(FVG)検出 トレンド転換シグナル ビジュアルトレードツール 明確な取引ゾーン表
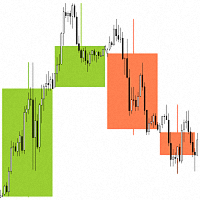
"Candlesticks MTF 4" is an information indicator that displays "Japanese Candlesticks" . The indicator analyzes and determines the opening and closing times of candles from higher time frames.
An algorithm has been developed for the "Candlesticks MTF 4" indicator that corrects the discrepancy between the opening and closing times of candles from higher time frames. For example, if the opening time of a candle on a weekly time frame is the 1st of the month, and on the smaller time frame this da
Buy 1 get 1 free
how each of these input fields is used and what happens on your chart when you adjust their values: Custom text for comment : How to use : Type any text you want into the "Value" field. Result : The text you type will appear in the top-left corner of the chart window (known as the Chart Comment). You might use this for the indicator's name, version, or your own short notes. Lookback period for regression calculation : How to use : Enter an integer (e.g., 100, 200, 300). Result

BinaryProfitFilter は取引信号の歴史的有效性を分析し、指定された収益性レベルを満たす信号のみを表示します。バイナリーオプション、外国為替、株式に適しています。 主要パラメータ パラメータ デフォルト値 説明 IndicatorName "あなたのインジケーター" 外部インジケーター名 BuyBuffer 0 買いバッファインデックス SellBuffer 1 売りバッファインデックス SignalCount 3 収益性分析の信号数 TargetProfit 60.0 目標収益率 ShowProfitability true チャートに統計を表示 EnableAlerts false ポップアップアラートを有効化 EnableSound false 音声アラートを有効化 BuyArrowCode 233 買い矢印コード () SellArrowCode 234 売り矢印コード () MA パラメータ パラメータ デフォルト値 説明 UseBuiltInMA false 内蔵MAインジケーターを使用 FastMAPeriod 5 高速MA期間 SlowMAPeri
Zone Hunter – ブレイクアウトおよび再エントリーのレンジシグナルインジケーター 最新情報を受け取るにはチャンネルに参加してください: https://www.mql5.com/en/channels/forexnewadvisor
Zone Hunter は、適応型価格レンジゾーンに基づき、ブレイクアウトシグナルと潜在的な再エントリー機会を識別するスマートなプライスアクションインジケーターです。価格が動的に計算されたサポートまたはレジスタンスレベルを超えた後に押し戻され、追加のエントリーチャンスを提供する瞬間をトレーダーに知らせます。
コアコンセプトには以下が含まれます: 直近の高値と安値を用いた動的なサポート・レジスタンスゾーンの計算 価格が勢いを伴ってゾーンの外側を突破した際の買いおよび売りのブレイクアウトシグナル トレンドが有効な間に価格がゾーン内に戻った場合の再エントリーシグナル ブレイクアウトおよび再エントリーのイベントを通知するリアルタイムのアラートと矢印表示 Zone Hunterは、モメンタムベースのエントリーや価格継続のセットアップを活用するスキャルパ

MT5 Version 概要
このインジケーターは、洗練されたトレンドフォロー型モデルに、動的な価格拒否検出、ローソク足の色分け、ATR(平均的な真の変動幅)に基づくターゲット予測を統合し、トレーダーがトレンド継続セットアップを視覚的に識別・管理できる包括的なシステムを提供します。
チャート上に直接表示され、トレンドの変化の兆候を自動的に検出し、適応型サポート/レジスタンス付近での拒否を確認し、ストップロスとテイクプロフィットの計算済みレベルを表示して、構造化されたリスクリワードの意思決定をサポートします。
従来のインジケーターがトレンド方向やエントリー信号のみに焦点を当てるのとは異なり、このツールはシグナルのフィルタリング、ボラティリティ調整型のポジショニング、段階的な利確戦略を組み合わせて、より高度なトレード判断を可能にします。
コンセプト
本インジケーターの核となるのは、ATRベースのバンドにWMAとEMAによるスムージングを施したカスタムSupertrendです。これにより、ノイズを除去しながら主要なトレンドの変化を追跡できます。
特筆すべきは拒否ロジックで、トレ

Golden Panther is a trend indicator that shows the beginning and end of a trend. The indicator is designed specifically for trading gold and silver, but also works with other financial instruments. When a trend begins, the indicator draws an arrow in the direction of the trend and colors the candles until the trend ends. The indicator does not lag or redraw. I recommend using the M30, H1 timeframe.
Signal Zero – 多次元モメンタムオシレーター 最新情報を受け取るにはチャンネルに参加してください: https://www.mql5.com/en/channels/forexnewadvisor
Signal Zero は、移動平均、シグナルライン、およびゼロラインのクロスオーバーを統合したモメンタムオシレーターで、市場のセンチメント変化を多層的に分析し、正確な取引シグナルを提供します。全ての時間足と金融商品に対応し、M1のスキャルピングからD1以上の長期トレードまで幅広く活用できます。
主な特徴: 二重移動平均エンジン: カスタマイズ可能な2本の移動平均の差から価格の加速・減速を検出。 統合シグナルライン: 平滑化されたシグナルラインによりクロスオーバーポイントを視覚的に確認可能。 スロープ検出: オシレーターの傾き変化によりモメンタム転換の兆候を早期に感知。 ゼロラインフィルタ: ゼロラインの上下で市場の強気・弱気バイアスを判断。 色分けヒストグラム: モメンタムの方向を視覚的に区別しやすく表示。
動作の仕組み Signal Zeroは以下を通じてシグナルを生成
Индикатор Стрелочник для Скальпинговой работы Философия и логика работы индикатора Этот индикатор создан для фильтрации рыночного шума и поиска мощных, подтвержденных трендовых движений. Его основная идея — входить в рынок только тогда, когда несколько независимых друг от друга математических моделей подтверждают наличие сильного тренда. Три алгоритма подтверждения: Чтобы определить направление и силу тренда, индикатор использует три совершенно разных подхода: Алгоритм 1: Моментум на основе С

Enhanced QPI Dashboard Indicator Professional Multi-Signal Trading System with Premium GUI Interface Overview The Enhanced QPI Dashboard is a sophisticated technical analysis indicator designed for MetaTrader 4 that combines multiple proven trading signals into one comprehensive system. This professional-grade indicator features a real-time dashboard interface that monitors market conditions and generates high-probability trading opportunities through advanced multi-timeframe analysis. Key

パーセント変化レベル – MetaTrader のカスタマイズ可能なパーセント変化インジケーター MetaTrader の パーセント変化レベル インジケーターは、選択したローソク足の始値から計算されたパーセント変化レベルを明確に視覚的に表示します。 このインジケーターは、チャート上で正確な参照ポイントを求めるトレーダー向けに設計されており、選択したローソク足の始値からの価格変動をパーセンテージで反映する水平レベルを動的に描画します。 このインジケーターには、始値レベル自体に加えて、 10 個の正の パーセンテージ変化レベルと 10 個の負のパーセンテージ変化レベル が含まれており、すべて始値の上下に対称的にプロットされます。 すべてのレベルは入力設定を通じて完全にカスタマイズ可能であり、ユーザーは戦略や市場の状況に合わせて正確なパーセンテージ値を定義できます。 ユーザーは、パーセンテージの変化計算の基準として、任意の時間枠から任意のローソク足を選択できます。 パーセンテージレベル自体は設定で自由に調整できます。 デフォルトでは、インジケーターは日次、週次、または月次ローソク足のオ

BBMA Oma Ally is a trading strategy that combines Bollinger Bands (BB) and Moving Average (MA) indicators developed by Oma Ally. This strategy is known for its high entry accuracy, low floating time, and the ability to make multiple entries.
Elaboration: BBMA Oma Ally: This strategy was developed by Oma Ally, a trader from Malaysia. The name "BBMA" comes from the Bollinger Bands and Moving Average indicators used.
BB and MA Indicators: Bollinger Bands are used to identify volatility and trend
概要説明
Binary Adaptive Trend Cross は、移動平均線の交差とトレンドフィルターを組み合わせた高精度なエントリーポイント判定インジケーターです。買いシグナル( 青矢印)と売りシグナル( 赤矢印)を表示し、アラート機能もサポートしています。 主な特徴
市場状況に応じた自動最適化
ダマシを減らすトレンドフィルター
柔軟なシグナル生成設定
アラート・通知機能
手動トレード・アルゴリズムトレード両対応 設定項目
基本設定 パラメータ 説明 初期値 LevelEn 第1SMMA(平滑化移動平均、終値ベース)の期間 3 TradeTer 第2SMMA(平滑化移動平均、始値ベース)の期間 3 SignalOn シグナル生成タイミング:
0 – 現在の足
1 – 次の足 0 アラート設定 パラメータ 説明 EnableAlerts アラートの有効化 EnableSound 音声通知 EnableNotifications Push通知 トレンドフィルター パラメータ 説明
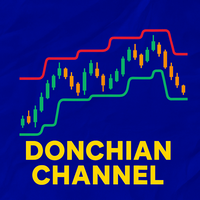
Donchian Channel – Customizable Indicator for MT4 This indicator draws the Donchian Channels cleanly and effectively, perfect for identifying breakouts, trends, and ranges.
Fully customizable – easily adjust colors, period, and line styles from the input settings.
Designed for both manual trading and as a base for automated strategies (EAs) .
Ideal for traders seeking a powerful, flexible visual tool to enhance their decision-making.

MFI Pulse Pro – マネーフローインデックス(MFI)パルスインジケーター 最新情報を受け取るにはチャンネルに参加してください: https://www.mql5.com/en/channels/forexnewadvisor
MFI Pulse Pro は、マネーフローインデックス(MFI)をベースにしたモメンタムインジケーターで、買われ過ぎ・売られ過ぎゾーンを視覚的に特定し、トレンド反転の兆候を検出するために設計されています。 M1~M30 までのタイムフレームでの使用に最適で、すべての通貨ペアおよび金融商品に対応しています。
主な特徴: MFI期間の設定可能: 初期値は 14 ですが、戦略に応じて調整可能。 買われ過ぎ/売られ過ぎレベル: 初期設定は 70(買われ過ぎ) と 30(売られ過ぎ) で、極端な市場状態を識別。 直感的な色分け: 青色 は売られ過ぎ、 赤色 は買われ過ぎを示します。 マルチタイムフレーム(MTF)対応: 現在のチャート時間軸または上位足を使用可能。 包括的なアラートシステム: ポップアップ、サウンド、Eメール、プッシュ通知に対応。 動作の
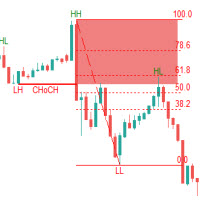
The Fibonacci Confluence Toolkit is a powerful indicator designed to highlights areas of interest where significant price action or reactions are anticipated, automatically applies Fibonacci retracement levels to outline potential pullback zones, and detects engulfing candle patterns.. This tool automates the detection and visualization of key market structures and potential reversal zones. Key Features: CHoCH Detection (Change of Character):
Automatically identifies structural shifts in marke
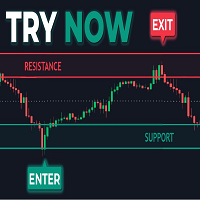
The Predictive Ranges indicator aims to efficiently predict future trading ranges in real-time, providing multiple effective support & resistance levels as well as indications of the current trend direction.
Predictive Ranges was a premium feature originally released by LuxAlgo in 2020.
The feature was discontinued & made legacy, however, due to its popularity and reproduction attempts, we deemed it necessary to release it open source to the community.
USAGE Figure 1 The primary purpo

Magic Price Action – Advanced Candlestick Pattern Recognition by Mr Green76
Elevate your price action trading with Magic Price Action , an advanced MetaTrader 4 indicator that streamlines candlestick analysis through automated detection, deep customization, and an intuitive on-chart control panel. Stop manually scanning charts—let Magic Price Action do the heavy lifting with precise, real-time identification of key candlestick patterns based on your personal strategy. Key Features Intellig
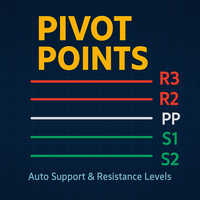
Pivot Points MT4 – Automatic Support and Resistance with Professional Accuracy Unlock structured technical analysis with Pivot Points MT4 , the ultimate indicator that automatically draws key resistance (R1, R2, R3) and support (S1, S2, S3) levels based on the previous day’s price data. Designed for traders who demand clarity, discipline, and a tactical edge in every session. What does this indicator do? Automatically calculates and plots daily Pivot Point levels. Clearly shows: Central pivot

概要 Trend Riderは、 MetaTrader用のプロフェッショナルなトレンドフォローインジケーターです。チャート上で複数のスイングサイズを直接ハイライト表示することで、市場構造分析を簡素化します。時間足を切り替えることなく、トレンドのダイナミクスを包括的に把握できます。
主な特徴 1. マルチスイング構造ディスプレイ 同じチャート上で複数のスイングサイズを視覚化します トレーダーが市場全体の構造を即座に認識するのに役立ちます トレンドのフェーズと方向性を明確にする 2. 動的パラメータ – 最適化は不要 すべての設定は動的に計算されます インジケーターは選択されたチャートの時間枠に自動的に調整されます 異なるペアや時間枠のパラメータを手動で調整する必要はありません ロード後すぐに動作可能 - プラグアンドプレイ 3. 取引スタイルの選択手段としての時間枠 選択したチャートの時間枠によって取引期間が決まります スキャルピングやデイトレードには、より短い時間枠(例:M1~M15)を使用する デイトレードやスイングトレードには中期時間枠(例:M30~H4)を使用する ポジショ
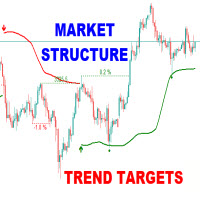
The Market Structure Trend Targets is a powerful trading indicator designed to give traders a clear, structured, and data-driven view of market momentum, breakouts, and key price reaction zones. Built on the principles of smart market structure analysis , it helps identify not only trend direction, but also precise breakout levels , trend exhaustion , and potential reversal zones — all with visual clarity and trader-friendly metrics. Key Features Breakout Points with Numbered Markers

ダイナミックPOCゾーンインジケーター 概要:
ダイナミックPOCゾーンインジケーターは、主要な価格コントロールエリアを特定し、チャート上に直接表示するリアルタイム分析ツールです。これらのゾーンは、価格がバランスを取り、サポートまたはレジスタンスとして機能する可能性が高いエリアを反映しています。 主な機能: 自動調整ゾーン: 再描画せずに、市場構造に基づいてゾーン レベルを継続的に更新します。 明確な視覚的表現 – ゾーンは領域として表示されるため、継続、統合、ブレイクアウトの機会を簡単に特定できます。 複数市場への互換性: あらゆる時間枠で外国為替、株式、暗号通貨、商品に機能するように設計されています。 仕組み:
この指標は価格行動データを処理して、取引活動が集中する傾向にあるエリア(一般的にPOC(Points of Control)と呼ばれる)を検出します。これらのゾーンは動的であり、新しい価格データが利用可能になるとリアルタイムで調整されます。 適しているもの:
このインジケーターは、あらゆる取引スタイルと経験レベルに適しています。スキャルパー、デ
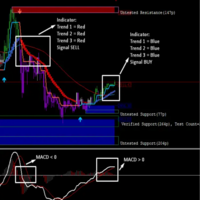
Scalping Road is a bundle of trading indicators and easy to use. There are 4 main indicator that give you a best signal to open position. You can do scalp or swing depend on timeframe you use.
After purchase you will be able to instantly download the Scalping Road indicator. Moreover I provide the extra indicator shown in the screenshots below to all users of the Scalping Road for free as a bundle! The combo of these indicators can help you make your trading with any timeframe easier and more

This is an indicator that has been updated from the previous VRC indicator, which has both buy and sell arrows now, and it is optimised from the previous one. You can try it out, the version is upgraded and might suit your trading style. You can also use this indicator as a confluence, or you can use it as a main signal provider; it can be used along with your strategy or top-down approach analysis. Past performance does not guarantee future performance; kindly do a top-down analysis and keep yo

The indicator identifies ordered trend structures. Each structure consists of at least three waves: the formation of the primary movement, a rollback, and a breakout of the primary movement.
One wave in the structure is considered to be the market movement between opposite price extremes, which corresponded to different positions of the points of the classic Parabolic Support And Reverse (PSAR) indicator relative to the closing prices of the candles: a point below the price - searching for a m
Pro Range is an advanced technical analysis tool designed to automatically detect price ranges (sideways market structures) on the chart. The indicator is based on Smart Money logic and Richard Wyckoff’s theory , which state that key market scenarios are often formed within ranges — accumulation before an uptrend and distribution before a downtrend . What is a range and why is it important? A range is a zone where the price moves between upper and lower boundaries without a clear trend. These zo

Supernova Trading Indicator – See the Market Like Never Before Supernova isn’t just an indicator — it’s your secret weapon. Powered by advanced algorithms and real-time analysis, Supernova cuts through the noise and reveals high-probability entry and exit points with stunning clarity. No more guesswork. No more hesitation. Whether you're trading forex, crypto, or stocks, Supernova adapts to any strategy and any timeframe — delivering clean, confident signals that help you trade faster, smarter,

Momentum Shark Pro is an advanced arrow-based trading system that provides high-accuracy signals for both new and experienced traders. With an adaptive algorithm, it displays clear buy and sell arrows, simplifying trading decisions. Optimized for key currency pairs and major sessions, Momentum Shark Pro helps users confidently capture high-probability entries and exits.
Features of Momentum Shark Pro Indicator Arrow-Based Signal System Displays buy and sell arrows directly on the chart for e

Fractal L.S Breakout Alert (v1.07)
再描画しないインジケーターで、確定したフラクタルを検出し、価格がそれを突破したときに通知します。ノイズを排除しつつ、客観的なブレイクアウト確認を提供し、あらゆる戦略を補完します。 機能 再描画しないフラクタル – 確認済みの高値/安値のみを表示 ブレイクライン – フラクタルを超えてローソク足が終値を付けると縦線を描画 タッチモード – リアルタイムのタッチまたは足の確定で検出可 ピップラベル – オプションでブレイク距離を表示 アラート – プッシュ、メール、ポップアップ通知 新フラクタルアラート – 新たに確定したフラクタルごとの通知オプション クリーンアップ – フラクタルやブレイクアウトのオブジェクトをワンクリックで削除 スタイル設定 – 矢印、ライン、ラベルの色をカスタマイズ フラクタルTF – どのTFでフラクタルを検出するかを選択 ブレイクアウトTF – どのTFでブレイクアウト足を評価するかを選択 永続表示 – TF変更やパラメータ変更後もマークを保持 使い方 Inputs (入力タブ) On C
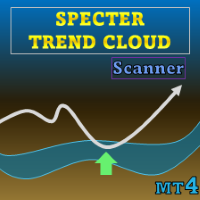
特別オファー : ALL TOOLS 、各 $35 ! 新ツール は $30 ( 最初の1週間 または 最初の3回の購入 )です! Trading Tools Channel on MQL5 :最新情報を受け取るため、私の MQL5 チャンネルに参加してください Specter Trend Cloud は移動平均に基づくトレンド可視化ツールで、市場の方向性と主要なリテスト機会を強調表示するよう設計されています。適応型平均にボラティリティ調整を組み合わせ、トレンド変化に応じて反転するカラー「クラウド」を生成し、進行中のトレンド下で価格が短期平均とどのように相互作用するかを追跡します。
MT5 版の詳細はこちら: Specter Trend Cloud MT5 Scanner MT4 版の詳細はこちら: Specter Trend Cloud MT4 Scanner その他の製品はこちら: All P roducts Key Features マルチ MA コアエンジン
SMA、EMA、SMMA (RMA)、WMA、VWMA から選択可能。短期 MA

Solenox Boost — arrow-based price direction indicator. Solenox Boost is a visual arrow indicator that displays potential market entry points directly on the chart. It generates buy and sell signals based on the analysis of local highs and lows smoothed by moving averages, while also factoring in market volatility through the ATR indicator. Signals appear as clearly visible “BUY” and “SELL” text labels at precise price levels and times. It is strongly recommended to enter trades only after the cu

The Zebra Arrow is a custom technical analysis indicator.
It generates non-repainting buy and sell arrow signals based on a hybrid strategy combining Williams’ %R (WPR) and Relative Strength Index (RSI) momentum criteria, enhanced with optional Moving Average (MA) filter .
This makes it a versatile tool for trend-following and breakout strategies across multiple timeframes.
Supports customizable: On-screen alerts Sound notifications
Visualization Arrows : Aqua for buy, Yellow for sell (ca
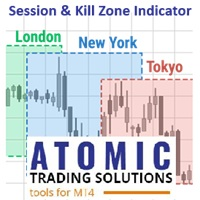
Atomic Market Session and Kill Zone Indicator v1.20 TRADING AUTOMATION EXPERTS - MT4 tools designed to enhance trader performance. ______________________________________________________________________________________________________________________________________________________________________________________
Master the Smart Money Strategy with Precision The Atomic Session and Kill Zone Indicator is designed for traders who follow the Smart Money Concept (SMC) . It allows you to define a

Forecast Session Deviation - Product Description & User Guide Product Overview Forecast Session Deviation is a sophisticated trading indicator that identifies key market session zones and projects future price behavior based on historical patterns. By analyzing specific session anchors (like the Tokyo session), it creates visual zones that help traders anticipate where price is likely to move, complete with multi-level deviation bands for risk management. Key Features: Automatic session det
The *Account Growth Target* is a smart analytical tool for MT4 that predicts when your trading account will reach a specified profit target based on your current trading performance. By analyzing historical trade data and calculating profitability rates, it provides actionable insights to help you refine your strategy and stay motivated.
### *Key Features:* - *Target Balance Forecast* – Projects the exact date/time your account will hit your desired profit goal. - *Working Hours Fil
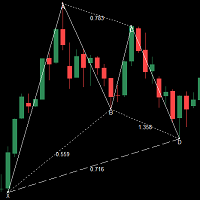
XABCD (Harmonic Pattern) Ratio Labeler – Simple, Visual Pattern Validation Tool This tool was designed for traders who work with harmonic or XABCD patterns and want a fast, flexible way to manually validate them on their chart. How It Works: Click a button to place 5 editable labels (X, A, B, C, D) directly on your chart. Drag them to your desired swing points. The tool automatically draws the connecting legs (XA, AB, BC, CD, etc.) and calculates key Fibonacci ratios: AB / XA BC / AB AD / XA

## Candle High Low Marker with Breakout Colored Candles Indicator
The **Candle High Low Marker with Breakout Colored Candles** is a powerful MetaTrader 4 (MT4) indicator designed to enhance technical analysis by marking high and low price levels of a specific candle within a user-defined time range and visually highlighting breakout candles with distinct colors. Ideal for traders seeking to identify key support and resistance levels and track price breakouts, this indicator provides clear visu

キャンドルオーバーレイ キャンドルオーバーレイは 、多用途で高精度なMetaTraderインジケーターです。トレーダーは、任意の時間枠のローソク足を他のチャートに重ねて表示できます。この機能により、現在のチャートの時間枠に関係なく、主要な価格水準や構造的な動きをより視覚的に把握し、市場の透明性が向上します。 このインジケーターの決定的な利点は、より長い時間足のデータを、より短い時間足のチャートに直接組み込むことができる点にあります。より長い時間足は、参加者数と取引量が多いため、本質的に価格水準の信頼性と意味がより高くなります。その結果、より長い時間足の高値、安値、そしてローソク足は、特にブレイクアウトに関して、より強力な基準点として機能します。ブレイクアウトは、より短い時間足だけで見ると、偽シグナルがはるかに多く発生する傾向があります。 このインジケーターは、選択した時間枠における現在および過去のローソク足(複数可)をプロットし、高値、安値、中間値、四半期値、そして内蔵のADR(日足平均レンジ)といった重要な水準をマークします。これらの価格帯はそれぞれ異なる目的を持っています。 より長

Introducing a powerful, precision-engineered indicator that seamlessly combines Pivot Points, Moving Averages, and Multi-Timeframe Analysis to deliver high-probability Buy and Sell signals in real-time. This tool is your strategic edge, designed to identify trend reversals, market momentum, and optimal trade entries, no matter your preferred trading style.
Our algorithm goes beyond standard indicators—by analyzing multiple timeframes simultaneously, it spots true market turning points while fi
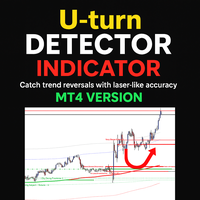
Turn Every Market Reversal Into a Money-Making Opportunity With the U-turn Detector Indicator! Imagine having a tool that visually reveals the exact moment price is about to flip — before the crowd catches on. The U-turn Detector isn’t just another indicator... it's your edge in spotting clean, confident entries and exits in forex. If you've ever been frustrated by fake breakouts, late signals, or messy charts — you're about to fall in love with this tool. URGENT REMINDER: PRICE MAY DOUBLE

Current Pointer - Ride the Market Flow with Confidence Stop guessing the market's direction. After countless hours of my own personal coding and rigorous testing, I developed Current Pointer to solve a common problem for traders: cutting through market noise to find the true trend. This isn't just another simple arrow indicator; it's a dedicated tool crafted with care to bring clarity and confidence to your charts. The Philosophy Behind Current Pointer The market is designed to be confusing. In

Candle Timer Pro is a lightweight and highly customizable on-chart utility for MetaTrader 4 that provides precise candle timing and market insight at a glance. Ideal for active traders, this tool displays the remaining time for the current candle, a dynamic progress bar, and real-time spread information—all in one compact, configurable panel. Used and tested by more than 800 traders worldwide! Join the professionals who have chosen the full-featured Candle Timer PRO. Key Features Candle Countdow

Fibonacci Master Pro - Professional Trading Tool Technical Description Fibonacci Master Pro is a MetaTrader 4 indicator designed to assist traders in identifying potential price reaction levels using Fibonacci retracement analysis. The tool focuses on the 23.6% and 61.8% retracement levels, which are widely monitored in technical analysis. Key Functionalities Fibonacci Level Detection Plots and monitors Fibonacci retracement levels between user-selected swing points Specifically tracks the 23.6
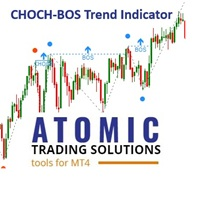
Atomic CHOCH BOS Trend Indicator v1.30 TRADING AUTOMATION EXPERTS - MT4 tools designed to enhance trader performance. Master the Smart Money Strategy with Precision _____________________________________________________________________________________________________________________________________________________________________________
Smart Market Structure Analysis Unlock the power of smart market structure analysis with the Atomic Break of Structure Change of Character (CHOCH) / Break of St
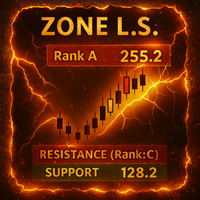
Zone L.S サポート&レジスタンスゾーンファインダー (v2.05)
MT4向けの高度なゾーン強度測定ツールで、複数の強度基準に基づき主要なサポート・レジスタンス領域を検出、評価、可視化します。 機能 検出基準: 任意の組み合わせに強度ウェイトを割り当て: Micro Zones Strength – ロータイムフレームでの高度なゾーン検出 Fractal Points Strength – 確定フラクタルの高値/安値タッチのカウント Advanced Clusters Strength – 始値/終値のクラスタリングをカウント On Tick Bounces Strength – 高出来高バーのレベル反発をカウント Round Numbers Strength – 整数価格レベルをオプションで含む バックテスト&マージ: StartOffset から EndOffset バーをスキャン; Merge Sensitivity × 平均レンジ内の強度ポイントを統合してゾーン化 ゾーン強度&分類: 各ゾーンの全強度ウェイトを合算し、最小強度%未満を除外し、残りを Aクラス (最強)

The All Averages Scanner Dashboard is an MT4 Indicator designed to show the current state of different kinds of Moving averages. Read the blog post for detailed explanation with screenshots: https://www.mql5.com/en/blogs/post/762972
It is great if you are testing out different kinds of moving averages with respect to price and other averages. Also if your strategy is based on MA Stacking one on top of another, you can use this for validation. You can also create Custom baskets as shown below f
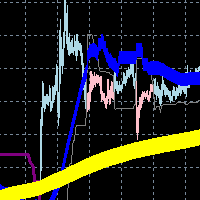
The FineK5 indicator is a technical analysis tool that helps traders identify trends and entry points into the market. It combines several elements, including moving averages and support/resistance levels, to help them assess market movements more accurately.
Key Features: Trend Lines: The indicator displays major trends using colored lines, helping traders visually determine the market direction. Support and Resistance Levels: The indicators highlighted on the chart help identify key levels w

CDS Fractal Blade Session - AIO A precision-engineered, all-in-one custom dynamic system designed to identify and exploit high-probability breakouts during key market trading sessions. The CDS Fractal Blade Session is moves beyond simple session boxes, integrating a sophisticated multi-layered approach to define the most critical price levels with surgical accuracy. This premium indicator serves as the core engine for the CDS Asian Fakeout EA and other automated systems developed by our team.
The MT4 " DayLevelsSignalPro " indicator . Signal Indicator – generates the most accurate buy / sell signals . Noise filtering indicator – reduces false signals . Signal information with a clear , understandable and visually convenient view . User- friendly graphical interface ( colors , sound notifications , customization options ) . - Generation of a breakdown signal for significant peaks of the Current day . - Generation of a signal for the breakdown of the previous Day 's Level - Generation

Turbo Scalper Pro Fast. Smart. Reliable.
The ultimate scalping companion built for serious traders who love precision and style! What Is It? Turbo Scalper Pro is a powerful non-repainting scalping indicator based on a time-tested strategy:
EMA crossover
RSI filter
Session time filtering for smarter signals
All this, packed into a clean, modern on-screen dashboard with live signals, status lights, and a real-time clock. Key Features: Non-Repainting Buy/Sell Arrows
Accurat
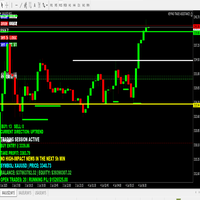
TRADING STRATEGY GUIDE DELIVERY The full Trading Strategy Guide will be sent directly to you after purchase.
Just message me on MQL5 and ask for it — you'll receive it instantly, along with priority support and setup help. Powered Market Scanner for Smart Trading Decisions Keypad Support & Resistance is a next-generation MT4 trading system built for serious traders who demand precision, reliability, and clarity. It combines advanced smart filters with real-time price structure logic to genera

This is an indicator that shows the current trend. It does not show the moment to open an order. It is a filter for your trading signals: trade only in the direction of the trend indicated by the indicator, and close orders when the trend is opposite. This indicator does not use any standard oscillators or indicators. All its calculations are based only on the prices of the last N bars of the chart. The indicator has the ability to display values from a larger timeframe chart. Features of the

Description Advanced indicator for MetaTrader 4 that identifies consecutive candle patterns and generates buy/sell signals with an optional moving average filter. Main Features Functionalities Pattern Detection : Identifies sequences of bullish or bearish candles Moving Average Filter : Option to filter signals using a moving average Visual Signals : Colored arrows indicating entry points Custom Alerts : Sound and visual notifications Intuitive Interface : Parameters organized by groups

Support & Resistance Deluxe v2.20 – Your Smart Radar for Key Market Levels! A powerful indicator for demanding traders who seek precision, clarity, and reliable signals for support and resistance! What Does This Indicator Do? This is an advanced Support and Resistance indicator for MetaTrader 4 (MT4) that: Automatically scans your chart to detect the most relevant levels based on: Price highs and lows Volume (optional) Number of touches (for level validation) Plots lines and v

Miraculous Indicator – ガン・スクエア・オブ・ナインに基づく100%非リペイントのFXおよびバイナリーツール この動画では、FXおよびバイナリーオプションのトレーダー向けに特別に開発された、非常に正確で強力な取引ツールである Miraculous Indicator を紹介しています。このインジケーターがユニークなのは、伝説的な ガン・スクエア・オブ・ナイン と ガンの振動の法則 に基づいている点で、現代の取引で利用できる最も正確な予測ツールの一つとなっています。 Miraculous Indicatorは 完全に非リペイント であり、ローソク足が確定した後にシグナルが変化したり消えたりすることはありません。つまり、見たものがそのまま利用できます。これにより、トレーダーは自信を持ってエントリーおよびエグジットを行うための信頼性と一貫性のある根拠を得ることができます。 主な特徴: ガン・スクエア・オブ・ナインとガン理論に基づいて構築 100%非リペイントのシグナルシステム すべての時間枠(M1、M5、H1、H4、日足、週足)で機能 FXおよびバイナリーオプション取引
Quantum Core – Phase Shift is a neural synchronization engine designed for intermarket phase diagnostics.
Harnessing temporal displacement algorithms and flux harmonics, it decodes the hidden oscillatory behavior of market energy fields. The NeuroLink Trace renders the core stability vector, while the Quantum Phase Core tracks phase divergence through a smoothed temporal conduit.
Anchored to a central gravity threshold, it expands and contracts dynamically, visualizing phase shifts in real ti
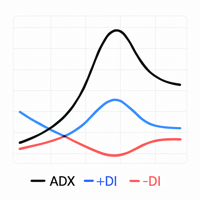
Custom ADX Indicator Based on Open Price Only The standard ADX indicator is usually calculated using the High, Low, and Close prices. This produces a smooth and visually appealing line that represents price action. However, ️ it lacks precision — as the candle moves, the ADX, +DI, and -DI values also change suddenly, potentially triggering false signals based on the candle’s initial plotting. A curious observation: even when the input is modified to use the Open price in the indicator se
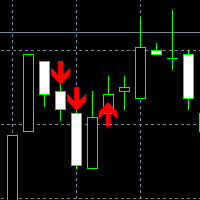
Range one indicator MT4, for any instruments and it alerts instant, suitable and works best timeframes (4H) and higher 1 . to trade as trend you will need to have Confirmation technical indicator called PARABOLIC SAR Periods step = 0.9 and Maximum = 0.2 Go buy if PSAR is Trending (if PSAR is greater then previous PSAR) and Go Sell (if PSAR is lower then previous )
2. Range one indicator is for One candle to trade when it alerts you Buy Go Buy for One candle and Sell Respectively
3 see the pi

NextGenTrend
Индикатор нового поколения, определяющий импульсные моменты для входа на основе свечной динамики и фильтрации по направлению движения. Умные стрелки только в ключевые моменты — без лишнего шума.
NextGenTrend — это профессиональный стрелочный индикатор, созданный для точного входа в рынок в строго определённых точках, когда импульс и направление совпадают. Он ориентирован на чистую, осмысленную торговлю — без визуального мусора и избыточных сигналов.
Что делает его уникальн

MHI Probabilityで市場の謎を解き明かせ!
驚異の戦略コンパスとなるローソク足分析ツール 4つの独自戦略( MHIマジョリティ、MHIマイノリティ、ミリョンマジョリティ、ミリョンマイノリティ )で、過去5本のローソク足の動きを確率的に分析。視覚的に優れた精度でトレードチャンスを提示します。 革命的なMHI Probabilityの特徴 4戦略で無限の可能性
MHIマジョリティ (トレンド追随)、 MHIマイノリティ (逆張り)、 ミリョンマジョリティ (主流強化)、 ミリョンマイノリティ (逆行捕捉)から選択可能 透明な分析ロジック
陽線(終値>始値)、陰線(終値<始値)、十字線(ドージ)を自動計測
マイノリティ戦略 では陰線>陽線で買いサイン、陽線>陰線で売りサインを5分間隔で厳密に発信 鮮明な視覚表示
買い/売り矢印が正確に表示され、戦略条件(ドージや未定義状態)が色分けで一目瞭然 包括的な統計パネル
勝率、敗率、ゲール1/2のデータをリアルタイム表示
次回の5分周期エントリータイミングを自動予測 市場リズムに完全同期
5分サイクルで動作し、ノイズや偽信号
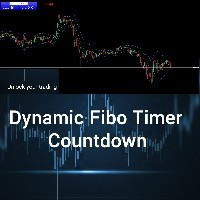
Fibo + ตัวจับเวลาถอยหลัง (ตัวบ่งชี้ MT4) แนวคิด: Fibo + Countdown Timer คืออินดิเคเตอร์ที่รวม เส้นแนวรับ/แนวต้านของ Fibonacci Extension เข้ากับ ตัวนับเวลาถอยหลังแบบแท่งเทียน ไว้ในเครื่องมือเดียว เหมาะอย่างยิ่งสำหรับเทรดเดอร์ที่ใช้กลยุทธ์ Price Action, Breakout หรือ Scalping คุณสมบัติ เส้นขยายฟีโบนัชชีอัตโนมัติ ตัวบ่งชี้วาดระดับการสนับสนุน/การต้านทานหลัก 4 ระดับโดยอ้างอิงจาก EMA ของราคาสูงสุดและต่ำสุด : L1 (Inner High) = EMA ของค่าสูงสุด L2 (ค่าต่ำสุดภายใน) = EMA ของค่าต่ำสุด L3 (จุดส

Strike Logic - このインジケーターは、実用的で実践的な取引のために設計されており、説明はほとんど必要ありません。(長期保有向けに設計されています) 概要
Strike Logicは、スイングプライスの動向、適応型ボラティリティフィルタリング、そしてトレンド確定ロジックに基づいて、高確率ゾーンを特定するように設計されたテクニカル分析指標です。トレーダーは、確定したプライスアクションを用いて、モメンタム主導のポイントを見極めるための明確な枠組みを得ることができます。 コアロジック
このインジケーターはスイングレベルを追跡します。市場が一定数のバーでこれらのレベルを上回ってまたは下回って終値を付けた場合、Strike Logicはこれを潜在的なブレイクアウト(上昇市場、下降市場)と解釈します。サポートレベルとレジスタンスレベルを示す水平線を描画し、スイングレンジの高値と安値は視覚的に分かりやすくするためにそれぞれ異なる色で表示されます。
特徴 高/低レベルに基づいてブレイクアウト信号を検出します。 有効な信号を確認するには、設定可能な数の連続バーが必要です。 主要な価格レ
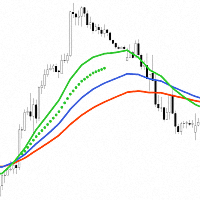
"Trend Acceleration 4" is designed to help traders navigate the market situation. The indicator shows three multi-time frame "Moving Averages" , which show the trend (tendency) of the price movement of financial instruments. They are the basis for analysis of dependencies, which with great success show the acceleration or deceleration of the trend (tendency) of the financial markets.
The choice of using three moving averages in the "Trend Acceleration 4" indicator comes from the idea of analy
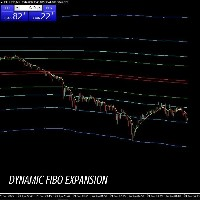
Core Components and How It Works This indicator essentially combines three main elements to provide a comprehensive view of price action: The EMA14 Line (Yellow Line) This is a Simple Exponential Moving Average calculated from the closing prices of the last 14 candlesticks. Function: Its primary role is to show short-term price trends . If the line is sloping upwards, it suggests an uptrend; if it's sloping downwards, it indicates a downtrend. The Longer EMA Lines (Two Red Lines) The indicator c
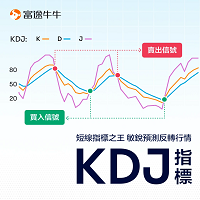
The KDJ indicator is a very useful momentum oscillation indicator made up of three indicator lines K, D, J. Many people also refer to the KDJ indicator as a “random indicator” because it actually adds a J line as an auxiliary on the basis of a traditional random indicator (containing only K, D lines). The KDJ indicator has a certain degree of comprehensiveness, drawing on the advantages of the William Indicator (WMSR) and Moving Averages (MA) to help investors better judge market trends and ide

Cyborg Arrow Ai is a next-generation neural-trade interface engineered for high-frequency market navigation. Fused with dual-pulse MACD logic and a quantum-calibrated confirmation matrix, it detects tactical trend reversals with AI-grade accuracy.
The system deploys Optic Pulse markers — vivid up/down arrows — precisely after neural synchronization confirms directional integrity. Integrated pulse-strength analysis filters out noise, ensuring only high-fidelity signals pass through the Cyborg Co

「Naturu(ナチュル)」は自然の対称性をアルゴリズムとして用いる手動インジケーターです。
シンプルな戦略と隠された知恵でマーケットを制覇しましょう! インジケーターを読み込むと、上側(Top)と下側(Bottom)の2本のラインが表示されます。
ラインを一度クリックするとアクティブ化され、移動させたいローソク足をクリックするだけでその位置に移動できます。 高値ポイントと安値ポイントを設定すると、インジケーターが自動的に以下を計算します: マゼンタのゾーン:ブル(買い勢)とベア(売り勢)の関心が最も接近する、サポート/レジスタンスになりやすいエリア グレーのゾーン:次に注目されるエリア アクア色のライン:ブルの価格目標 ゴールド色のライン:ベアの価格目標 手動インジケーターは完全なコントロールと柔軟性を提供し、リアルタイムの相場状況や個人の直感に応じてラインを調整できます。
価格の動きを自ら深く分析することで、サポートやレジスタンス、チャートパターンの形成を本質的に理解できます。
人間の判断を活かすことで、自動システムが誤認しがちなノイズを除去し、誤シグナルを減らします。
また、自
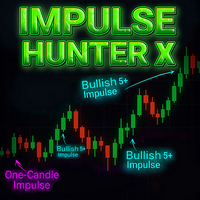
Impulse Hunter X Indicator – Professional Market Movement Radar Impulse Hunter X is a professional trading tool designed to help traders detect new, strong market impulses. It identifies and alerts you to powerful price movements, ensuring you never miss a trading opportunity. Every impulse type has been meticulously tested and refined for accuracy. Before using, make sure to configure the input parameters, especially the candle body size for stronger impulses! Key Features Detects stro

Turn chaos into clarity. Trade with precision. Bitcoin’s volatility can be your greatest ally — or your fastest downfall. Btc Trailblazer is your AI‑inspired market scout, designed to decode BTC’s behaviour in real‑time and flag the traps before you step into them . Harnessing an ensemble of advanced, pre‑defined technical algorithms, this indicator goes far beyond basic buy/sell alerts: AI‑inspired analysis engine blending trend, momentum, volatility, market structure, and regime context. Fals
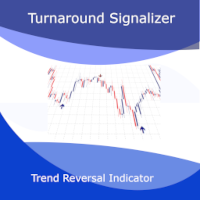
Introducing the Turnaround Signalizer: Your Competitive Edge in Trend Reversals.
Developed for the MetaTrader 4 platform, this trend reversal indicator is a robust tool for traders who aim to identify market inflection points with high probability. Its proprietary algorithm continuously analyzes price behavior, filtering out market noise to highlight the most significant shifts in direction.
Versatility for All Trading Styles
Perfect for Scalping: The Turnaround Signalizer has been optimi
MetaTraderマーケットは、開発者がトレーディングアプリを販売するシンプルで便利なサイトです。
プロダクトを投稿するのをお手伝いし、マーケットのためにプロダクト記載を準備する方法を説明します。マーケットのすべてのアプリは暗号化によって守られ、購入者のコンピュータでしか動作しません。違法なコピーは不可能です。
取引の機会を逃しています。
- 無料取引アプリ
- 8千を超えるシグナルをコピー
- 金融ニュースで金融マーケットを探索
新規登録
ログイン