XCalper Triad MT4
- インディケータ
- バージョン: 2.7
- アクティベーション: 20

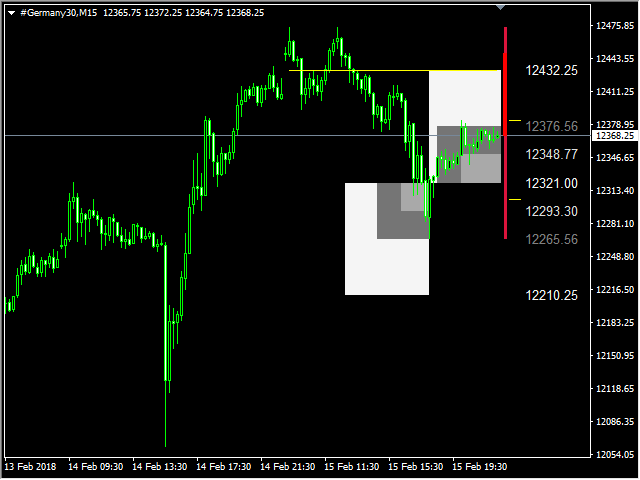
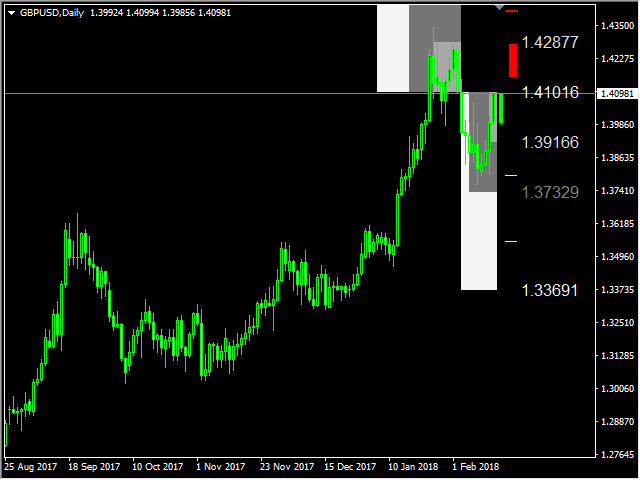
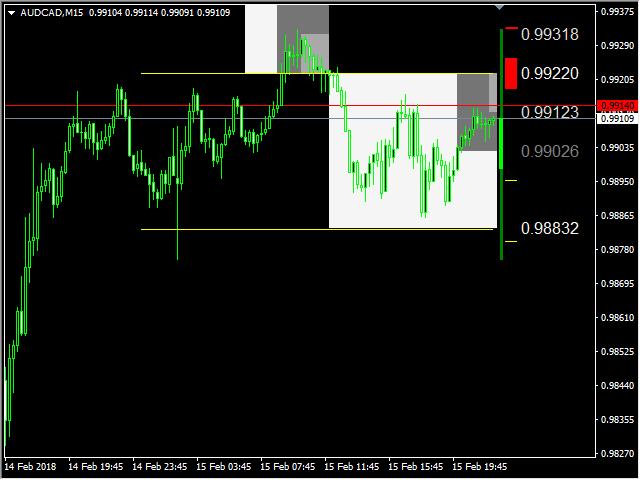
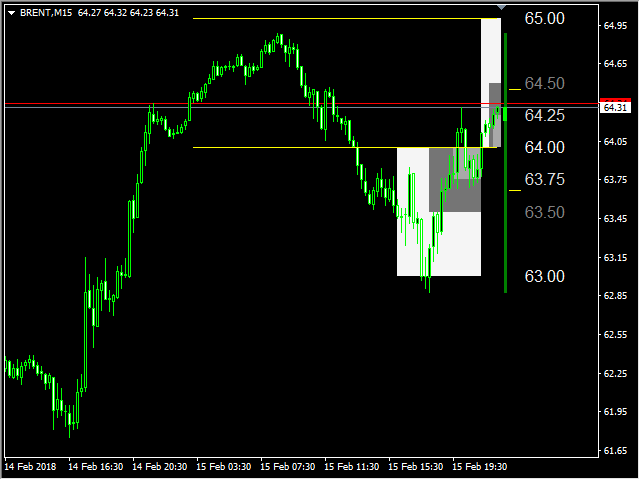
xCalper Triad works as a Target scanner tool.
Its algorithm calculates price level areas with high precision and instantly. By default, they are automatically identified and the trader normally sets visual parameters only.
Explore a new perspective in price action analysis by adding Triad to your setup and surprise yourself.
Main Features
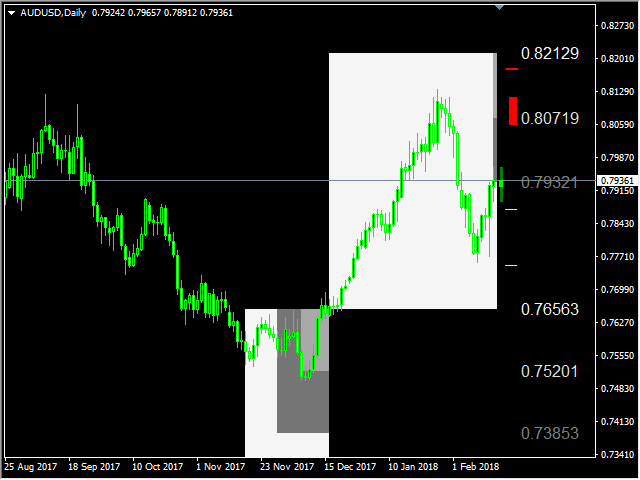
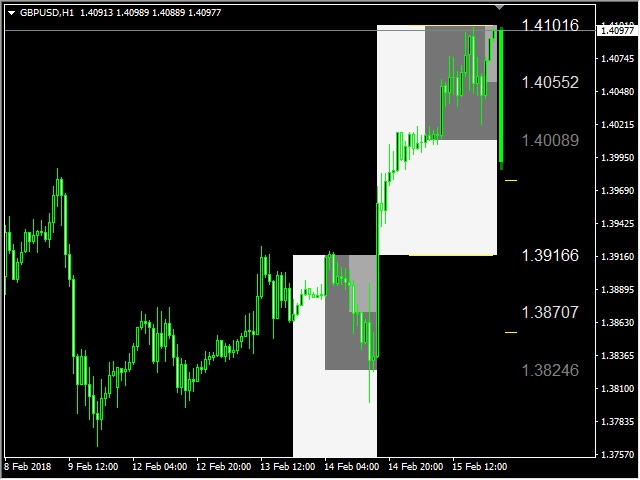
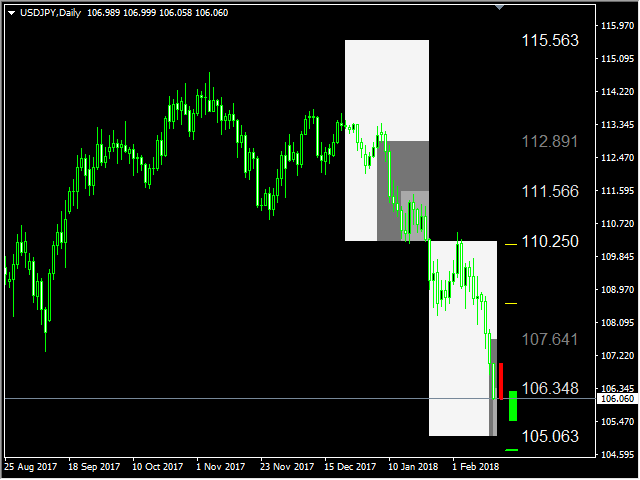
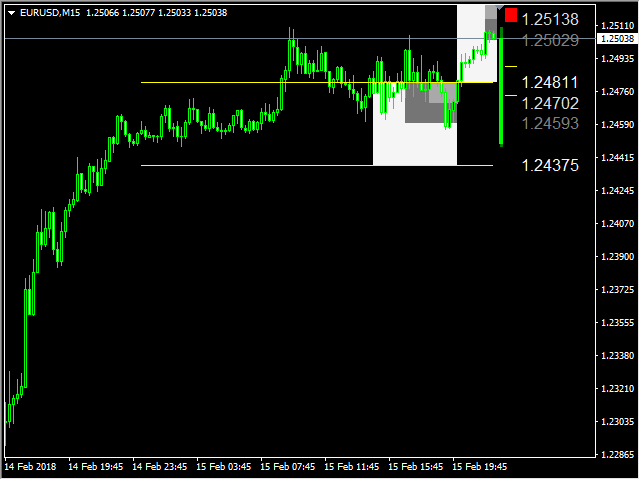
- Automatic & exclusive Target levels
- Daily candle representation in all intraday timeframes.
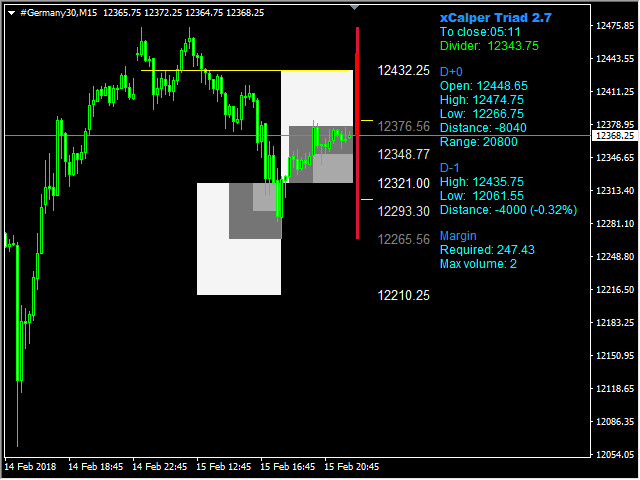
- Side panel information essential to all traders:
- Remaining time to close candle
- Current day open, high, low, maximum range and distance from open price
- Previous day high, low, distance from close to current price and percentage
- Margin required
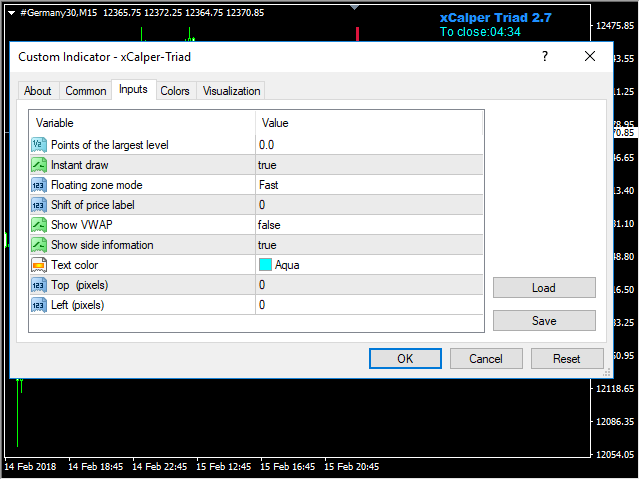
Parameters
- Points of the largest level - Sets the maximum amplitude of the most distant target. Default: 0 (automatic).
- Instant draw - Update by current candle (not closed yet) for real time display. If false, targets are updated as soon as new candle opens.
- Floating zone mode - Floating zone calculation: Fast or Slow. Fast for smaller targets and Slow for bigger targets, usually during trend movements.
- Shift of the price label - Distance of target value texts.
- Show VWAP - Show or hide the intraday VWAP plot in chart.
- Show side information - Show or hide side information set.
- Text color - Side information font color.
- Top - Side information distance from top of chart.
- Right - Side information distance from right of chart.
Usage
Please, read Triad User Guide.