Beta Bands

5

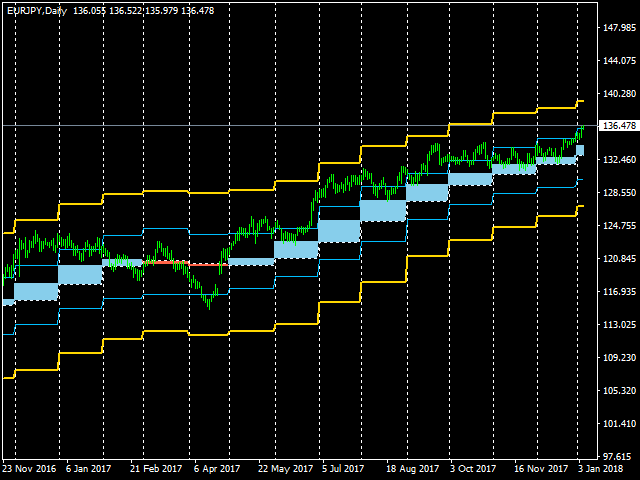
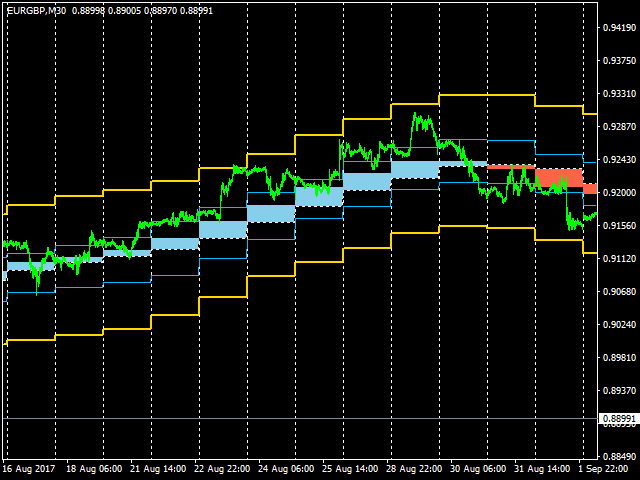
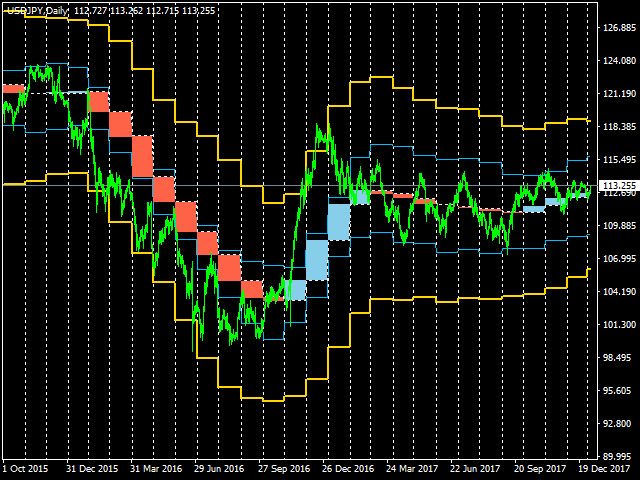
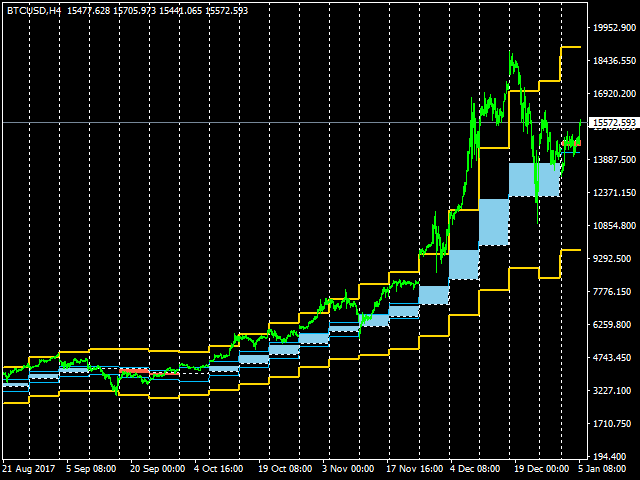
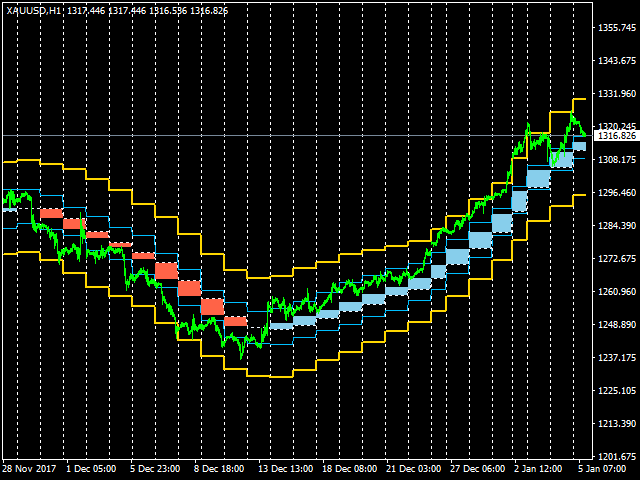
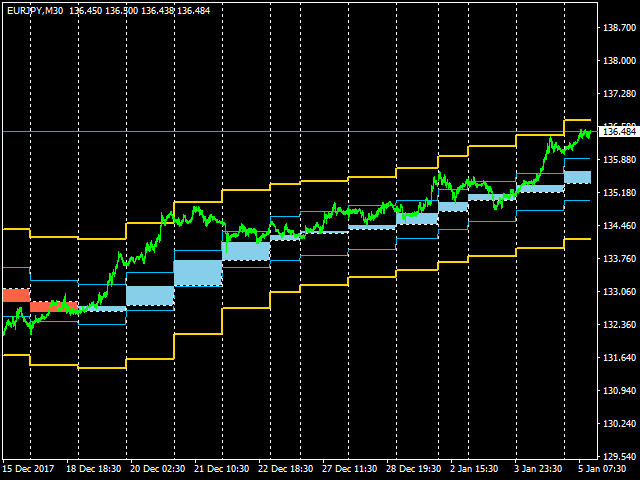
This indicator shows main trend, entry zone and exit zone.

This is a muti-timeframe indicator, so it is always repainting in the current period of the higher timeframe.


Features

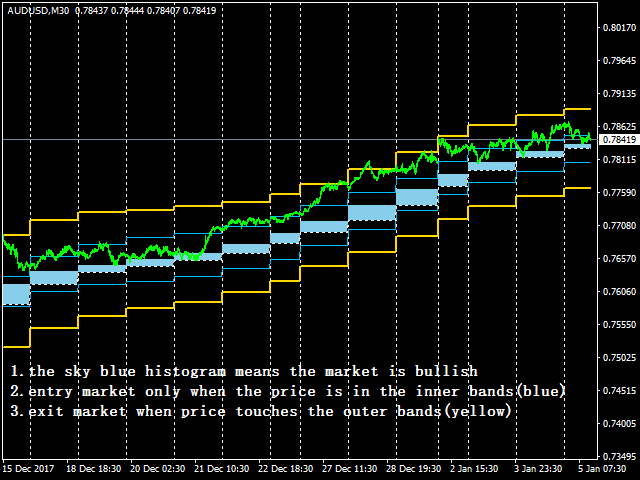
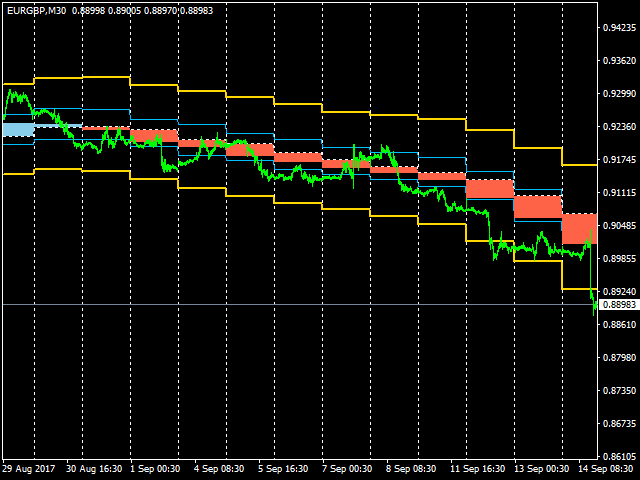
  • Colorful Histogram: it indicates the main trend, the tomato means the market is bearish,and the sky blue means the market is bullish.
  • Inner Blue Bands: it is entry zone for entry market, the market is relatively safe for entry.
  • Outer Yellow Bands: it is exit zone for exit market, the market is oversold or overbought.
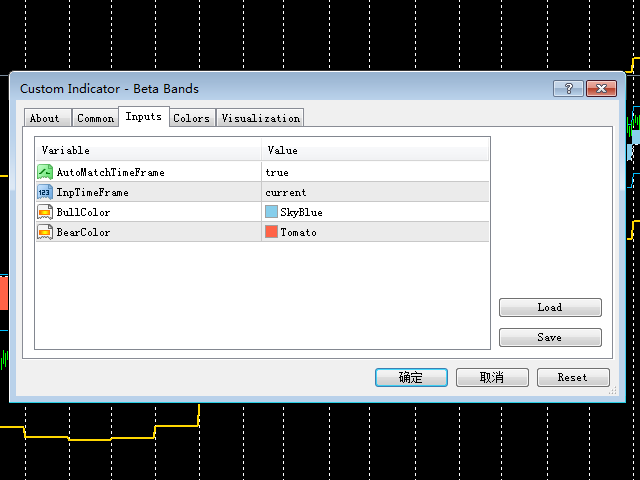

Settings

  • AutoMatchTimeFrame: if true,the indicator will automatically select a higher timeframe
  • InpTimeFrame: input timeframe by users if AutoMatchTimeFrame is false.
  • BullColor: the color of histogram in bullish market (default is sky blue).
  • BearColor: the color of histogram in bearish market (default is tomato).


Usage

Entry the market when the price is in the inner bands. If the price reached outer bands, order should be closed.

The key of trading is to select a proper timeframe. Of course, you may create your strategy based on this indicator.

レビュー 9
Jimmy Christianus Hendrikus Janssen
764
Jimmy Christianus Hendrikus Janssen 2025.01.15 19:19 
 

very good indicator

update! i use i for a couple of days now it is a must have tool for traders. so clear and reliabile

おすすめのプロダクト
This is a ready-made strategy for binary options! Support/resistance levels are used to form a signal, while a number of built-in indicators are applied to sort out incoming signals. An arrow appears during a signal formation. If the signal is active, then the arrow remains after the close of the bar; if the signal is not strong enough, the arrow disappears. With a small number of signals and a small trading time, you will not need to sit all day at the computer, especially since you can enable
Limitless MT4は、すべての初心者と経験豊富なトレーダーに適したユニバーサルインジケーターです。 すべての通貨ペア、暗号通貨、生の株式で動作します 無制限のMT4-構成済みで、追加の構成は不要 そして今、主なもの なぜ無制限のMT4なのか? 1再描画の完全な欠如 2トレーディングの最高のスペシャリストによる2年間のテスト 3正しい信号の精度が80%を超える 4ニュースリリース中の取引で好調 取引ルール 1買いシグナル-青い上向き矢印の出現 下向きの赤い矢印の外観を販売するシグナル シグナル後の次のローソク足で取引を開始するには2 3テイクプロフィット チャート上 М1-40ピップ М5-50ピップ М15-55-60ピップ 4ストップロスは利益をとる 5誤った信号をフィルタリングするために、 パラボリックSAR-トレンドとのトレードへの参入を除外する移動平均または同様のトレンドインジケーター。 
スキャルピング矢印は再描画されません -チャート上に価格反転ポイントを示し、そのシグナルを再描画しないインジケーター。また、インジケーターは電子メールとプッシュを介してトレーダーにシグナルを送信します。このインジケーターの信号の精度は、M5タイムフレームで約92〜94%、H1タイムフレームで95%以上です。したがって、この指標により、トレーダーは正確に取引を開始し、さらなる価格変動を予測することができます。チャート上の価格反転ポイントは、すべてのトレーダーに対してシンプルでわかりやすい矢印を使用して示されています。絶え間なく動的な市場の変化を考えると、この指標は過去の相場データを収集し、数学モデルを使用して学習することができます。 インジケーターはシグナルを再描画しません。 インジケーターは、M1からD1までの時間枠で機能します 重要! このインジケーターを購入すると、リンク https://www.mql5.com/ru/market/product/69755で最高の自動ボットの1つをギフトとして受け取ることができます 。 。 スキャルピング矢印がインジケーターを再描画しないこと
Impulse fractals indicator - is counter-trend oriented complex market fractal pattern.  Market creates bull/bear impulse, trend starts, fractals on impulsed wave are an agressive pullback signals. Buy arrow is plotted when market is bearish and it's impulse showed up-side fractal, and sell arrow is plotted when market is bullish and it's impulse showed dn-side fractal. Main indicator's adjustable inputs : impulsePeriod - main period of impulse histogram  filterPeriod  - smoothes impulse accordi
Trend surfer is indicator based on volume calculation in combination with algorithm that recognize trend changes . For aditional filtering, user can choose from 3 different oscillators, or can use their combination. Basic idea of indicator is to give signal when current volume is above value defined as Volume MA period*Volume MA multiplier, and trend change algorithm detects start of new trend wave. When all conditions are met and new trend wave is detected, indicator plot arrow on chart. Arrows
This product works by detecting trend opportunities. So as shown in the screenshot when The indicator shows an upward arrow it shows the market is on an uptrend and when the indicator Shows a downward arrow it shows the market is on a downward direction. What makes this indicator Special is that it has additional signals just below the arrow signals. It is up to the trader to be  Creative and combine these signals with the arrow signal to get accurate forecasts.
Smart Reversal Signal  is a professional indicator for the MetaTrader 4 platform; it has been developed by a group of professional traders. This indicator is designed for Forex and binary options trading. By purchasing this indicator, you will receive: Excellent indicator signals. Free product support. Regular updates. Various notification options: alert, push, emails. You can use it on any financial instrument (Forex, CFD, options) and timeframe. Indicator Parameters Perod - indicator calculat
Индикатор канала с адаптивной шириной, который помогает видеть перекупленность/перепроданность , пробои границ и даёт стрелочные сигналы Buy/Sell с аккуратными оповещениями без спама . Индикатор подходит для: скальпинга и внутридневной торговли; поиска точек отката от границ канала; торговли пробоев (breakout) и возвратов (re-entry); ручной торговли и полуавтоматизации через алерты. Как работает индикатор Сглаживание (Nadaraya-Watson) Строится “умная” сглаженная линия цены (ядровая регрессия с
Top Bottom Scalper (MT4 Indicator) A specialized MT4 tool engineered to pinpoint ultra‑accurate market Tops and Bottoms — perfect for forex scalping and binary options traders who demand precision and timing. The Top Bottom Scalper identifies major reversal points with exceptional accuracy and strengthens those signals using dynamic Support & Resistance zones of varying quality. Whether you trade quick reversals or fast binary setups, this indicator helps you enter at the exact moment price sh
このインジケーターは実践的なトレードに最適な自動波動分析のインジケーターです! 場合... 注:   Tang Lun (Tang Zhong Shuo Zen) の命名規則の影響で、私は波のグレーディングに西洋の名前を使用することに慣れていません。基本的な波を ペン 、二次波のバンドを セグメント と名付けました。同時に、 セグメント にはトレンドの方向が指定されます (この命名方法は将来のノートで使用されます。最初に言っておきます)。ただし、アルゴリズムは曲がりくねった理論とはほとんど関係がないため、付けるべきではありません。これは、私の市場分析 によって要約された、絶えず変化する複雑な運用ルール を反映しています。 バンドは標準化され、人によって異なることがないよう定義されており、市場参入を厳密に分析する上で重要な役割を果たす人為的な干渉の描画方法が排除されています。 このインジケーターを使用することは、取引インターフェイスの美しさを改善することと同等であり、元の K ライン取引を放棄し、取引の新しいレベルに連れて行きます。また、宣伝の観点から顧客の認識も向上します。 イ
タイトル: ノンリペイント XY トレンドインジケーターの紹介: フォレックスとバイナリオプションで成功するための究極のガイド はじめに: ノンリペイント XY トレンドインジケーターは、複雑で常に変化する金融市場において、トレーダーが情報に基づいた意思決定を行うために設計された革新的な取引ツールです。この高度な MetaTrader 4 (MT4) インジケーターは、リペイントという一般的な問題を排除しながら、驚くほどの精度で価格トレンドを予測するそのユニークな能力により、トレーダーの間で大きな人気を集めています。 インジケーターの理解: ノンリペイント XY トレンドインジケーターを際立たせている重要な機能の一つは、その精度へのこだわりです。過去のシグナルをリペイントし、トレーダーに信頼性の低いデータを残してしまう他の多くのインジケーターとは異なり、このインジケーターは一貫性を保っています。トレーダーは、生成されたシグナルが過去の価格変動を正確に反映していることを知って、安心して取引できます。 XY トレンドインジケーターは、高度なアルゴリズムを使用して価格データを分析し、市場のト
The First Dawn indicator uses a unique mechanism to search and plot signals. This keeps searching for signals, making it a great indicator for scaping and identification of changes in direction, swing trading and trend trading. The  First Dawn   helps you get early signals. The backtest gives the true picture of how the indicator works with real/demo accounts. Although this is a tiny indicator it is packed with advantageous settings that will help you whether you desire to: Snap the Peaks and
MASTER MAは、移動平均クロスベースのインジケータであり、異なる期間の3つの移動平均を使用してシグナルを生成し、戦略は非常にシンプルですが、インジケータには、勝率/総利益などの有用なインスタントバックテスト結果を示す統計ダッシュボードがあります...など、このインジケーターにはポイント単位でTPとSLの入力があるため、TPとSLをTPの緑の点とSLの赤いxの形でチャートに表示することができ、インジケーターはそれらの値を使用して勝敗率を計算します。 この指標は、新しいバーが厳密に開いているときに信号を送ります。信号が再描画されたり遅延したりすることはありません。 推奨事項:m5以上を使用してください...毎日の目標を持つ...インジケーターの期間をいじって、より良い結果を得てください。 パラメーター: 3つの移動平均の期間と種類 アラート TP/SL値は、各シグナルとともにチャートに印刷し、以下に基づいて勝敗を計算します。 ダッシュボードの色と位置の入力 -------------------------------------------------------
「ダイナミック・スキャルピング・オシレーター」は、MT4向けの高度なカスタムCrypto_Forexインジケーターです。効率的な取引ツールです! - 新世代のオシレーター - 使い方は画像をご覧ください。 - ダイナミック・スキャルピング・オシレーターは、適応型の売られ過ぎ/買われ過ぎゾーンを備えています。 - オシレーターは、動的な売られ過ぎ/買われ過ぎエリアから正確なエントリーポイントを見つけるための補助ツールです。 - 売られ過ぎ値:グリーンラインより下、買われ過ぎ値:オレンジラインより上。 - このインジケーターは、プライスアクションパターンと組み合わせるのに最適です。 - 標準的なオシレーターよりもはるかに正確です。 - PCとモバイルの両方でアラート機能付き。 高品質のトレーディングロボットとインジケーターをご覧になるにはここをクリックしてください! これは、このMQL5ウェブサイトでのみ提供されるオリジナル製品です。
ENTRY AND EXIT ARROWS Indicator – Description The Entry and Exit Arrows indicator is a simple yet effective momentum-based tool designed to highlight potential buy and sell opportunities directly on the chart using visual arrows. It works by comparing two internal momentum measurements with different sensitivities. When both measurements align in the same direction, the indicator confirms a stronger directional bias and plots a signal. How It Works Buy Signal (Lime Arrow Below Candle): Appea
BinaryPin
Andrey Spiridonov
3.67 (3)
BinaryPin is an indicator developed and adapted specifically for trading short-term binary options. The indicator's algorithm, before issuing the signal, analyzes many factors, such as market volatility, searches for the PinBar pattern, calculates the probability of success when making a deal. The indicator is set in the usual way. The indicator itself consists of an information window where the name of the trading instrument is displayed, the probability of making a successful transaction, the
FREE
Yawabeh SD Pro –  Professional Supply and Demand Indicator Trade Smarter with Volume-Confirmed Supply/Demand Zones Our institutional-grade algorithm identifies high-probability reversal zones before price reacts, giving you the edge in Forex, Crypto, and Stocks. Key Features Multi-Timeframe Confirmation – View trend strength across multiple timeframes simultaneously – Align your trades with higher timeframe momentum Smart Alert System – Real-time notifications for: – Strong demand/supply zone
Some informations on the chart with the single attachment. RangeBorder Buy Sell (RBBS) Non Repaint Indicator will provide trend line, buy sell arrows,reversal arrows, range channel, order exit area,high average price line and low average price line.All arrows and lines don't repaint and not lagging. Once candle closed it won't  repaint. Reading Indicator: 1. Small Stars , Indicates oversold and overbought with certain logic and price may reverse when this small star triggers. Useful to identify
Fargo does not change its readings, it is a technical indicator in the Forex market without redrawing. It combines several filters to display market entry arrows on the chart. You can note the accuracy and clarity of the signals of this pointer indicator. When a suitable moment for buying appears, the indicator generates a signal exactly at the moment of its appearance and not below or above the current candle. The arrow will be exactly at the price where the signal appears and will not change
Scalping Strategy Having a strategy in the market is one of the main conditions for trading. The presence of various and complicated indicators and tools sometimes makes trading difficult, and the user gets confused after trying various methods and gets stuck in a loss cycle, the result of which is usually clear. This indicator is a simple strategy based on the detection of pivots and short-term trends, which helps you to easily trade in trends. Sometimes a simple but efficient strategy has a be
The Swing Levels Support and Resistance Indicator is a robust tool designed for MetaTrader 5 traders (also available for MT4). It aids in identifying crucial market levels where price direction may change by showcasing: Swing High and Swing Lows across all timeframes Previous Highs and Lows for Day, Week, and Month ICT US Midnight level and Yesterday Midnight Level ICT US Preopen 8:30 AM Level Rounded Levels This indicator features a toggle button, enabling you to display or hide these levels o
Manuscript is a time-tested indicator, many tests have been conducted in its use, I will tell all buyers my recommendations on using forex, cryptocurrency or binary options This indicator gives a signal exactly at the close of the candle of the selected period The arrow does not disappear after the signal, you can set up email notifications I recommend using it on the period H1,H4,daily If you are aware of its work, you will be able to trade in a plus In the future I will give you my recomm
This indicator has a unique support and resistance calculation program, which is a unique trading system. Index characteristics Imagine if you can accurately determine the important trading support and resistance areas and points in advance, how will your trading improve? Based on a unique calculation method, the indicator analyzes the trend, analyzes the current support and resistance, and obtains the current important support resistance and single direction, the calculated stop profit and sto
一言でいうと このインジケーターは RSI と MACD という2人の専門家を1つにまとめたもの です。2つのチャートを別々に見て判断する代わりに、両方が同意したときだけ「買い」または「売り」の矢印を表示します。 矢印は再描画されません 。一度出現すれば、そのまま固定されます。 「コンボ」の意味 通常、トレーダーは RSI(値動きの勢い)と MACD(トレンドの方向)を別々に見ます。しかし両者が矛盾することも多いです。 このインジケーターでは、 両方が同時に同意したときのみシグナル を出します。これにより、多くの偽シグナルが排除されます。 画面で見えるもの 価格チャートとは別のインジケーターウィンドウ 青と赤の矢印 —— そのまま使えるシグナル 拡大表示された MACD ヒストグラム(見やすく強調されている) RSI と MACD のラインも表示されるが、注目すべきは矢印 こんな人におすすめ 初心者 —— 2つのインジケーターを別々に解釈し、矛盾に対処する必要がない 経験者 —— シグナルの高速フィルタリングと、再描画しないクリアなロジック 迷いたくない人 —— 「買い」「売り」「待て
ScalperMulti is a multicurrency indicator for professional traders. The indicator shows the complete market situation for the trader. The main advantage of this indicator is that it simultaneously analyzes six major currency pairs on all timeframes from M1 to MN. The indicator analyzes the trend strength. The indicator generates color-coded signals to visualize the market situation: Green - ascending trend. Red - descending trend. Yellow - trend is not defined. The indicator is excellent for sca
この取引ツールを使用すると、15 の市場を同時にスキャンできます。 新しい取引指標 2024 のご紹介: ️ ダッシュボード マルチ通貨 マルチタイムフレーム 確率的。 私がこの取引ツールを作成した理由は少なくとも 2 つあります。 まず、1 つの市場だけを観察することに飽きました。 次に、別の市場への参入の瞬間を逃したくないです。 だからこそ、他の市況も同時に知りたいのです。 このため、複数の市場の状況を同時にスキャンできるスキャナーが必要です。 私は確率的メインライン > (または <=) 確率的シグナルラインが M1 から H4 (または単に M1 から M30) で始まる市場をよく探します。 私の分析に同意するなら、これがあなたが探していた取引指標です。 市況が上記の要件を満たす瞬間を見逃さないでください。 これは、多くの優れた機能を備えたストキャスティックのスキャナーまたはダッシュボードです。 確率的メインラインのデータを表示可能 確率シグナルラインのデータを表示可能 確率的メインラインとシグナルラインの位置を表示可能(シグナルラインの上のメインライ
Super Trend Double Pro - Includes the classic SuperTrend indicator x2 - Includes two indicators for much better market analysis - Comes with various settings - Comes with a display - Displays statistical win/loss information The "Super Trend Double Pro" indicator provides the ability to combine two of the classic SuperTrend indicators into one, displaying two indicators with different settings on the same chart. The indicator comes with many customizable settings as well as a display which sh
Binary HH 6 インジケーターは、バイナリーオプション取引向けに設計されており、 M1 と M5 タイムフレームで動作します。また、任意の通貨ペアで使用可能です。FX取引にも適しています。 主な特徴: 有効期限: デフォルト設定は1本のローソク足ですが、設定で1~3本に調整可能です。 トレンド分析: トレンドに基づいて動作し、チャート上に矢印としてシグナルを提供します: 青い矢印 – 買いシグナル。 赤い矢印 – 売りシグナル。 アラート: シグナルは現在のローソク足が閉じる前に表示され、外部EAを使用して自動取引を行うことができます。 必須条件: MQL5 フォルダをMT4ターミナルディレクトリにコピーしてください。以下のリンクからダウンロードできます: https ://disk.yandex.ru /d /DPyo0ntaevi_2A 。 インストールガイド動画をご覧ください: https ://youtu.be /Q9RvyKFQ4uA ?si =_q4qaF9jKPnhcj9x 。 シグナル表示時のポップアップ通知には、こちらの追加インジケーターを使用してください:
TrendBand Navigator Pro – Non-Repainting Multi-Timeframe Trading System Powered by proprietary multi-dimensional trend band algorithm delivering clear arrow signals Big Arrows Define Direction Small Arrows Capture Entries   Core Advantages   Intelligent Noise Filtering Volatility-adaptive technology avoids false breakouts, triggers arrows only during strong trends   Multi-Timeframe Compatibility Automatically adapts from 1-minute to monthly charts for all trading strategies   Vis
This indicator is the translated version of Anıl ÖZEKŞİ's MOST Indicator, developed on the Matriks Data Terminal, into the MQL4 language. It is a trend-following indicator and quite successful. Its usage will be free and unlimited for a lifetime. You can click on my profile to access the MQL5 version of this indicator. You can also get your programming requests for MQL4 and MQL5 languages done at İpek Bilgisayar with an invoiced service. You can reach İpek Bilgisayar at www.ipekbilgisayar.org .
FREE
このプロダクトを購入した人は以下も購入しています
Neuro Poseidon is a new indicator by Daria Rezueva. It combines precise trading signals with adaptive TP/SL levels - creating best possible trades as a result! Message me and get  Neuro Poseidon Assistant  as a gift to automize your trading process! What makes it stand out? 1. Proven profitability on all assets and timeframes 2. Only confirmed BUY and SELL signals present on the chart 3. Adaptive TP & SL levels generated by the software for each trade 4. Easy to understand - suitable for all
Gann Made Easy は、ミスター・ギャンの理論を使用した取引の最良の原則に基づいた、プロフェッショナルで使いやすい外国為替取引システムです。 W・D・ガン。このインジケーターは、ストップロスとテイクプロフィットレベルを含む正確な買いと売りのシグナルを提供します。 PUSH通知を利用して外出先でも取引可能です。 ご購入後、取引方法の説明と優れた追加インジケーターを無料で入手するには、私にご連絡ください! おそらく、ギャンの取引手法についてはすでに何度も聞いたことがあるでしょう。通常、ギャンの理論は初心者のトレーダーだけでなく、すでにある程度の取引経験がある人にとっても非常に複雑なものです。なぜなら、ギャンの取引手法は理論的にはそれほど簡単に適用できるものではないからです。私はその知識を磨き、最良の原則を私の外国為替インジケーターに組み込むために数年を費やしました。 このインジケーターは非常に簡単に適用できます。必要なのは、それをチャートに添付し、簡単な取引推奨事項に従うだけです。このインジケーターは常に市場分析の仕事を行い、取引の機会を探します。適切なエントリーポイントを検出す
Trend Catcher ind
Ramil Minniakhmetov
5 (2)
トレンドキャッチャーインジケーター トレンドキャッチャーインジケーターは、開発者独自の適応型トレンド分析指標を組み合わせることで、市場価格の動きを分析します。短期的なノイズを除去し、根底にあるモメンタムの強さ、ボラティリティの拡大、価格構造の挙動に焦点を当てることで、真の市場方向性を特定します。また、移動平均線、RSI、ボラティリティフィルターなどの平滑化およびトレンドフィルタリング機能を備えたカスタマイズ指標も使用します。 実際の運用状況のモニタリングやその他の製品については、こちらをご覧ください: https://www.mql5.com/en/users/mechanic/seller ご注意ください。私はTelegramでEAや設定を販売していません。詐欺です。すべての設定はブログで無料で公開しています。 重要!ご購入後すぐにご連絡ください。手順とボーナスをお送りします!
M1 SNIPER は使いやすいトレーディングインジケーターシステムです。M1時間足向けに設計された矢印インジケーターです。M1時間足でのスキャルピングのためのスタンドアロンシステムとして、また既存のトレーディングシステムの一部としても使用できます。このトレーディングシステムはM1時間足での取引に特化して設計されていますが、他の時間足でも使用できます。元々、この手法はXAUUSDとBTCUSDの取引用に設計しましたが、他の市場においても役立つと考えています。 インジケーターのシグナルは、トレンドの方向と逆方向に取引できます。インジケーターのシグナルを利用して両方向に取引するのに役立つ特別な取引テクニックをご紹介します。この手法は、特別な動的なサポートとレジスタンスの価格帯を利用することに基づいています。 ご購入後、M1 SNIPER矢印インジケーターをすぐにダウンロードできます。さらに、M1 SNIPERツールのすべてのユーザーに、以下のスクリーンショットに表示されているApollo Dynamic SRインジケーターを無料で提供しています。この2つのインジケーターを組み合わせることで
Advanced Supply Demand
Bernhard Schweigert
4.91 (300)
現在30%オフ 初心者にもエキスパートトレーダーにも最適なソリューション このインジケーターは独自の機能と新しい公式を多数内蔵しており、ユニークで高品質かつ手頃な取引ツールです。このアップデートでは、2つの時間枠ゾーンを表示できるようになります。より長いTFだけでなく、チャートTFとより長いTF(ネストゾーンを表示)の両方を表示できます。すべてのSupply Demandトレーダーの皆さんのお気に召すはずです。:) 重要情報の公開 Advanced Supply Demandの可能性を最大化するには、 https://www.mql5.com/ja/blogs/post/720245 にアクセスしてください。   エントリーまたはターゲットの正確なトリガーポイントを正確に特定できれば取引がどのように改善されるか想像してみてください。新しい基盤となるアルゴリズムに基づいて構築されているため、買い手と売り手の間の潜在的な不均衡をさらに簡単に特定できます。これは、最も強い需要と供給のゾーンと、過去のパフォーマンス(古いゾーンを表示)がグラフィカルに表現されるためです。これらの機能は、最適な
Scalper Inside PRO Scalper Inside PRO は、MetaTrader 4 向けの短期トレンドおよびスキャルピング用インジケーターです。独自アルゴリズムを用いて、市場の方向性と主要なターゲットレベルを素早く検出します。エントリー、イグジット、複数の利確ターゲットを自動計算し、詳細なパフォーマンス統計を表示することで、さまざまな銘柄やストラテジーがどのように機能してきたかを確認できます。これにより、現在のマーケットコンディションに最も適した取引銘柄を選択するのに役立ちます。さらに、Scalper Inside PRO には、お使いの矢印インジケーターを簡単に接続でき、その統計と過去のパフォーマンスを素早く評価できます。 本インジケーターは、あらゆる銘柄と時間足で動作し(短期トレードには M5 を推奨)、複数の内蔵ストラテジーを備えています。そのため、単体のスキャルピングツールとしても、トレーディングシステム内の強力な分析コンポーネントとしても活用できます。 主な機能 独自アルゴリズム(Next‑Generation Trend Detection Algor
Current event:  https://c.mql5.com/1/326/A2SR2025_NoMusic.gif A. A2SR とは何ですか ?   * 先行テクニカル指標です (塗り直しなし、ラグなし)。 -- ガイダンス : -- https://www.mql5.com/en/blogs/post/734748/page4#comment_16532516 -- そして https://www.mql5.com/en/users/yohana/blog A2SR には、サポート (需要) とレジスタンス (供給) のレベルを決定する特別な手法があります。 ネットで見かける通常の方法とは異なり、A2SR は実際の SR レベルを決定する独自のコンセプトを持っています。 元の手法はインターネットから取得されたものではなく、インターネット上で公開されたこともありません。 A2SR は、取引スタイルに応じて SR レベルを自動選択します。 時間枠を変更しても、SR レベルはその位置にとどまります。 実際のSRは、使用する時間枠から取得されるわけではないため. A2SR
MetaBands M4
Vahidreza Heidar Gholami
3.5 (6)
MetaBandsは、強力でユニークなアルゴリズムを使用してチャンネルを描画し、トレンドを検出して、トレーダーに取引の入出ポイントを提供することができます。チャンネル指標に加えて、強力なトレンド指標でもあります。入力パラメータを使用して新しいチャンネルを作成するために、異なるタイプのチャンネルを統合することができます。MetaBandsは、市場のイベントについてユーザーに通知するために、すべてのタイプのアラートを使用します。 特徴 ほとんどのチャンネルアルゴリズムをサポート 強力なトレンド検出アルゴリズム 異なるタイプのチャンネルを統合する能力 マルチタイムフレームおよびマルチカレンシー(シグナルマトリックス) すべてのタイプのアラート機能(サウンド、画面フラッシャー、プッシュ通知、メール、ポップアップ、矢印) 再描画しない トレンド検出 MetaBandsは、チャネル内を振動する青いラインを使用してトレンドを検出します。ラインがチャネルの上部バンドに達すると、下降トレンドの開始を示し、下部バンドに達すると上昇トレンドの開始を示します。青いラインが中心ラインに近づくと、市場はコンソリ
Genesis Matrix Pro is a professional multi-timeframe trend detection indicator designed to help traders identify high-quality market alignment with clarity and structure. It combines 12 different technical indicators into one visual alignment matrix, allowing traders to quickly see when market conditions are bullish, bearish, or neutral. A signal is generated only when the selected strategies are aligned, helping reduce noise and improve decision-making. PLEASE CONTACT ME AFTER PURCHASE TO GET
この製品は 2026 年の市場向けに更新され、最新の MT5 ビルドに最適化されています。 価格更新のお知らせ: Smart Trend Trading System は現在 $99 で提供されています。 次の 30 件の購入 後、価格は $199 に上がります。 特別オファー: Smart Trend Trading System を購入後、私にプライベートメッセージを送ることで、 Smart Universal EA を無料 で受け取り、Smart Trend のシグナルを自動売買に変えることができます。 Smart Trend Trading System は、リペイントなし、再描画なし、遅延なしの完全なトレーディングシステムです。よりクリーンなシグナル、より明確なトレンド方向、そしてより整理された取引方法を求めるトレーダー向けに作られています。 Online course , manual and download presets . このシステムは、トレンド検出、反転ゾーン、Smart Cloud、トレーリングストップロジック、サポートとレジスタンス、ローソク足の色分け、ア
Dynamic Forex28 Navigator - 次世代の Forex 取引ツール。 現在 49% オフ。 Dynamic Forex28 Navigator は、長年人気のインジケーターを進化させたもので、3 つの機能を 1 つにまとめています。 Advanced Currency Strength28 インジケーター (レビュー 695 件)  + Advanced Currency IMPULSE with ALERT (レビュー 520 件) + CS28 コンボ シグナル (ボーナス)。 インジケーターの詳細 https://www.mql5.com/en/blogs/post/758844 次世代の Strength インジケーターが提供するもの  オリジナルで気に入っていたすべての機能が、新機能と精度の向上によって強化されました。 主な機能: 独自の通貨強度計算式。 すべての時間枠でスムーズかつ正確な強度ライン。 トレンドの特定と正確なエントリーに最適です。 ダイナミックマーケットフィボナッチレベル (マーケットフィボナッチ)。 このインジケーターに固有
Trend Breakout Arrows Indicator The Trend Breakout Arrows Indicator is a momentum-based signal tool designed to identify potential bullish and bearish breakout opportunities. It displays clear arrow signals directly on the price chart, helping traders quickly recognize possible trend changes and continuation setups. Up Arrow (Buy Signal) A magenta up arrow appears below a candle when bullish momentum begins to strengthen. This signal indicates that buying pressure may be overtaking selling press
BTMM State Engine Pro is a MetaTrader 4 indicator for traders who use the Beat The Market Maker approach: Asian session context, kill zone timing, level progression, peak formation detection, and a multi-pair scanner from a single chart. It combines cycle state logic with a built-in scanner dashboard so you do not need the same tool on many charts at once. What it does Draws the Asian session range; session times can follow broker server offset or be set in inputs. Tracks level progression (L
IQ FX Gann Levels a precision trading indicator based on W.D. Gann’s square root methods . It plots real-time, non-repainting support and resistance levels to help traders confidently spot intraday and scalping opportunities with high accuracy. William Delbert Gann (W.D. Gann) was an exceptional market analyst, whose trading technique was based on a complex blend of mathematics, geometry, astrology, and ancient mathematics which proved to be extremely accurate. Setup & Guide:  Download  MT5 Ver
Price & Time Market Structure Indicator A professional market structure tool that analyzes waves through both price and time — not price alone. Main Description NeoWave PRO is a professional market structure indicator for MetaTrader 4 designed for traders who want to move beyond traditional one-dimensional wave tools such as ZigZag, swing indicators, and basic high/low systems. Most wave indicators analyze only one thing: Price. But a real market wave is not only a price movement. A true wave de
PRO Renko Systemは、特別にRENKOチャートを取引するために設計された高精度の取引システムです。 これは、様々な取引商品に適用することができる普遍的なシステムです。 システムは効果的に正確な逆転信号へのアクセスを与えるいわゆる市場の騒音を中和する。 表示器は非常に使いやすく、信号の生成に責任がある1つの変数だけがあります。 あなたは簡単にお好みの任意の取引ツールとレンコバーのサイズにツールを適応させることができます。 私はいつもあなたが私のソフトウェアで収益性の高い取引を支援するために余分なサポートを提供する準備ができています! 私はあなたに幸せで収益性の高い取引をしたいです! ご購入後にご連絡ください! 私はあなたに私のレンコチャートジェネレータを送信します。 私はまた、私の個人的な推奨事項やシステムの他のモジュールを無料で共有します!
GOLD Impulse with Alert
Bernhard Schweigert
4.67 (12)
このインディケータは、当社の2つの製品 Advanced Currency IMPULSE with ALERT  +   Currency Strength Exotics . のスーパーコンビネーションです。 このインジケーターは全ての時間枠で作動し、8つの主要通貨と1つのシンボルの強弱のインパルスをグラフで表示します。 このインジケータは、金、エキゾチックペア、商品、インデックス、先物など、あらゆるシンボルの通貨強度の加速度を表示することに特化されています。金、銀、原油、DAX、US30、MXN、TRY、CNHなどの通貨強度の加速度(インパルスまたは速度)を表示するために、任意のシンボルを9行目に追加できる、この種の最初のものです。 新しいアルゴリズムに基づいて構築され、潜在的な取引の特定と確認がさらに容易になりました。これは、通貨の強さや弱さが加速しているかどうかをグラフィカルに表示し、その加速の速度を測定するためです。加速すると物事は明らかに速く進みますが、これはFX市場でも同じです。つまり、反対方向に加速している通貨をペアリングすれば、潜在的に利益を生む取引を特定
Market Structure Order Block Dashboard MT4 は、市場構造と価格の主要な反応ゾーンをチャート上で直接読み取りたいトレーダーのために設計された MetaTrader 4 用インジケーターです。BOS、ChoCH、Order Blocks、Fair Value Gaps (FVG)、流動性、Kill Zones、Volume Profile、そして素早い分析のためのコンパクトなダッシュボードを統合しています。 このインジケーターは、市場構造、ICT および Smart Money の概念を意思決定の枠組みとして使用するトレーダーを対象としています。トレンド継続、潜在的反転、価格不均衡、流動性ターゲット、関心ゾーンをより構造的に把握するのに役立ちます。 購入者向けリソース 購入後に MQL5 プライベートメッセージで簡単にリクエストするだけで、完全な PDF ユーザーガイドとパラメーター設定のヒントが入手可能です。MQL5 プライベートメッセージで直接技術サポートを提供します。 この MT4 バージョンは MT5 バージョン 1.20 のすべての機能を
MT5版もご用意しています https://www.mql5.com/ja/market/product/170916 M30/H1/H4スイング版もあります M5/M15では取りきれない大きな波を狙いたい方へ。 Gold Signal Swing Pro(M30/H1/H4対応)を販売中。 1トレードで$20〜$80+の値幅を狙う。 https://www.mql5.com/en/market/product/177643 KURAMA GOLD SIGNAL PRO(MT4版)— 7層フィルター・自動TP/SL・品質スコア搭載 XAUUSD完全トレードシステム リペイントなし。リドローなし。ラグなし。すべてのサインは確定後に変わりません。見たままが結果です。 特典:買い切りライセンスをご購入いただいた方に、AI Zone Radar($59相当)+PDFマニュアルを無料プレゼント。購入後にMQL5でメッセージをお送りください
123パターン は、最も人気のある強力で柔軟なチャートパターンの1つです。このパターンは、3つの価格ポイントで構成されています。ボトム、ピークまたはバレー、および38.2%〜71.8%のフィボナッチリトレースメントです。パターンは、価格が最後のピークまたは谷、インディケーターが矢印をプロットし、アラートを上昇させ、取引を行うことができる瞬間を超えたときに有効と見なされます。 [ インストールガイド | 更新ガイド | トラブルシューティング | よくある質問 | すべての製品 ] クリアな取引シグナル カスタマイズ可能な色とサイズ パフォーマンス統計を実装します カスタマイズ可能なフィボナッチリトレースメントレベル 適切なストップロスおよび利益レベルを表示します インジケーターを使用して、継続パターンまたは反転パターンを見つけることができます 再描画および非再描画ではありません 電子メール/音声/視覚アラートを実装します 123パターン は、継続パターンまたは反転パターンとして現れます。物事を簡単にするために、このインジケーターを使用して、検索するパターンのタイプを選択できるため
Enigmera
Ivan Stefanov
5 (8)
ENIGMERA: 市場の中心 重要:MQL5.comのデモはStrategy Testerで実行されており、Enigmeraの機能を完全には反映していない場合があります。詳細については、説明、スクリーンショット、ビデオをご確認ください。質問があれば、遠慮なくメッセージを送ってください! インジケーターのコードは完全に書き直されました。バージョン3.0は新機能を追加し、インジケーターの開始以来蓄積されたバグを修正しました。 紹介 このインジケーターとトレーディングシステムは、金融市場への注目すべきアプローチです。ENIGMERAはフラクタルサイクルを使用して、サポートとレジスタンスのレベルを正確に計算します。真の蓄積フェーズを示し、方向と目標を提供します。トレンドでも修正でも機能するシステムです。 動作方法 インジケーターのほとんどの機能は、チャートの左側にあるボタンで制御され、市場の状況に迅速に対応できるようになっています。 ボタン ON/OFF – インジケーター全体を表示または非表示にします。 Channel – サポートチャネルを有効にし、許容範囲の偏差を示します。 Dev
Introduction Harmonic Patterns are best used to predict potential turning point. Traditionally, Harmonic Pattern was identified manually connecting peaks and troughs points in the chart. Manual harmonic pattern detection is painfully tedious and not suitable for everyone. You are often exposed under subjective pattern identification with manual pattern detection. To avoid these limitations, Harmonic Pattern Plus was designed to automate your harmonic pattern detection process. The functionality
地震計マーケット クエイク検出器。 Description in English : https://www.mql5.com/en/market/product/113869?source=Site+Market+Product+Page#description How to use the Seismograph : https://www.mql5.com/en/market/product/113869#!tab=comments&page=2&comment=52806941 Create an EA : https://www.mql5.com/en/market/product/113869#!tab=comments&page=3&comment=52816509 どのような取引方法であれ、流動性の低い市場への参入は避けたいものです。 地震計は、市場が上昇する前に市場に参入する適切なタイミングに役立ちます。 しかし、忙しいはずの市場時間帯にエントリーするようにしたにもかかわらず、流動性の低い市場に閉じ込められてしまう人が多いのが実情です。 数時間待った後、
Scalper Vault は、スキャルピングを成功させるために必要なすべてを提供するプロフェッショナルなスキャルピング システムです。このインジケーターは、外国為替およびバイナリー オプションのトレーダーが使用できる完全な取引システムです。推奨される時間枠は M5 です。 システムは、トレンドの方向に正確な矢印シグナルを提供します。また、トップとボトムのシグナルとギャン マーケット レベルも提供します。 インジケーターは、プッシュ通知を含むすべてのタイプのアラートを提供します。 インジケータの購入後にご連絡ください。私の個人的な取引の推奨事項と素晴らしいボーナス指標を無料で共有します! 幸せで有益な取引をお祈りします!
Delta Fusion Pro – 日中取引のための高度なオーダーフロー分析 Delta Fusion Pro は MetaTrader 4 用のプロフェッショナル指標で、アグレッシブな注文フローを明らかにし、機関投資家の圧力の強度と方向をリアルタイムで表示します。従来のボリューム指標とは異なり、Ask と Bid のボリューム差(デルタ)を分析し、反転の予測、トレンドの確認、プロフェッショナルな関心ゾーンの特定を可能にします。 主な特徴 インテリジェント自動調整システム 以下に基づき、すべてのパラメータを自動調整: 銘柄タイプ(FX、暗号資産、指数、コモディティ、株式) 運用タイムフレーム 市場のボラティリティ(ATR) 最近の平均ボリューム 初心者トレーダー向けに手動設定不要 — インジケーターが自動でキャリブレーション! 機能概要 NetDelta と累積デルタ Ask/Bid のアグレッシブボリューム差を計算、カスタマイズ可能な EMA スムージング リアルタイムで方向性圧力を表示 ヒストグラムの色をカスタマイズ(買い/売り) 価格/ボリュームのダイバージェンス 通常お
トレンドラインプロ   市場の真の方向転換点を理解するのに役立ちます。この指標は、真のトレンド反転と主要プレーヤーが再び参入するポイントを示します。 分かりますか     BOSライン   複雑な設定や不要なノイズなしに、より長い時間足でのトレンドの変化と重要なレベルを把握できます。シグナルは再描画されず、バーが閉じた後もチャート上に残ります。 VERSION MT 5     -     RFI LEVELS PRO インジケーター と組み合わせることで、その潜在能力を最大限に発揮します。 インジケーターが示す内容: 本当の変化   トレンド(BOSライン) 一度シグナルが現れたら、それは有効です!これは、リペイント機能を持つインジケーターとの重要な違いです。リペイント機能を持つインジケーターは、シグナルを発した後、それを変更し、資金の損失につながる可能性があります。これにより、より高い確率と精度で市場に参入できます。また、矢印が現れた後、目標値(利益確定)に達するか、反転シグナルが現れるまで、ローソク足の色を変更する機能もあります。 繰り返しエントリ       主要プレーヤーの
The Propfolio Master Suite is the ultimate all-in-one analytical workstation for professional traders. Combining the power of the Beat The Market Maker (BTMM) methodology, Smart Money Concepts (SND/Liquidity), and Advanced Volume Profile, this suite replaces multiple different indicators with one optimized engine. Monitor up to 14 pairs simultaneously from a single chart, instantly identify market cycles, and seamlessly map institutional footprints with the click of a button. The Command Center
このインジケーターは、反転ポイントと価格戻りゾーンを正確に表示します。     主要プレーヤー 。新たなトレンドが形成される場所を把握し、最大限の精度で意思決定を行い、すべての取引をコントロールします。 TREND LINES PRO インジケーターと組み合わせることで、その潜在能力を最大限に発揮します。 VERSION MT5 インジケーターが示す内容: 新しいトレンドの始まりに活性化する反転構造と反転レベル。 リスクと報酬の比率を最小限に抑えた利益 確定 と 損失停止の レベルの表示     RR 1:2   。 インテリジェントな削減ロジックによるストップロス。 指定されたインジケーターから 2 つのトレンド タイプの反転パターンを表示します。 指標: トレンドを追う   TREND LINES PRO   (世界的なトレンドの変化) TREND PRO   (クイックトレンド変更) シンプルで効果的   スキャナー   リアルタイムトレンド(新機能)。 マルチタイムフレームのインストゥルメント フィルタリング。 画面   利益     LOGIC AI信号の後。 当日プラス方
現在40%オフ! 初心者やエキスパートトレーダーに最適なソリューション! このインジケータは、独自の機能と秘密の数式を組み込んだ、ユニークで高品質かつ手頃な価格のトレーディングツールです。たった1枚のチャートで28の通貨ペアのアラートを表示します。新しいトレンドやスキャルピングチャンスの引き金となるポイントを正確に把握することができるので、あなたのトレードがどのように改善されるか想像してみてください! 新しい基本的なアルゴリズムに基づいて構築されているため、潜在的な取引の特定と確認がより簡単になります。これは、通貨の強さや弱さが加速しているかどうかをグラフィカルに表示し、その加速のスピードを測定するためです。加速すると物事は明らかに速く進みますが、これはFX市場でも同じです。つまり、反対方向に加速している通貨をペアにすれば、利益を生む可能性のある取引を特定することができるのです。 通貨の勢いを示す縦の線と矢印は、あなたの取引の指針となるでしょう。 ダイナミックマーケットフィボナッチ23レベルはアラートトリガーとして使用され、市場の動きに適応します。もしインパルスが黄色のトリガ
IQ FX Strength  answers the single most important question in trading: "Who is truly driving the market right now?" Designed with a stunning Hybrid UI, this tool separates true trend moves from market noise, allowing you to catch "Explosive" moves before the crowd sees them. System Requirement: For higher accurate signal and optimal, smoother performance of this indicator without any lag, a good CPU (with   RAM of  atleast 8GB or above) and fast internet connection is highly recommended. IQ FX
作者のその他のプロダクト
This EA is designed to monitor the slippage of opening and closing orders, and save the records in csv file. It is useful to record the slippage and evaluate brokers. The record files are saved in the folder  MT5_Data_Folder\MQL5\Files.  Go to   "File " --> "Open Data Folder"   . Warning :   Do NOT open the files directly, otherwise it will affect the exectution of EA, just copy them to another folder and open them. Usage: Open a chart and load the EA on it, just need only one EA to run, it mo
FREE
インジケーターには 2 つの部分が含まれています。 パート I: カラーキャンドルが主要なトレンドを示す カラーローソク足とは、ローソク足の色で相場の状態を識別することです。 スクリーンショットに示されているように、色がアクアの場合、市場はロング注文を発注するか、ショート注文を終了する必要がある状態です。色がトマトの場合は、ショート注文を行うか、ロング注文を終了する時期です。 色が変化している場合は、その完了を (現在のバーが閉じるまで) 待つことをお勧めします。 パート II: バンドを描く 内側のバンドは安全領域として定義され、外側のバンドはクローズオーダー用です。 以下のような取引戦略: 色がアクアで、価格が内側のバンド内にある場合は、ロング注文を出します。価格が外側のバンドを超えたら、注文を閉じる時期です。 色がトマトで、価格が内側のバンドにある場合は、ショート注文を出します。価格が外側のバンドを越えたら、注文を閉じる時期です。 注:価格が内側のバンドの場合のみエントリーマーケットです。これは非常に重要です。 入力パラメータ ShowColorCandle
このアドバイザーは次の機能を提供します。 ポジションをオープンする: 価格がトレンドラインを超えたら、ロング注文またはショートオーダーをオープンします。 クローズ: 価格がトレンドラインを超えたら、ロングポジションまたはショートポジションをクローズします。 トレーリングストップロス – EA はトレンドラインに沿って、ロング注文のストップロスを増加させたり、ショート注文のストップロスを減少させ続けます。 ラインはトレンドラインでも水平線でも構いません。     傾向線は半径または線分にすることができます。線分には、その線が存在する期間のみ取引するという特別な機能があります。 ポジションをオープンおよびクローズできるこれらのラインには、特定の名前が付いています。 EA では、手動で線を描画する代わりに、線描画パネルを提供します。 すべてのオープンポジションとクローズポジションのスクリーンショットは、MQL5/Files/Cross Trend Line to Trade フォルダーに保存されます。 EA はヘッジ口座でのみ機能します バージョンMT4 :   https://www.m
This indicator shows the main trend on the current chart. Features This indicator includes two bands, one is the inner white bands, another is the outer blue bands. If the white dotted line crosses down the white solid line, this means that the trend has changed to be bearish. If the white dotted line crosses up the white solid line, this means that the trend has changed to be bullish. Once the crossing happened, it will not repaint. Settings ShowColorCandle: if 'true', it will show the color
This EA is designed to monitor the slippage of opening and closing orders, and save the records in files. It is useful to record the slippage and evaluate brokers. The record files are saved in the folder  MT4_Data_Folder\MQL4\Files.  Go to "File " --> "Open Data Folder" . Warning : Do NOT open the files directly, otherwise it will affect the exectution of EA, just copy them to another folder and open them. Usage: Open a chart and load the EA on it, just need only one EA to run, it monitors al
FREE
This is a MetaTrader 5 script. It helps to summarize all trades into every symbol. Input Select Period: This is 7-option input. It includes Last Month, This Month, Last Week, This Week, Today, All History, and Date Specified. Specify Starting Date: Enter a date if you selected Date Specified in "Select Period" input. Specify Ending Date: Enter a date if you selected Date Specified in "Select Period" input. The summary is saved into a file in MQL5\Files folder. MT4 Version:   https://www.mql5.co
FREE
This is a MetaTrader 4 script. It helps to summarize all trades into every symbol. Input Select Period: This is 7-option input. It includes Last Month, This Month, Last Week, This Week, Today, All History, and Date Specified. Specify Starting Date: Enter a date if you selected Date Specified in "Select Period" input. Specify Ending Date: Enter a date if you selected Date Specified in "Select Period" input. The summary is saved into a file in MQL4\Files folder. Also, there is pop-up window for a
FREE
This is a MetaTrader 4 script. It helps to export all trades into a CSV file as per Symbol and selected periods. Input Select Symbol: This is 2-option input. Select current symbol or all symbols to export its orders. Select Period: This is 7-option input. It includes Last Month, This Month, Last Week, This Week, Today, All History, and Date Specified. Specify Starting Date: Enter a date if you selected Date Specified in "Select Period" input. Specify Ending Date: Enter a date if you selected Da
FREE
このアドバイザーは次の機能を提供します。 ポジションをオープンする: 価格がトレンドラインを超えたら、ロング注文またはショートオーダーをオープンします。 クローズ: 価格がトレンドラインを超えたら、ロングポジションまたはショートポジションをクローズします。 トレーリングストップロス – EA はトレンドラインに沿って、ロング注文のストップロスを増加させたり、ショート注文のストップロスを減少させ続けます。 ラインはトレンドラインでも水平線でも構いません。     傾向線は半径または線分にすることができます。線分には、その線が存在する期間のみ取引するという特別な機能があります。 ポジションをオープンおよびクローズできるこれらのラインには、特定の名前が付いています。 EA では、手動で線を描画する代わりに、線描画パネルを提供します。 すべてのオープンポジションとクローズポジションのスクリーンショットは、MQL4/Files/Cross Trend Line to Trade フォルダーに保存されます。 EAは以下で使用できます 戦略 試着室。支払う前にストラテジーテスターで試してみてください
インジケーターには 2 つの部分が含まれています。 パート I: カラーキャンドルが主要なトレンドを示す カラーローソク足とは、ローソク足の色で相場の状態を識別することです。 スクリーンショットに示されているように、色がアクアの場合、市場はロング注文を発注するか、ショート注文を終了する必要がある状態です。色がトマトの場合は、ショート注文を行うか、ロング注文を終了する時期です。 色が変化している場合は、その完了を (現在のバーが閉じるまで) 待つことをお勧めします。 パート II: バンドを描く 内側のバンドは安全領域として定義され、外側のバンドはクローズオーダー用です。 以下のような取引戦略: 色がアクアで、価格が内側のバンド内にある場合は、ロング注文を出します。価格が外側のバンドを超えたら、注文を閉じる時期です。 色がトマトで、価格が内側のバンドにある場合は、ショート注文を出します。価格が外側のバンドを越えたら、注文を閉じる時期です。 注:価格が内側のバンドの場合のみエントリーマーケットです。これは非常に重要です。 入力パラメータ ShowColorCandle
このパネルはエキスパートアドバイザーであり、6 つのグループの取引パネルを提供します。 MT5 バージョン:   クイックパネルカバレッジ 特徴 ほとんどの取引操作は、これらのパネルのボタンをクリックすることで迅速に実行できます。 パネルの変更は緑色のボタンをクリックするだけで簡単に行えます。 EA はストラテジー テスターの視覚的なチャート上で実行でき、履歴データに基づいて取引を練習する簡単な方法を提供します。 マウスをクリックしてストップロスとテイクプロフィットを素早く変更します(バックテストには使用できません) 背景が黄色のパネルに平均価格を表示し、平均価格の線を描きます。       ここをクリック パネル ダッシュボードには 2 つの列が含まれています。左の列は売りに関するもので、右の列は買いに関するものです。 売る:     売り注文をオープンします。 初め:     最初の売り注文をクローズします。 1 つ目はオープンタイムを指します。 最後:     最後の売り注文をクローズします。最後のはオープンタイムを指します。 すべて+:     売り注文を利益を上げてクロー
このEAは、柔軟なリスク管理と6セットの取引パネルを統合したプロフェッショナルな取引ツールです。 MT5 バージョン:  Quick Panel Pro Hedging 特徴 バッチの計算はすばやく簡単です。停止線を移動すると、計算はすぐに行われます。 ほとんどの業務操作は、これらのパネルのボタンをクリックするだけですぐに完了できます。 緑色のボタンをクリックするだけで、パネルをすばやく切り替えることができます。 EA はストラテジー テスターで実行できます。この機能を使用して、戦略をトレーニングしたり確認したりできます。 (無料ですので、お試しください)。 マウスをクリックしてストップロスとテイクプロフィットを素早く変更します(バックテストには使用できません) 黄色の背景のパネルに平均価格を表示し、平均価格の線を描きます。       ここをクリック コントロールパネル ダッシュボードは 2 つの列で構成されます。左の列は売りに関するもの、右の列は買いに関するものです。 売り: 売り注文をオープンします。 最初: 最初の売り注文を閉じます。 1つ目は営業時間についてです。 最後に:
この指標は、8 つの主要通貨 (USD、EUR、GBP、AUD、NZD、CAD、CHF、JPY) の相対的な強さを示します。 力の値は 0 ~ 100 の範囲で正規化されます。 60 を超える値は強いことを意味します。 40未満の測定値は衰弱を示します。 基本原則 USD、EUR、GBP、AUD、NZD、CAD、CHF、JPYの8つの通貨ペアがあり、それぞれ2つのペアを組み合わせると合計28のペアになります。逆アルゴリズムを使用して、8つの通貨の強さを抽出します。これらの28のペアのうち EURUSD,GBPUSD,AUDUSD,NZDUSD, USDCAD,USDCHF,USDJPY,EURGBP, EURAUD,EURNZD,EURCAD,EURCHF, EURJPY,GBPAUD,GBPNZD,GBPCAD, GBPCHF,GBPJPY,AUDNZD,AUDCAD, AUDCHF,AUDJPY,NZDCAD,NZDCHF, NZDJPY,CADCHF,CADJPY,CHFJPY 主な用途 強度値が 60 を超えると強いことを意味し、40 未満は弱いことを意味します。 最も強い通貨
このアドバイザーは、複数のペアをワンクリックで取引できるダッシュボードです。 クリック   開ける   選択したペアの注文を開くボタン。 クリック   近い   選択したペアの注文を閉じるボタン。 注文ロットはユーザーが入力した番号です。正の数は買い注文に対応し、負の数は売り注文に対応します。 部分的に閉じるのではなく、注文全体を閉じるには、   「CLOSE」 ボタンをクリックします。クロージングアクションはロット数とは関係ありません。 マジックインプットを 0 に設定すると、アドバイザーが同時に手動注文を閉じるのを手伝ってくれます。 エントリーマジックを別のアドバイザーのマジックで構成すると、アドバイザーは、別のアドバイザーがオープンした注文を同時にクローズするのに役立ちます。 三角生垣   ワンクリックで。 取引シンボルはカスタマイズ可能です。市場観察からインポートするか、ユーザーが入力します。 禁止: Magic - アドバイザーのマジックナンバー。 MaxLots: 最大ロット。ロット数がこのMaxLotsを超える場合、注文ロットはMaxLotsとなります。 StopLo
This indcator shows the trend with the color histogram. It is simple and easy to use. Usage: If the histogram changes from the aqua to the fuchsia, which means the trend is up. If the histogram changes from the fuchsia to the aqua,which means the trend is down. Inputs: MaPeriods: the periods of moving average. f1: the multiplier of inner bands f2: the multiplier of outer bands Popup Window Alert Email Alert Mobile Push Alert Alerts When the trend changes from the long trend to the short trend or
This indicator is designed to show the pair power of the major 28 paris with RSI,Stochostic,and CCI. The power value is sorted from the weak to the strong. The weaker pairs: the pairs occurs at least 2 times in the top 3 rows The stronger pairs:   the pairs occurs at least 2 times in the bottom 3 rows Users can add another symbol, so it can calculate 28+1 symbols. My advice: https://www.mql5.com/en/blogs/post/729880 A free EA with Pair Power Matrix  ---  https://www.mql5.com/en/blogs/post/7328
The purpose of the inidcator is to identify the reversal point. The blue arrow is buy signal and the yellow star is its stop loss. The red arrow is sell signal and the yellow star is its stop loss. Alert feature: if there is a signal, the indicator will send alerts of  popup window,email or mobile push. Inputs: Popup Window Alert: it is false in default Email Alert : it is false in default Mobile Push Alert: it is false in default. MetaTrader 5 Version: Reversal Point Please note that the singal
観察。このコンサルタントはヘッジ口座のみを対象としています。メタトレーダー4のバージョン     Quick Panel Pro 特徴 バッチの計算はすばやく簡単です。停止線を移動すると、計算はすぐに行われます。 ほとんどの業務操作は、これらのパネルのボタンをクリックするだけですぐに完了できます。 緑色のボタンをクリックするだけで、パネルをすばやく切り替えることができます。 マウスをクリックしてストップロスとテイクプロフィットを素早く変更します(バックテストには使用できません) 黄色の背景のパネルに平均価格を表示し、平均価格の線を描きます。       ここをクリック コントロールパネル ダッシュボードは 2 つの列で構成されます。左の列は売りに関するもの、右の列は買いに関するものです。 売り: 売り注文をオープンします。 最初: 最初の売り注文を閉じます。 1つ目は営業時間についてです。 最後に: 最後の売り注文を閉じます。最後のは営業時間についてです。 all+: 利益を伴ってポジションを閉じるための売り注文。 all-: 損失で売り注文をクローズします。 max+: 最大の利
注: この EA はヘッジ口座でのみ機能します。メタトレーダー4のバージョン     クイックパネル このパネルは、6 つのグループの取引パネルを提供するエキスパートアドバイザーです。 特徴 ほとんどの取引操作は、これらのパネルのボタンをクリックすることで迅速に実行できます。 パネル間の切り替えは緑色のボタンをクリックするだけで簡単に行えます。 EA はストラテジー テスターの視覚的なチャート上で実行でき、履歴データを使用して取引を練習する簡単な方法を提供します。 マウスをクリックしてストップロスとテイクプロフィットを素早く変更します(バックテストには使用できません) 背景が黄色のパネルに平均価格を表示し、平均価格の線を描きます。       ここをクリック パネル ダッシュボードには 2 つの列が含まれています。左の列は売りに関するもので、右の列は買いに関するものです。 sell:     販売注文を開きます。 first:     最初の販売注文をクローズします。 1つ目は営業時間についてです。 last:     最後の販売注文を閉じます。最後のは営業時間についてです。 a
Gamma Bands   This indcator shows the trend with the color histogram. It is simple and easy to use. Usage: If the histogram changes from the aqua to the fuchsia, which means the trend is up. If the histogram changes from the fuchsia to the aqua,which means the trend is down. Inputs: MaPeriods: the periods of moving average. f1: the multiplier of inner bands f2: the multiplier of outer bands   Popup Window Alert Email Alert Mobile Push Alert Alerts When the trend changes for the long trend to the
The purpose of the inidcator is to identify the reversal point. The blue arrow is buy signal and the yellow star is its stop loss. The red arrow is sell signal and the yellow star is its stop loss. Please note that the singal is against trend,it could be continual fail. Alert feature: if there is a signal, the indicator will send alerts of  popup window,email or mobile push. Inputs: Popup Window Alert: it is false in default Email Alert : it is false in default Mobile Push Alert: it is false in
このアドバイザーは、複数のペアをワンクリックで取引できるダッシュボードです。 クリック   開ける   選択したペアの注文を開くボタン。 クリック   近い   選択したペアの注文を閉じるボタン。 注文ロットはユーザーが入力した番号です。正の数は買い注文に対応し、負の数は売り注文に対応します。 部分的に閉じるのではなく、注文全体を閉じるには、   「CLOSE」 ボタンをクリックします。クロージングアクションはロット数とは関係ありません。 マジックインプットを 0 に設定すると、アドバイザーが同時に手動注文を閉じるのを手伝ってくれます。 エントリーマジックを別のアドバイザーのマジックで構成すると、アドバイザーは、別のアドバイザーがオープンした注文を同時にクローズするのに役立ちます。 三角生垣   ワンクリックで。 取引シンボルはカスタマイズ可能です。市場観察からインポートするか、ユーザーが入力します。 禁止: Magic - アドバイザーのマジックナンバー。 MaxLots: 最大ロット。ロット数がこのMaxLotsを超える場合、注文ロットはMaxLotsとなります。 StopLo
この指標は、8 つの主要通貨 (USD、EUR、GBP、AUD、NZD、CAD、CHF、JPY) の相対的な強さを示します。 力の値は 0 ~ 100 の範囲で正規化されます。 60 を超える値は強いことを意味します。 40未満の測定値は衰弱を示します。 チケット Only Show Current Pair   -       true の場合、現在のチャート ペアのみが表示されます。それ以外の場合は、8 つの曲線すべてが表示されます。 Bars To Show         - フォース カーブを表示するバーの数。 Ma Periods To Smooth Curves     : 強度曲線を平滑化するための移動平均期間 Suffix       - 文字の接尾辞。今すぐインストールする必要はありません。 Font Size       - 画像のフォント サイズ、デフォルトは 13 Row Space       - 描画線間の間隔、デフォルトは 17 2 つの曲線が交差したときに警告を発するために、次の 3 つの入力が提供されます。 Select Cross at whi
フィルタ:
Jimmy Christianus Hendrikus Janssen
764
Jimmy Christianus Hendrikus Janssen 2025.01.15 19:19 
 

very good indicator

update! i use i for a couple of days now it is a must have tool for traders. so clear and reliabile

Martin Brown
813
Martin Brown 2022.03.04 12:19 
 

ユーザーは評価に対して何もコメントを残しませんでした

Qun Li
579
Qun Li 2019.09.14 21:01 
 

ユーザーは評価に対して何もコメントを残しませんでした

Thomas Fairhurst
1182
Thomas Fairhurst 2019.06.15 10:04 
 

ユーザーは評価に対して何もコメントを残しませんでした

Tim Eubanks
5763
Tim Eubanks 2018.03.13 08:39 
 

ユーザーは評価に対して何もコメントを残しませんでした

philippe germain
2800
philippe germain 2018.03.09 15:35 
 

ユーザーは評価に対して何もコメントを残しませんでした

2458
565
2458 2018.02.27 15:37 
 

ユーザーは評価に対して何もコメントを残しませんでした

rainwalker123
3430
rainwalker123 2018.01.28 11:23 
 

ユーザーは評価に対して何もコメントを残しませんでした

alexsxs72
398
alexsxs72 2018.01.26 09:57 
 

ユーザーは評価に対して何もコメントを残しませんでした

レビューに返信