Signal Moving Average Lux Algo MT4
- インディケータ
-
Lorentzos Roussos
 🎱🏓🎷💚☕️
💎 The simplest Neural Network Coding Guide : https://www.mql5.com/en/blogs/post/752324 - バージョン: 1.0
MT5向けシグナル移動平均 Lux Algo
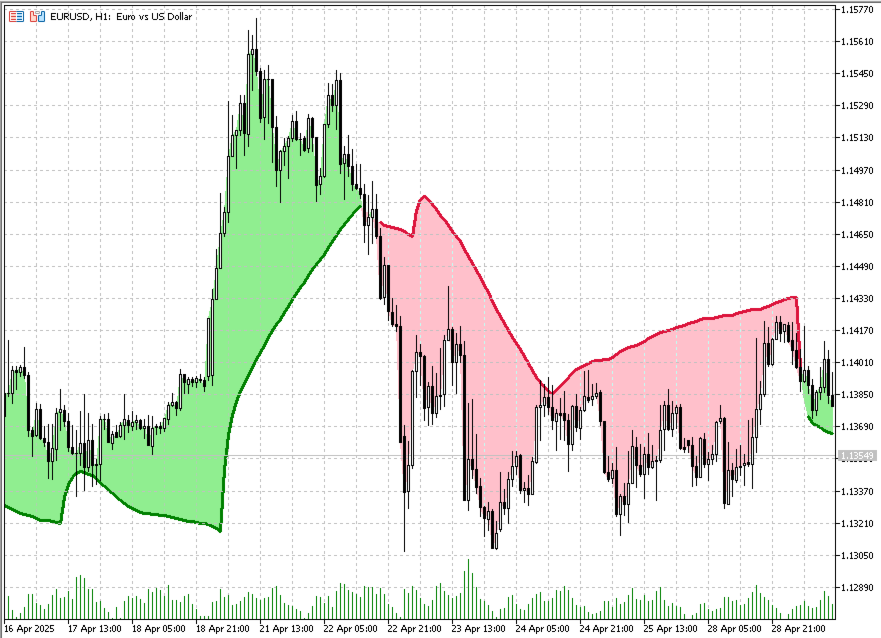
移動平均クロスオーバーシステムにおけるシグナルラインの使用に特化した、独自の移動平均インジケーターをご紹介します。この高度なツールは、レンジ相場では価格から乖離し、トレンド相場では標準移動平均線を忠実に反映することで、他のツールとは一線を画しています。この特性により、トレーダーは市場の変動による不要なノイズや過剰な取引を回避できます。
移動平均線は、レンジ相場では価格から乖離し、トレンド相場では通常の移動平均線の値に達します。
移動平均クロスオーバー戦略では、多くの場合「シグナル」ラインが用いられます。シグナルラインとは、全体的なトレンドを判断するために使用される低速移動平均線です。このシグナルラインは、高速移動平均線と組み合わせることで、通常価格とシグナルラインのクロスによって生じる可能性のある急激な変動を抑制します。
提案されたインジケーターは、より多くのレンジ相場で価格から乖離することで価格のクロスを回避し、価格とシグナルラインのクロス数を効果的に削減します。
価格とシグナルラインの間の領域の色は、シグナルラインに対する価格の位置によって決まります。緑色のインジケーターは、価格がシグナルラインを上回っていることを示します。
ただし、シグナルラインの色は、市場がトレンドかレンジ相場かを考慮しており、トレンド相場に入った場合にのみ変化します。
Lux AlgoによるTrading View用インジケーター(原文ママ)