
戦略ビルダー機能の拡張

目次
はじめに
連載の第1部では、メリルパターンを分析し、価格や価格ベースのオシレータ(ATR、CCI、WPR)などのさまざまなデータ配列に適用しました。この記事の目的は、外国為替およびその他の市場で特定のパターンを使用する見込みを調査および評価することでした。第2部は、前述のパターンを使用して単純な戦略を組み立てるための戦略ビルダーの作成に当てられました。第3部では、戦略の作成とテストの機能を拡張します。テスト結果を表示するための機能だけでなく、ポイントに加えてロットで作業する可能性を追加します。
追加事項の概要
新機能を検討する前に、前の記事を思い出してみましょう。すべてのテストの結果は簡単な要約レポートに表示され、レポートは特定の考慮された金融商品のポイントの損益として表示されました。 ただし、これにより、戦略の潜在的なすべての機能を完全に評価することはできませんでした。したがって、主な目標は、テスター機能を拡張してから、取引レポートのパラメーターを拡張することです。
改善を実装する際には、次の計画に固執します。
- 口座通貨でのInitial deposit(初回入金)。
- 利益計算オプション: [In points](ポイント単位)または[In deposit currency](預金通貨単位)。
- [In deposit currency]が選択されている場合、他の2つの入力フィールド([Lot Type](ロットタイプ)と[Lot Size](ロットサイズ))が表示されます。
- Lot Typeは固定または残高に基づくことができます。
- Lot Sizeは固定ロットタイプで使用可能です。
以下の変更が取引レポートに実装されます。
- Total Net Profit(総純利益) - このパラメータは利益タイプが[In deposit currency]のときのみに使用できます。
- Balance Drawdown Absolute - このパラメータは利益タイプが[In deposit currency]のときのみに使用できます。
- Balance Drawdown Max - このパラメータは利益タイプが[In deposit currency]のときのみに使用できます。
- 短期および長期取引の数に加えて、両方のタイプの勝ち取引の割合が表示されます。
- Strategy profitability - 総利益に対する総損失の比率。
- Recovery factor - このパラメータは利益タイプが[In deposit currency]のときのみに使用できます。
新しいパラメータについて詳しくは、MetaTrader 5ヘルプのテストレポートセクションでご覧ください。上記の機能のプロトタイプを図1に示します。
図1 新しいテストツールのプロトタイプ
その他の新機能は、戦略のテスト結果を視覚的に表示できることです。 つまり、テスト結果のグラフを表示できます。アプリの[Report] (レポート)セクションに[Open graph](グラフを開く)ボタン(図1)を追加します。
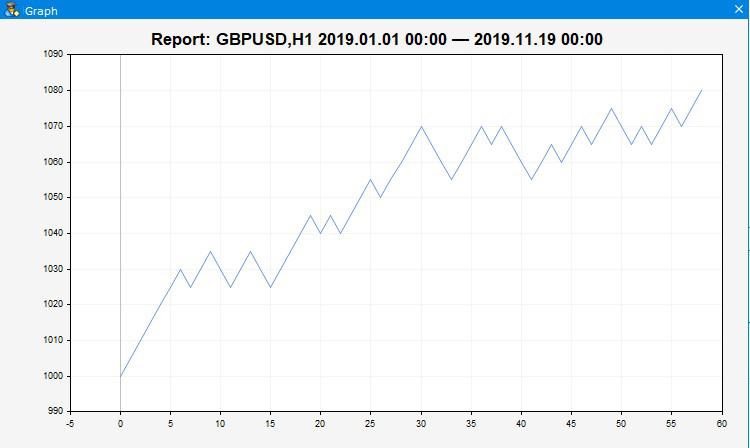
図2 グラフの外観
図2に見られるように、預金移動の性質と取引結果はチャート上で視覚的に評価できます。便宜上、タイトルには、テストされる銘柄、その時間枠、テストが実行される時間間隔が表示されます。
新機能実装のステージ
戦略ビルダーをゼロから開発したときと同様に、主要な要素と実装方法を定義しましょう。CreateGUI()インターフェイスを作成するメインメソッドに2つのメソッドが追加されました。これらのメソッドと、既存のメソッドへの追加を見てみましょう。
//+------------------------------------------------------------------+
//| プログラムのグラフィカルインターフェイスを作成する                   |
//+------------------------------------------------------------------+
bool CProgram::CreateGUI(void)
{
//--- Create a panel
   if(!CreateWindow("Merrill Constructor"))
      return(false);
//--- Create a dialog window
   if(!CreateDateSetting())
      return(false);
//--- Create a chart window
   if(!CreateGraphWindow())
      return(false);
//--- Create a load window
   if(!CreateLoading())
      return(false);
//--- Finish the creation of GUI
   CWndEvents::CompletedGUI();
   return(true);
}
メインウィンドウ作成メソッドCreateWindow()の変更を見てみましょう。図1に示す新しいテスト商品を実装するために、新しいインターフェイス要素が追加されました。
//---- CONSTRUCTOR tab
....
//---
   if(!CreateProfitType(int(0.35*(m_window[0].XSize()-150)-120),50+35*6+ygap))
      return(false);
   if(!CreateLotType(int(0.6*(m_window[0].XSize()-150)-120),50+35*6+ygap))
      return(false);
   if(!CreateBaseLotValue(int(0.85*(m_window[0].XSize()-150)-120),50+35*6+ygap))
      return(false);
   if(!CreateInitialDeposit(int(0.35*(m_window[0].XSize()-150)-120),50+35*7+ygap))
      return(false);
//---
   if(!CreateReportFrame(m_frame[2],int(0.35*(m_window[0].XSize()-150)-120),110+35*7+ygap))
      return(false);
//--- Graph opening button
   if(!CreateIconButton(int(0.35*(m_window[0].XSize()-150)-50),100+35*7+ygap))
      return(false);
//--- Report lines
   for(int i=0; i<11; i++)
   {
      if(i<5)
         if(!CreateTextLabel(m_report_text[i],int(0.37*(m_window[0].XSize()-150)-120),380+25*i+ygap,"",0))
            return(false);
      if(i>=5 && i<9)
         if(!CreateTextLabel(m_report_text[i],int(0.63*(m_window[0].XSize()-150)-120),380+25*(i-5)+ygap,"",0))
            return(false);
      if(i>=9)
         if(!CreateTextLabel(m_report_text[i],int(0.89*(m_window[0].XSize()-150)-120),380+25*(i-9)+ygap,"",0))
            return(false);
      m_report_text[i].IsCenterText(false);
      m_report_text[i].FontSize(10);
   }
....
視覚的な変更は、[Constructor](コンストラクタ)タブでのみ実装されました。完全なタブ実装コードは、添付ファイルと以前の記事で参照できるため、ここでは新しいメソッドのみを示しています。それぞれについて考えてみましょう。
CreateProfitType()メソッドは、テストで使用した利益タイプ(預金通貨またはポイント)のドロップダウンリストを作成します。
//+------------------------------------------------------------------+
//|                                                                  |
//+------------------------------------------------------------------+
bool CProgram::CreateProfitType(const int x_gap,const int y_gap)
{
//--- Pass the object to the panel
   m_profit_type.MainPointer(m_tabs1);
//--- タブに取り付ける
   m_tabs1.AddToElementsArray(0,m_profit_type);
//--- Array of the item values in the list view
   string pattern_names[2]=
   {
      "Pips","Currency"
   };
//--- Set properties before creation
   m_profit_type.XSize(200);
   m_profit_type.YSize(25);
   m_profit_type.ItemsTotal(2);
   m_profit_type.FontSize(12);
   m_profit_type.LabelColor(C'0,100,255');
   m_profit_type.GetButtonPointer().FontSize(10);
   m_profit_type.GetButtonPointer().XGap(80);
   m_profit_type.GetButtonPointer().XSize(100);
   m_profit_type.GetButtonPointer().BackColor(clrAliceBlue);
   m_profit_type.GetListViewPointer().FontSize(10);
   m_profit_type.GetListViewPointer().YSize(44);
//--- Save the item values in the combobox list view
   for(int i=0; i<2; i++)
      m_profit_type.SetValue(i,pattern_names[i]);
//--- Get the list view pointer
   CListView *lv=m_profit_type.GetListViewPointer();
//--- Set the list view properties
   lv.LightsHover(true);
   m_profit_type.SelectItem(1);
//--- コントロールを作成する
   if(!m_profit_type.CreateComboBox("Profit Type",x_gap,y_gap))
      return(false);
//--- オブジェクトグループの共通配列にオブジェクトを追加する
   CWndContainer::AddToElementsArray(0,m_profit_type);
   return(true);
}
CreateLotType(). メソッドは、ロットタイプ(固定または残高に依存)のドロップダウンを作成します。
//+------------------------------------------------------------------+
//|                                                                  |
//+------------------------------------------------------------------+
bool CProgram::CreateLotType(const int x_gap,const int y_gap)
{
//--- Pass the object to the panel
   m_lot_type.MainPointer(m_tabs1);
//--- タブに取り付ける
   m_tabs1.AddToElementsArray(0,m_lot_type);
//--- Array of the item values in the list view
   string pattern_names[2]=
   {
      "Balance","Constant"
   };
//--- Set properties before creation
   m_lot_type.XSize(200);
   m_lot_type.YSize(25);
   m_lot_type.ItemsTotal(2);
   m_lot_type.FontSize(12);
   m_lot_type.LabelColor(C'0,100,255');
   m_lot_type.GetButtonPointer().FontSize(10);
   m_lot_type.GetButtonPointer().XGap(65);
   m_lot_type.GetButtonPointer().XSize(100);
   m_lot_type.GetButtonPointer().BackColor(clrAliceBlue);
   m_lot_type.GetListViewPointer().FontSize(10);
   m_lot_type.GetListViewPointer().YSize(44);
//--- Save the item values in the combobox list view
   for(int i=0; i<2; i++)
      m_lot_type.SetValue(i,pattern_names[i]);
//--- Get the list view pointer
   CListView *lv=m_lot_type.GetListViewPointer();
//--- Set the list view properties
   lv.LightsHover(true);
   m_lot_type.SelectItem(1);
//--- コントロールを作成する
   if(!m_lot_type.CreateComboBox("Lot Type",x_gap,y_gap))
      return(false);
//--- オブジェクトグループの共通配列にオブジェクトを追加する
   CWndContainer::AddToElementsArray(0,m_lot_type);
   return(true);
}
CreateBaseLotValue()メソッドは、ロット値入力フィールドを作成します。
/+------------------------------------------------------------------+
//|                                                                  |
//+------------------------------------------------------------------+
bool CProgram::CreateBaseLotValue(const int x_gap,const int y_gap)
{
//--- メインコントロールへのポインタを保存する
   m_base_lot.MainPointer(m_tabs1);
//--- タブに取り付ける
   m_tabs1.AddToElementsArray(0,m_base_lot);
//--- プロパティ
   m_base_lot.XSize(210);
   m_base_lot.YSize(24);
   m_base_lot.LabelColor(C'0,100,255');
   m_base_lot.FontSize(12);
   m_base_lot.MaxValue(SymbolInfoDouble(Symbol(),SYMBOL_VOLUME_MAX));
   m_base_lot.MinValue(SymbolInfoDouble(Symbol(),SYMBOL_VOLUME_MIN));
   m_base_lot.StepValue(SymbolInfoDouble(Symbol(),SYMBOL_VOLUME_STEP));
   m_base_lot.SetDigits(2);
   m_base_lot.SpinEditMode(true);
   m_base_lot.GetTextBoxPointer().AutoSelectionMode(true);
   m_base_lot.GetTextBoxPointer().XGap(100);
//--- コントロールを作成する
   if(!m_base_lot.CreateTextEdit("Base Lot Size",x_gap,y_gap))
      return(false);
   m_base_lot.SetValue((string)SymbolInfoDouble(Symbol(),SYMBOL_VOLUME_MIN));
//--- オブジェクトグループの共通配列にオブジェクトを追加する
   CWndContainer::AddToElementsArray(0,m_base_lot);
   return(true);
}
CreateInitialDeposit() は、利益—通貨モードでテストするときに、初期預金の入力フィールドを作成します。
//+------------------------------------------------------------------+
//|                                                                  |
//+------------------------------------------------------------------+
bool CProgram::CreateInitialDeposit(const int x_gap,const int y_gap)
{
//--- メインコントロールへのポインタを保存する
   m_init_deposit.MainPointer(m_tabs1);
//--- タブに取り付ける
   m_tabs1.AddToElementsArray(0,m_init_deposit);
//--- プロパティ
   m_init_deposit.XSize(210);
   m_init_deposit.YSize(24);
   m_init_deposit.LabelColor(C'0,100,255');
   m_init_deposit.FontSize(12);
   m_init_deposit.MinValue(10);
   m_init_deposit.SetDigits(2);
   m_init_deposit.GetTextBoxPointer().AutoSelectionMode(true);
   m_init_deposit.GetTextBoxPointer().XGap(125);
//--- コントロールを作成する
   if(!m_init_deposit.CreateTextEdit("Initial Deposit",x_gap,y_gap))
      return(false);
   m_init_deposit.SetValue((string)1000);
//--- オブジェクトグループの共通配列にオブジェクトを追加する
   CWndContainer::AddToElementsArray(0,m_init_deposit);
   return(true);
}
CreateIconButton()は、クリックするとグラフウィンドウが開くボタンを作成します。
//+------------------------------------------------------------------+
//| Creates a button with an image                                   |
//+------------------------------------------------------------------+
#resource "\\Images\\EasyAndFastGUI\\Icons\\bmp16\\bar_chart.bmp"
#resource "\\Images\\EasyAndFastGUI\\Icons\\bmp16\\bar_chart_gray.bmp"
//---
bool CProgram::CreateIconButton(const int x_gap,const int y_gap)
{
//--- メインコントロールへのポインタを保存する
   m_graph_button.MainPointer(m_tabs1);
//--- タブに取り付ける
   m_tabs1.AddToElementsArray(0,m_graph_button);
//--- プロパティ
   m_graph_button.XSize(150);
   m_graph_button.YSize(22);
   m_graph_button.FontSize(11);
   m_graph_button.IconXGap(3);
   m_graph_button.IconYGap(3);
   m_graph_button.IsHighlighted(false);
   m_graph_button.IsCenterText(true);
   m_graph_button.IconFile("Images\\EasyAndFastGUI\\Icons\\bmp16\\bar_chart.bmp");
   m_graph_button.IconFileLocked("Images\\EasyAndFastGUI\\Icons\\bmp16\\bar_chart_gray.bmp");
   m_graph_button.IconFilePressed("Images\\EasyAndFastGUI\\Icons\\bmp16\\bar_chart.bmp");
   m_graph_button.IconFilePressedLocked("Images\\EasyAndFastGUI\\Icons\\bmp16\\bar_chart_gray.bmp");
   m_graph_button.BorderColor(C'0,100,255');
   m_graph_button.BackColor(clrAliceBlue);
//--- コントロールを作成する
   if(!m_graph_button.CreateButton("",x_gap,y_gap))
      return(false);
//--- Add the element pointer to the data base
   CWndContainer::AddToElementsArray(0,m_graph_button);
   return(true);
}
レポート特性の出力の構造体は、CreateWindow()で変更されました。以前は2列ではなく、3列で補足および実装されました。これらはすべて、メインウィンドウ作成メソッドCreateWindow()の変更です。
次に、チャートウィンドウとレポートグラフを実装するメソッド CreateGraphWindow()に進みましょう。
//+------------------------------------------------------------------+
//|                                                                  |
//+------------------------------------------------------------------+
bool CProgram::CreateGraphWindow(void)
{
//--- ウィンドウ配列へのポインタを追加する
   CWndContainer::AddWindow(m_window[2]);
//--- プロパティ
   m_window[2].XSize(750);
   m_window[2].YSize(450);
   m_window[2].FontSize(9);
   m_window[2].WindowType(W_DIALOG);
   m_window[2].IsMovable(true);
//--- フォームを作成する
   if(!m_window[2].CreateWindow(m_chart_id,m_subwin,"",75,75))
      return(false);
   //--- Charts
   if(!CreateGraph(22,22))
      return(false);
//---
   return(true);
}
この作成メソッドはかなり小規模です。中にあるCreateGraph()メソッドにご注意ください。
//+------------------------------------------------------------------+
//| Create a chart                                                   |
//+------------------------------------------------------------------+
bool CProgram::CreateGraph(const int x_gap,const int y_gap)
{
//--- メインコントロールへのポインタを保存する
   m_graph1.MainPointer(m_window[2]);
//--- プロパティ
   m_graph1.AutoXResizeMode(true);
   m_graph1.AutoYResizeMode(true);
   m_graph1.AutoXResizeRightOffset(10);
   m_graph1.AutoYResizeBottomOffset(10);
//--- Create element
   if(!m_graph1.CreateGraph(x_gap,y_gap))
      return(false);
//--- Chart properties
   CGraphic *graph=m_graph1.GetGraphicPointer();
   graph.BackgroundColor(::ColorToARGB(clrWhiteSmoke));
   graph.XAxis().Min(0);
   graph.BackgroundMainSize(20);
   graph.HistoryNameSize(0);
   graph.HistorySymbolSize(0);
   graph.HistoryNameWidth(0);
//--- Add the element pointer to the data base
   CWndContainer::AddToElementsArray(2,m_graph1);
   return(true);
}
これは、空のグラフを作成し、視覚特性を設定します。グラフデータは後で追加されます。
メインのCreateGUI()にあるもう1つのメソッドはCreateLoading()です。これは読み込みウィンドウを作成し、アプリケーションの読み込み、言語設定の変更、およびデータのテストと操作の指標として機能します。
//+------------------------------------------------------------------+
//|                                                                  |
//+------------------------------------------------------------------+
#resource "\\Images\\EasyAndFastGUI\\Icons\\bmp16\\sandglass.bmp"
bool CProgram::CreateLoading(void)
{
//--- ウィンドウ配列へのポインタを追加する
   CWndContainer::AddWindow(m_window[3]);
//--- プロパティ
   m_window[3].XSize(100);
   m_window[3].YSize(50);
   m_window[3].LabelYGap(50/2-16/2);
   m_window[3].IconYGap(50/2-16/2);
   m_window[3].FontSize(9);
   m_window[3].WindowType(W_DIALOG);
   m_window[3].IsMovable(false);
   m_window[3].CloseButtonIsUsed(false);
   m_window[3].CaptionColorLocked(C'0,130,225');
   m_window[3].LabelColor(clrWhite);
   m_window[3].LabelColorLocked(clrWhite);
   m_window[3].CaptionHeight(51);
   m_window[3].IconFile("Images\\EasyAndFastGUI\\Icons\\bmp16\\sandglass.bmp");
   m_window[3].IconFileLocked("Images\\EasyAndFastGUI\\Icons\\bmp16\\sandglass.bmp");
   m_window[3].IconFilePressed("Images\\EasyAndFastGUI\\Icons\\bmp16\\sandglass.bmp");
   m_window[3].IconFilePressedLocked("Images\\EasyAndFastGUI\\Icons\\bmp16\\sandglass.bmp");
   int x=int(m_window[0].XSize()/2);
   int y=int(m_window[0].YSize()/2);
//--- フォームを作成する
   if(!m_window[3].CreateWindow(m_chart_id,m_subwin,"Working...",x,y))
      return(false);
   return(true);
}
戦略ビルダーの視覚要素を考慮してきたので、テストアルゴリズムに移り、新しい視覚コントロールを使用して情報がどのように表示されるかを見てみましょう。
前の記事でおわかりのように、戦略テストの起動と処理はGetResult()メソッドによって実装されます。新しいデータを追加したため、このメソッドを修正する必要があります。
//+------------------------------------------------------------------+
//|                                                                  |
//+------------------------------------------------------------------+
void CProgram::GetResult(const string symbol)
{
//--- Get the date range
   m_start_date=StringToTime(TimeToString(m_calendar1.SelectedDate(),TIME_DATE)+" "+(string)m_time_edit1.GetHours()+":"+(string)m_time_edit1.GetMinutes()+":00");
   m_end_date=StringToTime(TimeToString(m_calendar2.SelectedDate(),TIME_DATE)+" "+(string)m_time_edit2.GetHours()+":"+(string)m_time_edit2.GetMinutes()+":00");
//--- Check specified dates
   if(m_start_date>m_end_date || m_end_date>TimeCurrent())
   {
      if(m_lang_index==0)
         MessageBox("Неправильно выбран диапазон дат!","Ошибка",MB_OK);
      else if(m_lang_index==1)
         MessageBox("Incorrect date range selected!","Error",MB_OK);
      return;
   }
//--- Check if patterns are specified correctly
   if(m_combobox1.GetListViewPointer().SelectedItemIndex()==m_combobox2.GetListViewPointer().SelectedItemIndex())
   {
      if(m_lang_index==0)
         Messagebox("Паттерны не могут быть одинаковыми!","Ошибка",MB_OK);
      else if(m_lang_index==1)
         MessageBox("Patterns cannot be the same!","Error",MB_OK);
      return;
   }
//---
   m_window[3].OpenWindow();
//---
   m_counter=0;
   m_all_losses=0;
   m_all_profit=0;
   AddDeal(0,m_counter);
   ZeroMemory(m_report);
   MqlRates rt[];
   datetime cur_date=m_start_date;
   string tf=m_timeframe1.GetListViewPointer().SelectedItemText();
   int applied1=m_applied1.GetListViewPointer().SelectedItemIndex();
   int applied2=m_applied2.GetListViewPointer().SelectedItemIndex();
   int applied3=m_applied3.GetListViewPointer().SelectedItemIndex();
   int applied4=m_applied4.GetListViewPointer().SelectedItemIndex();
   int applied5=m_applied5.GetListViewPointer().SelectedItemIndex();
   int applied6=m_applied6.GetListViewPointer().SelectedItemIndex();
//---
   while(cur_date<m_end_date)
   {
      //---
      if(
         applied1>7 || applied2>7 || applied3>7 ||
         applied4>7 || applied5>7 || applied6>7)
      {
         if(m_custom_path.GetValue()=="")
         {
            if(m_lang_index==0)
               MessageBox("Не установлен путь к индикатору!","Ошибка",MB_OK);
            else if(m_lang_index==1)
               MessageBox("The indicator path is not set!","Error",MB_OK);
            break;
         }
         if(m_custom_param.GetValue()=="")
         {
            if(m_lang_index==0)
               MessageBox("Не установлены параметры индикатора!","Ошибка",MB_OK);
            else if(m_lang_index==1)
               MessageBox("Indicator parameters not set!","Error",MB_OK);
            break;
         }
      }
      //---
      if(
         BuySignal(symbol,m_start_date,applied1,1) ||
         BuySignal(symbol,m_start_date,applied2,2) ||
         BuySignal(symbol,m_start_date,applied3,3))
      {
         CalculateBuyDeals(symbol,m_start_date);
         cur_date=m_start_date;
         continue;
      }
      if(
         SellSignal(symbol,m_start_date,applied4,1) ||
         SellSignal(symbol,m_start_date,applied5,2) ||
         SellSignal(symbol,m_start_date,applied6,3))
      {

         CalculateSellDeals(symbol,m_start_date);
         cur_date=m_start_date;
         continue;
      }
      m_start_date+=PeriodSeconds(StringToTimeframe(tf));
      cur_date=m_start_date;
   }
//--- Output the report
   PrintReport();
//---
   m_window[3].CloseDialogBox();
}
次の変更が実装されます。
- 買いシグナルと売りシグナルのパターンが一致しないことを確認するチェックを追加しました 。
- 以前に作成したダウンロードウィンドウの使用を追加しました。
- グラフで使用されるデータ配列にテスト結果を書き込む役割を果すAddDeal()メソッドを追加しました。グラフの初期値はここで設定されます。利益タイプが「通貨」の場合、初期値は「通貨」です。「ポイント」の場合、ゼロです。
次に、AddDeal()データ追加メソッドを見てみましょう。
//+------------------------------------------------------------------+
//|                                                                  |
//+------------------------------------------------------------------+
void CProgram::AddDeal(int points,int index)
{
//--- In points
   if(m_profit_type.GetListViewPointer().SelectedItemIndex()==0)
   {
      if(index==0)
      {
         ArrayResize(data,index+1);
         data[index]=0;
         return;
      }
      ArrayResize(data,index+1);
      data[index]=data[index-1]+points;
   }
//--- In deposit currency
   else if(m_profit_type.GetListViewPointer().SelectedItemIndex()==1)
   {
      if(index==0)
      {
         ArrayResize(data,index+1);
         data[index]=StringToDouble(m_init_deposit.GetValue());
         return;
      }
      ArrayResize(data,index+1);
      //--- Get a selected symbol
      string symbol=m_table_symb.GetValue(0,m_table_symb.SelectedItem());
      string basesymbol=AccountInfoString(ACCOUNT_CURRENCY);
      string tf=m_timeframe1.GetListViewPointer().SelectedItemText();
      double lot=StringToDouble(m_base_lot.GetValue());
      if(m_lot_type.GetListViewPointer().SelectedItemIndex()>0)
      {
         lot*=data[index-1];
         lot=GetLotForOpeningPos(symbol,POSITION_TYPE_BUY,lot);
      }

      double pip_price=1;
      int shift=0;
      // --- Direct pair
      if(StringSubstr(symbol,3,3)==basesymbol)
      {
         pip_price=NormalizeDouble(SymbolInfoDouble(symbol,SYMBOL_TRADE_CONTRACT_SIZE)*SymbolInfoDouble(symbol,SYMBOL_POINT)*lot,2);
      }
      //--- Reverse pair
      else if(StringSubstr(symbol,0,3)==basesymbol)
      {
         shift=iBarShift(symbol,StringToTimeframe(tf),m_start_date,false);
         pip_price=NormalizeDouble(SymbolInfoDouble(symbol,SYMBOL_TRADE_CONTRACT_SIZE)*SymbolInfoDouble(symbol,SYMBOL_POINT)*lot/iOpen(symbol,StringToTimeframe(tf),shift),2);
      }
      else
      {
         //--- Cross pair
         StringConcatenate(symbol,StringSubstr(symbol,3,3),basesymbol);
         if(SymbolInfoDouble(symbol,SYMBOL_BID)!=0)
         {
            shift=iBarShift(symbol,StringToTimeframe(tf),m_start_date,false);
            pip_price=NormalizeDouble(SymbolInfoDouble(symbol,SYMBOL_TRADE_CONTRACT_SIZE)*SymbolInfoDouble(symbol,SYMBOL_POINT)*lot/iOpen(symbol,StringToTimeframe(tf),shift),2);
         }
         //---
         StringConcatenate(symbol,basesymbol,StringSubstr(symbol,0,3));
         if(SymbolInfoDouble(symbol,SYMBOL_BID)!=0)
         {
            shift=iBarShift(symbol,StringToTimeframe(tf),m_start_date,false);
            pip_price=NormalizeDouble(SymbolInfoDouble(symbol,SYMBOL_TRADE_CONTRACT_SIZE)*SymbolInfoDouble(symbol,SYMBOL_POINT)*lot*iOpen(symbol,StringToTimeframe(tf),shift),2);
         }
      }
      //---
      if(points>0)
         m_all_profit+=pip_price*points;
      else
         m_all_losses+=pip_price*-points;
      //---
      data[index]=data[index-1]+pip_price*points;
   }
}
引数には2つの値があります。
- pointsは、チャートの新しい値に使用されます。受信した値は、ポイントでの取引完了結果です。これは、テイクプロフィットまたはストップロスです。
- indexは取引のインデックスです。
選択した利益表示モードに応じて、メソッドで適切なデータが計算され、データ配列に追加されます。「ポイント」利益モードの場合、配列の各新しい要素は、以前の値とポイントでの取引結果の合計です。「通貨」モードでは、ポイントで受け取った取引結果が預金通貨に変換されます。この操作では、テストされたペアのタイプ(ダイレクトペア、リバースペア、クロスペア)を考慮します。
変更された他の2つのメソッドは、CalculateBuyDeals()およびCalculateSellDeals()です。見つかった信号を処理し、必要に応じて実質的にポジションを開きます。メソッドの1つを見てみましょう(2番目のメソッドの変更も同様です)。
//+------------------------------------------------------------------+
//|                                                                  |
//+------------------------------------------------------------------+
void CProgram::CalculateBuyDeals(const string symbol,datetime start)
{
   MqlRates rt[];
   int TP=int(m_takeprofit1.GetValue());
   int SL=int(m_stoploss1.GetValue());
   string tf=m_timeframe1.GetListViewPointer().SelectedItemText();
   int copied=CopyRates(symbol,StringToTimeframe(tf),m_start_date,m_end_date,rt);
   double deal_price=iOpen(symbol,StringToTimeframe(tf),copied);
   for(int j=0; j<copied; j++)
   {
      //--- Take Profit trigger
      if((iHigh(symbol,StringToTimeframe(tf),copied-j)-deal_price)/SymbolInfoDouble(symbol,SYMBOL_POINT)>=TP)
      {
         m_counter++;
         AddDeal(TP,m_counter);
         m_report.profit_trades++;
         m_report.profit+=TP;
         m_report.profit_pips+=TP;
         m_report.long_trades++;
         m_report.profit_long++;
         m_report.total_trades++;
         m_start_date=IndexToDate(m_start_date,StringToTimeframe(tf),j);
         return;
      }
      //--- Stop Loss trigger
      else if((deal_price-iLow(symbol,StringToTimeframe(tf),copied-j))/SymbolInfoDouble(symbol,SYMBOL_POINT)>=SL)
      {
         m_counter++;
         AddDeal(-SL,m_counter);
         m_report.loss_trades++;
         m_report.profit-=SL;
         m_report.loss_pips+=SL;
         m_report.long_trades++;
         m_report.total_trades++;
         m_start_date=IndexToDate(m_start_date,StringToTimeframe(tf),j);
         return;
      }
   }
   m_start_date=m_end_date;
}
変更はテイクプロフィットとストップロスのトリガーに関するものです。ここでは、上記のAddDeal() メソッドが取引成立の事実を処理します。また、REPORT m_report構造体に新しいパラメーターprofit_pipsおよびloss_pipsが追加されました。これらのパラメータにより、レポートの新しい特性を計算できます。
そして最後に大幅に変更されたメソッドは、受信データの処理と結果のレポートへの出力です。これはPrintReport()メソッドで行われます。
//+------------------------------------------------------------------+
//|                                                                  |
//+------------------------------------------------------------------+
void CProgram::PrintReport(void)
{
   string report_label[11];
   if(m_lang_index==0)
   {
      report_label[0]="Всего трейдов: ";
      report_label[1]="Чистая прибыль: ";
      report_label[2]="Прибыль в пунктах: ";
      report_label[3]="Абс.просадка баланса: ";
      report_label[4]="Макс.просадка баланса: ";
      report_label[5]="Корот.трейды/% выигр: ";
      report_label[6]="Приб.трейды/% от всех: ";
      report_label[7]="Прибыльность: ";
      report_label[8]="Фактор восстановления: ";
      report_label[9]="Длин.трейды/% выигр: ";
      report_label[10]="Убыт.трейды/% от всех: ";
   }
   else
   {
      report_label[0]="Total trades: ";
      report_label[1]="Total profit: ";
      report_label[2]="Total profit(pips): ";
      report_label[3]="Balance Drawdown Abs: ";
      report_label[4]="Balance Drawdown Max: ";
      report_label[5]="Short trades/won %: ";
      report_label[6]="Profit trades/% of all: ";
      report_label[7]="Profit Factor: ";
      report_label[8]="Recovery Factor: ";
      report_label[9]="Long trades/won %: ";
      report_label[10]="Loss trades/% of all: ";
   }
   //---
   m_report_text[0].LabelText(report_label[0]+string(m_report.total_trades));
   //---
   if(m_report.total_trades==0)
      return;
   //---
   if(m_profit_type.GetListViewPointer().SelectedItemIndex()==1)
   {
      double maxprofit=0.0,maxdd=0.0;
      for(int i=1; i<ArraySize(data); i++)
      {
         if(data[i]>maxprofit)
            maxprofit=data[i];
         if(maxdd<maxprofit-data[i])
            maxdd=maxprofit-data[i];
      }
      m_report_text[1].LabelText(report_label[1]+DoubleToString(data[ArraySize(data)-1],2));
      m_report_text[3].LabelText(report_label[3]+string(data[0]-data[ArrayMinimum(data)]));
      m_report_text[4].LabelText(report_label[4]+DoubleToString(maxdd/maxprofit*100,2)+"%");
      m_report_text[7].LabelText(report_label[7]+DoubleToString(m_all_profit/m_all_losses,2));
      m_report_text[8].LabelText(report_label[8]+DoubleToString((data[ArraySize(data)-1]-data[0])/maxdd,2));
   }
   else
   {
      m_report_text[1].LabelText(report_label[1]+"-");
      m_report_text[3].LabelText(report_label[3]+"-");
      m_report_text[4].LabelText(report_label[4]+"-");
      m_report_text[7].LabelText(report_label[7]+DoubleToString(m_report.profit_pips/(double)m_report.loss_pips,2));
   }
   m_report_text[2].LabelText(report_label[2]+string(m_report.profit));
   m_report_text[5].LabelText(report_label[5]+string(m_report.short_trades)+"/"+DoubleToString(m_report.profit_short/(double)m_report.short_trades*100,1)+"%");
   m_report_text[6].LabelText(report_label[6]+string(m_report.profit_trades)+"/"+DoubleToString(m_report.profit_trades/(double)m_report.total_trades*100,1)+"%");
   m_report_text[9].LabelText(report_label[9]+string(m_report.long_trades)+"/"+DoubleToString(m_report.profit_long/(double)m_report.long_trades*100,1)+"%");
   m_report_text[10].LabelText(report_label[10]+string(m_report.loss_trades)+"/"+DoubleToString(m_report.loss_trades/(double)m_report.total_trades*100,1)+"%");
//---
   for(int i=0; i<11; i++)
      m_report_text[i].Update(true);
   m_reported=true;
}
概要で説明したように、[Total profit](総利益)や[Recovery factor](回収率)などの一部のパラメータは、[Points](ポイント)テストモードでは使用できません。
戦略ビルダーのテストと実証
アプリケーションに実装された改善と更新に続いて、ユーザーマニュアルを更新する必要があります。
ステップ1: ユーザーインターフェイス言語を設定します。
この手順はオプションであり、言語を変更する場合にのみ必要です。
ステップ2: 指標パラメータを設定します。
アプリケーションにはすでにデフォルトのパラメータがあるため、すべての指標を構成する必要はありません。必要なパラメーターのみを変更します。必要に応じて、いつでも設定を変更できます。
手順3:銘柄表を設定します。
デフォルトでは、気配値表示でのすべての銘柄は、名前にUSDが含まれていることでフィルタリングされます。チェックボックスをオフにするだけで、使用可能なすべての銘柄を表示できます。
手順4~5:テストの時間間隔と時間枠を選択します。これらの手順は変更されていません。
手順6:売り/買いシグナルを有効にし、テスト用のパターンを選択します。
信号のセットアップ手順は変更されていません。ただし、視覚表示には変更が適用されます。信号タイプの1つが無効になっている場合、図3に示すように、関連するすべての設定が非表示になります。
図3 売買シグナルの無効化
手順7:テイクプロフィットとストップロスの設定は変更されていません。
手順8:利益タイプを選択します。
- [Points ]を選択すると、[Report]セクションのテスト結果は、選択した通貨記号のポイントで表示されます。
- [Currency]が選択されている場合、追加の設定(Lot Type、Lot Size、Initial Deposit)が表示されます。Lot Typeは、テストで適用されるロットの計算に影響し、固定または残高に基づくことができます。
手順9:手順1〜8の後、表の中を左クリックしてテスト商品を選択します。
テストが完了すると、結果がレポートセクションに表示されます。その後、[Open graph]をクリックします。
上記のアルゴリズムに従うテストは、次のビデオに示されています。
以下は、メリルパターンのテストに関する推奨事項です。
- アプリケーションが正しく機能するためには、ダウンロードする特定の取引銘柄でテストするための履歴データが必要です。
- カスタム指標パラメータには注意してください。バッファ番号、名前、パラメータはコンマで区切る必要があります。数値のみがサポートされています。カスタム指標名は、指標ルートディレクトリ(MQL5/Indicators/)からの相対パスです。指標がサブディレクトリにある(例: MQL5/Indicators/Examples)場合、指標名はそれに応じて見えるはずです(例: Examples\\indicator_name)。常に単一の円記号ではなく二重の円記号を区切り文字として使用します。
- 問題を引き起こす可能性のある最も一般的なシナリオには、ヒントが伴います。これらには、両方のシグナルでの同じパターン、前のテストを実行せずにグラフを開こうとすること、不正なテストの開始日と終了日が含まれます。
- 記事の冒頭で、レポートで使用されている特性の説明へのリンクに言及しました。リンクを使用して、パラメータの説明と計算方法の詳細を参照してください。
終わりに
以下の添付ファイルには、説明されたすべてのファイルがフォルダに正しく分類されています。正しい操作のためには、MQL5フォルダをターミナルのルートディレクトリに保存してください。MQL5フォルダのあるルートディレクトリを開くには、MetaTrader 5ターミナルでCtrl+Shift+Dキーの組み合わせを押すか、下記の図7にあるようにコンテキストメニューを使用します。
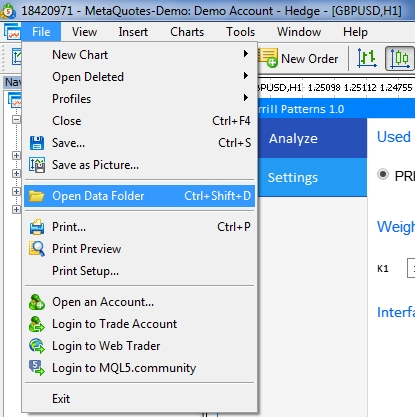
図5 MetaTrader 5ターミナルルートでMQL5フォルダを開く
MetaQuotes Ltdによってロシア語から翻訳されました。
元の記事: https://www.mql5.com/ru/articles/7361
 SQLite: MQL5 での SQL データベースのネイティブな処理
- 無料取引アプリ
- 8千を超えるシグナルをコピー
- 金融ニュースで金融マーケットを探索