Double Top and Bottom Pattern MT5
- Indicatori
-
Ugur Oezcan
 # ICMARKETS (sconto live del 21%)
Sconto live del 21,5% sulle commissioni di ICMarkets. Gli sconti sono disponibili per ogni operazione sul tuo conto, comprese le operazioni manuali. - Versione: 1.10
- Attivazioni: 5
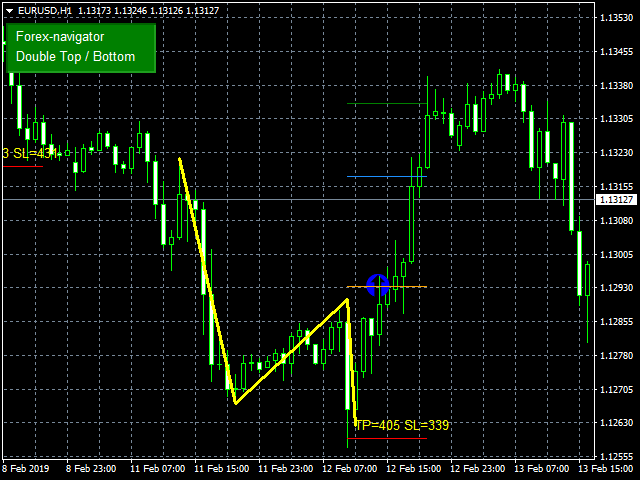
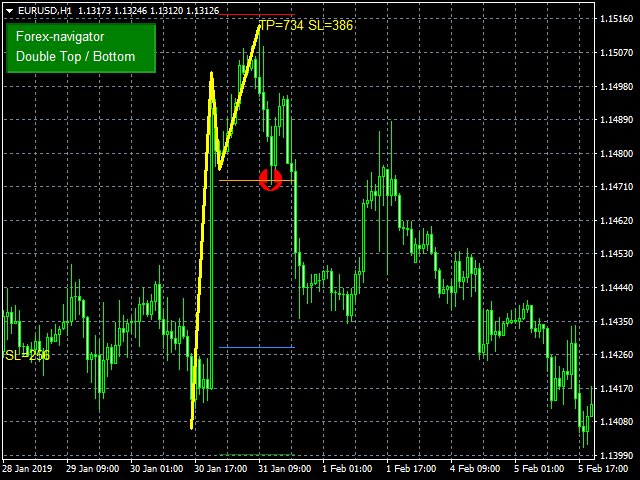
Double top and bottom patterns are chart patterns that occur when the underlying investment moves in a similar pattern to the letter "W" (double bottom) or "M" (double top). Double top and bottom analysis is used in technical analysis to explain movements in a security or other investment, and can be used as part of a trading strategy to exploit recurring patterns.
you can fin MT4 version hier
Indicator shows you 2 Level target and stop loss level. Stoploss level and Take profit can be adjusted depending on your risk tolerance.
The following alert types are available:
- Popup alert,
- Email ( Settings in metatrader 4 stations necessary: instruction ),
- Notification to mql5 app ( Settings in mql5.com profile necessary: instruction ),
- sound,
- Comment at screen,
- log at expert tab
INPUT PARAMETER
*** Pattern setup
Min Points - Min points between Highs and Lows
Trend Move Min Bars - Checking min bars
Trend Move MaxBars - checking max bars
Enable reversal signal - Enable reversal signal
Enable continuation signal - Enable continuation signal
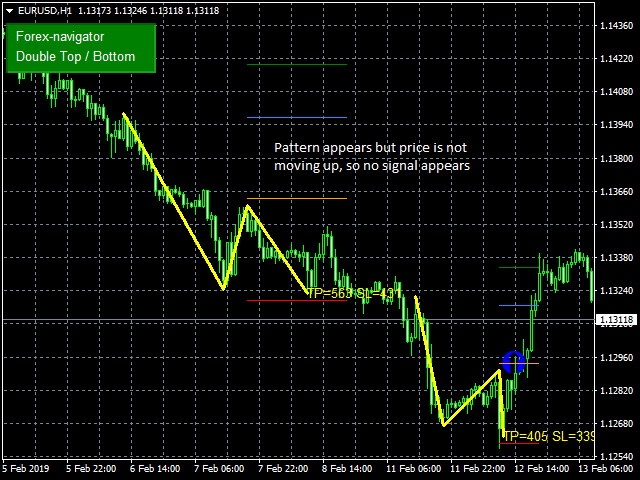
Signal Valid Bars - Signal line(Orange Line) , signal appaers if price hit this line. you can define how many bars to obeserve price after pattern appears
*** Trade setup
Stoploss Offset Points - Offset of stoploss from High or Lows (Red line)
Entry Offset Points - Offset signal line in Points (Orange Line)
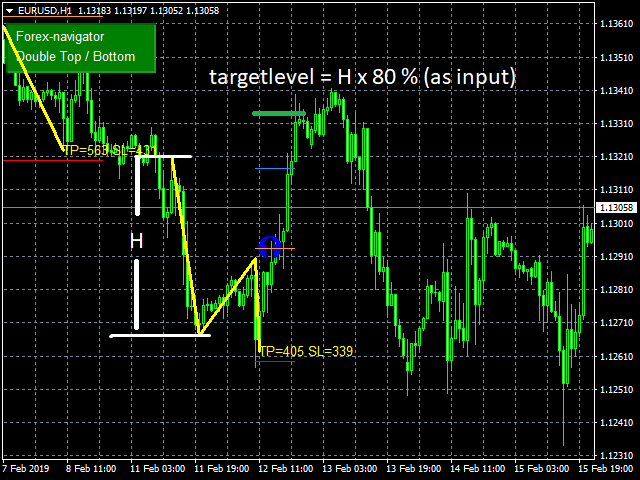
Target Level Percent - Perscent of first Trand line (Yellow line)
Safe Level Percent - Perscent of first Trand line (Blue line)
*** Visualisation
Panel Offset - Panel offset on chart
AlertType