Double Top and Bottom Pattern MT5

Qu'est-ce que le double haut et bas ?

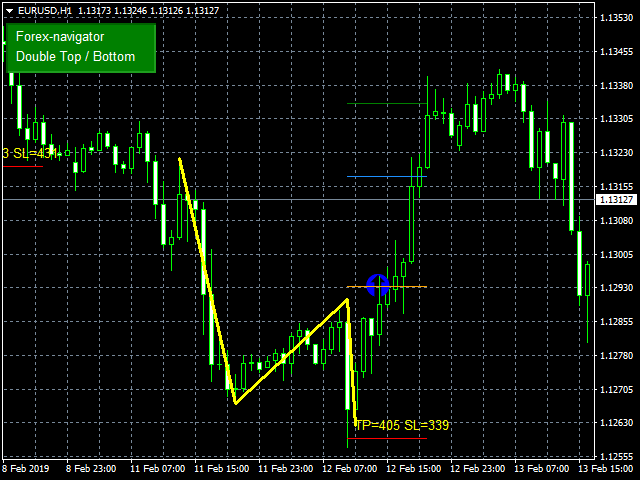
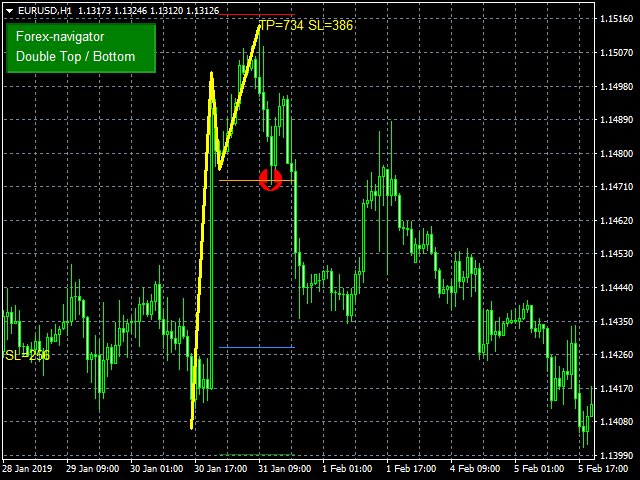
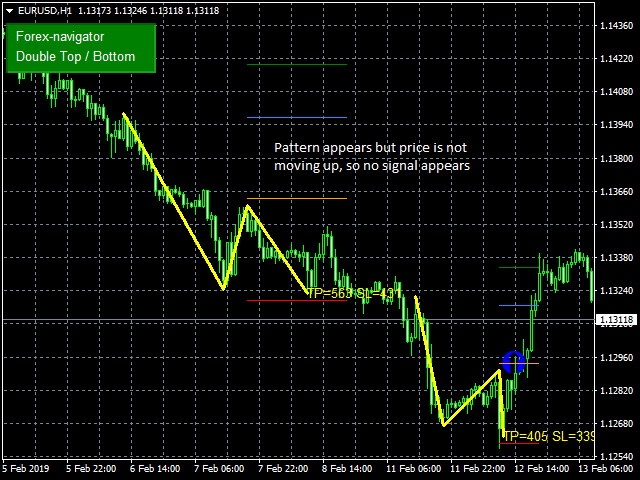
Les modèles double top et bottom sont des modèles graphiques qui se produisent lorsque l'investissement sous-jacent évolue selon un modèle similaire à la lettre "W" (double bottom) ou "M" (double top). L'analyse double haut et bas est utilisée dans l'analyse technique pour expliquer les mouvements d'un titre ou d'un autre investissement, et peut être utilisée dans le cadre d'une stratégie de trading pour exploiter des modèles récurrents.

vous pouvez trouver la version MT4 ici

L'indicateur vous montre la cible de 2 niveaux et le niveau de perte d'arrêt. Le niveau Stoploss et le Take profit peuvent être ajustés en fonction de votre tolérance au risque.


Les types d'alerte suivants sont disponibles :

- Alerte contextuelle,

- E-mail (Paramètres nécessaires dans les stations metatrader 4 : instruction ),

- Notification à l'application mql5 (Paramètres dans le profil mql5.com nécessaires : instruction),

- du son,

- Commentaire à l'écran,

- se connecter à l'onglet expert


PARAMÈTRE D'ENTRÉE

*** Configuration du motif

Points Min - Points Min entre les Hauts et les Bas

Trend Move Min Bars - Vérification des barres min

Trend Move MaxBars - vérification des barres max

Activer le signal d'inversion - Activer le signal d'inversion

Activer le signal de continuation - Activer le signal de continuation

Barres valides du signal - Ligne de signal (ligne orange), le signal apparaît si le prix atteint cette ligne. vous pouvez définir le nombre de barres pour observer le prix après l'apparition du modèle

*** Configuration commerciale

Points de décalage Stoploss - Décalage du stoploss par rapport aux hauts ou aux bas (ligne rouge)

Points de décalage d'entrée - ligne de signal de décalage en points (ligne orange)

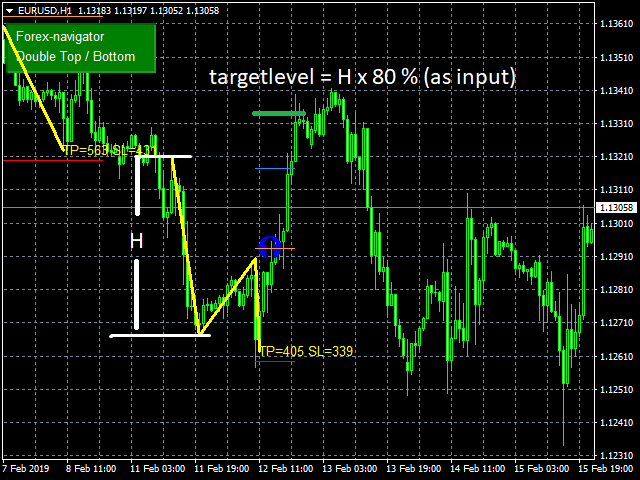
Pourcentage du niveau cible - Pourcentage de la première ligne Trand (ligne jaune)

Pourcentage de niveau de sécurité - Pourcentage de la première ligne Trand (ligne bleue)

*** Visualisation

Décalage du panneau - Décalage du panneau sur le graphique

Type d'alerte
Produits recommandés
RBreaker
Zhong Long Wu
RBreaker Gold Indicators est une stratégie de trading intraday à court terme pour les contrats à terme sur l'or, qui combine deux approches : le suivi de tendance et le retournement intraday. Elle permet non seulement de capturer les profits dans les marchés en tendance, mais aussi de prendre des bénéfices en temps opportun lors des retournements de marché et d'ouvrir une position en sens inverse. Cette stratégie a été classée pendant 15 années consécutives parmi les dix stratégies de trading l
KT Renko Patterns MT5
KEENBASE SOFTWARE SOLUTIONS
KT Renko Patterns analyse le graphique Renko brique par brique afin de détecter des figures techniques bien connues, fréquemment utilisées par les traders sur divers marchés financiers. Par rapport aux graphiques basés sur le temps, les Renko offrent une vue épurée, rendant les figures plus faciles à reconnaître et à exploiter. KT Renko Patterns comprend plusieurs figures Renko, dont la majorité sont expliquées en détail dans le livre “Profitable Trading with Renko Charts” de Prashant Shah. Un
L'indicateur SMC Venom Model BPR est un outil professionnel pour les traders travaillant dans le concept Smart Money (SMC). Il identifie automatiquement deux modèles clés sur le graphique des prix: FVG   (Fair Value Gap) est une combinaison de trois bougies, dans laquelle il y a un écart entre la première et la troisième bougie. Forme une zone entre les niveaux où il n'y a pas de support de volume, ce qui conduit souvent à une correction des prix. BPR   (Balanced Price Range) est une combinaiso
KT Double Top Bottom MT5
KEENBASE SOFTWARE SOLUTIONS
1 (1)
The double top bottom pattern is arguably one of the technical analysis's most popular chart patterns. These patterns are used to capitalize on recurring patterns and identify trend reversal patterns, thereby creating well-placed entry and exit levels. The KT Double Top Bottom is based on these patterns and fine-tunes the trade signal development process for traders. Features It's based on one of the most reliable trading patterns and brings some fine-tuning and automation to the process. Also
CvdDeltaVolumes
Parasbhai N Patel
Delta + CVD & CVD Candles Order-flow indicator combining Delta (Ask–Bid), Cumulative Volume Delta (CVD), and a unique CVD-based synthetic candle system. Shows buy/sell pressure, volume aggressiveness, and momentum shifts with optional Delta histogram, CVD line, and CVD+Delta combined candles. Useful for scalping, intraday trading, divergence detection, and understanding buyer/seller dominance. Overview The Delta + CVD & CVD Candles Indicator combines multiple order-flow tools into one clean
Trade smarter, not harder: Empower your trading with Harmonacci Patterns This is arguably the most complete harmonic price formation auto-recognition indicator you can find for the MetaTrader Platform. It detects 19 different patterns, takes fibonacci projections as seriously as you do, displays the Potential Reversal Zone (PRZ) and finds suitable stop-loss and take-profit levels. [ Installation Guide | Update Guide | Troubleshooting | FAQ | All Products ] It detects 19 different harmonic pri
Volume Profile V6
Andrey Kolesnik
4.67 (3)
Indicateur de profil de volume de marché + oscillateur intelligent. Fonctionne sur pratiquement tous les instruments — paires de devises, actions, futures, crypto-monnaies, sur volumes réels et sur ticks. Il est possible de configurer la définition automatique de la plage de construction du profil (par exemple, pour une semaine ou un mois, etc.), ou de définir la plage manuellement en déplaçant les limites (deux lignes verticales : rouge et bleue). L'affichage se fait sous forme d'histogramme. L
Cumulative delta indicator As most traders believe, the price moves under the pressure of market buying or selling. When someone redeems an offer standing in the cup, the deal is a "buy". If someone pours into the bid standing in the cup - the deal goes with the direction of "sale". The delta is the difference between purchases and sales. A cumulative delta - the difference between the cumulative sum of purchases and sales for a certain period of time. It allows you to see who is currently contr
Price Magnet — Price Density and Attraction Levels Indicator Price Magnet is a professional analytical tool designed to identify key support and resistance levels based on statistical Price Density. The indicator analyzes a specified historical period and detects price levels where the market spent the most time. These zones act as “magnets,” attracting price action or forming a structural base for potential reversals. Unlike traditional Volume Profile tools, Price Magnet focuses on price-time d
Le WaveTrend Oscillator MT5 est un indicateur de trading puissant conçu pour améliorer votre analyse de marché en identifiant les changements de momentum et les potentielles inversions de tendance. Idéal pour les traders de tous niveaux, cet outil offre des informations précieuses sur les conditions de surachat et de survente à travers divers marchés, y compris forex, les cryptomonnaies et les matières premières. Avec sa capacité à générer des signaux d'achat et de vente précis, le WaveTrend Osc
Noize Absorption Index - is the manual trading system that measures the difference of pressure between bears forces and bulls forces. Green line - is a noize free index that showing curent situation. Zero value of index shows totally choppy/flat market.Values above zero level shows how powerfull bullish wave is and values below zero measures bearish forces.Up arrow appears on bearish market when it's ready to reverse, dn arrow appears on weak bullish market, as a result of reverse expectation.
CosmiCLab SMC FIBO CosmiCLab SMC FIBO is a professional trading indicator designed for traders who use Smart Money Concepts (SMC), market structure analysis and Fibonacci retracement levels. The indicator automatically detects market swings and builds Fibonacci levels based on the latest impulse movement. It also identifies market structure changes such as BOS (Break of Structure) and CHOCH (Change of Character), helping traders understand the current market direction. CosmiCLab SMC FIBO also pr
Level Volume Pro
John Samfel Bucton Josol
HAT IT DOES   MONTHLY HIGH & LOW — AUTO-DRAWN EVERY MONTH Draws the High and Low of every month for the current year (or any year you set). Each level extends as a horizontal ray into the future so you always see where price is reacting to historical monthly extremes. Color-coded (blue = high, red = low), labeled (JAN HIGH, FEB LOW etc.), fully customizable width and style. Toggle individual months on or off.   WEEKLY HIGH & LOW
Visual CrossPulse Dynamics Indicator
AL MOOSAWI ABDULLAH JAFFER BAQER
Visual CrossPulse Dynamics: Trade with the Market's True Rhythm Unlock a new level of market insight with Visual CrossPulse Dynamics, a sophisticated trading indicator designed to adapt to ever-changing volatility and reveal the true direction of the trend. Are you tired of indicators that lag in fast-moving markets or give false signals during consolidation? The Visual CrossPulse Dynamics indicator solves this problem by using an advanced, adaptive algorithm that intelligently adjusts to the m
Auto Optimized RSI   est un indicateur fléché intelligent et facile à utiliser, conçu pour fournir des signaux d’achat et de vente précis. Il utilise des simulations de trading sur des données historiques pour déterminer automatiquement les niveaux RSI les plus efficaces pour chaque instrument et période. Cet indicateur peut être utilisé comme un système de trading autonome ou intégré dans votre stratégie existante, et il est particulièrement utile pour les traders à court terme. Contrairement a
SuperTrend MT5
KEENBASE SOFTWARE SOLUTIONS
KT SuperTrend is a modified version of the classic SuperTrend indicator with new useful features. Whether its Equities, Futures, and Forex, the beginners' traders widely use the Supertrend indicator.  Buy Signal: When price close above the supertrend line. Sell Signal: When price close below the supertrend line. Features A multi-featured SuperTrend coded from scratch. Equipped with a multi-timeframe scanner. The last signal direction and entry price showed on the chart. All kinds of MetaTrader
Caicai L&S Yield Histogram Important Notice: This indicator is an integral tool of the automated EA Caicai Long and Short Pair Trading . This indicator visually displays the percentage deviation (Yield %) of a pair's current spread relative to its own historical mean. It is an excellent tool for quickly visualizing the gross financial potential of a market distortion in Long & Short operations. Main Features: Percentage Visualization: Understand the size of the distortion in palpable percentage
Fibaction
Abdelkhalek Orabi
Indicator Name: Fibaction – price action candle Detector Description: Fibo Signal Boxes is a powerful Smart Money Concept (SMC)-inspired indicator that auto-detects price action candles. bullish hammers and shooting stars, then draws precise Fibonacci entry zones and multiple take-profit levels directly on the chart. as for the SL personally i use 40 pips rules  Key Features: Detects bullish hammer and shooting star reversal candles. Automatically draws Fibonacci entry and TP boxes. as
Scalping Flash X
Syamsurizal Dimjati
SCALPFLASH-X Where Fibonacci Precision Meets RSI Intelligence. Next-gen trading system combining Adaptive Fibonacci Pivots, RSI Heat Mapping, and Smart Candle Analytics. Detect market dominance, momentum shifts, and reversal zones in real time across multiple timeframes. Institutional accuracy, retail simplicity — built for speed, clarity, and precision. Advanced Multi-Timeframe Fibonacci & RSI-Driven Market Intelligence System ScalpFlash-X — A next-generation trading system combining Fibonacc
The Super Arrow Indicator provides non-repainting buy and sell signals with exceptional accuracy. Key Features No repainting – confirmed signals remain fixed Clear visual arrows: green for buy, red for sell Real-time alerts via pop-up, sound, and optional email Clean chart view with no unnecessary clutter Works on all markets: Forex, gold, oil, indices, crypto Adjustable Parameters TimeFrame Default:   "current time frame" Function:   Sets the time frame for indicator calculation Options:   Can
MACDivergence MTF MT5
Pavel Zamoshnikov
4 (5)
Advanced ideas of the popular MACD indicator: It detects and displays classic and reverse divergences (two methods of detecting divergences). It uses different color to highlight an uptrend and a downtrend. Two methods of determining a trend: а) MACD crosses the 0 level (classic signal); б) MACD crosses its own average (early signal). This is a multi-timeframe indicator: it can display MACD data from other timeframes. Two methods of drawing: classic histogram and line. It generates sound and vis
Double HMA MTF for MT5
Pavel Zamoshnikov
4 (4)
This is an advanced multi-timeframe version of the popular Hull Moving Average (HMA) Features Two lines of the Hull indicator of different timeframes on the same chart. The HMA line of the higher timeframe defines the trend, and the HMA line of the current timeframe defines the short-term price movements. A graphical panel with HMA indicator data from all timeframes at the same time . If the HMA switched its direction on any timeframe, the panel displays a question or exclamation mark with a tex
Your Trend Friend
Luigi Nunes Labigalini
5 (1)
The trend is your friend! Look at the color of the indicator and trade on that direction. It does not  repaint. After each candle is closed, that's the color of the trend. You can focus on shorter faster trends or major trends, just test what's most suitable for the symbol and timeframe you trade. Simply change the "Length" parameter and the indicator will automatically adapt. You can also change the color, thickness and style of the lines. Download and give it a try! There are big movements w
**   All Symbols   x   All Timeframes   scan just by pressing scanner button ** Discount: The price is $50$, But now it is just $39, Limited time offer is active. *** Contact me  to send you instruction and add you in "Trend Reversal group" for sharing or seeing experiences with other users. Introduction: Trendlines are the most famous technical analysis in trading . Trendlines continually form on the charts of markets across all the different timeframes providing huge opportunities for traders
Crash 1000 Scalping Indicator for the Crash 1000 Deriv Synthetic Index. Introduction The Crash 1000 Scalping Indicator is a specialized tool designed for the Crash 1000 index on the Deriv Synthetic market. This indicator is particularly useful for scalping on the M1 timeframe, helping traders to identify precise entry and exit points for buy positions. It is designed to be non-repainting, providing clear signals with audible alerts and push notifications, and is compatible with mobile devices th
Indicateur Crypto_Forex « HTF Moving Averages Cross » pour MT5. - Améliorez vos méthodes de trading avec le puissant indicateur HTF Moving Averages Cross pour MT5. HTF signifie « période de temps supérieure ». - Cet indicateur est idéal pour les traders de tendance avec des entrées d'action de prix. - Il vous permet d'associer des moyennes mobiles rapides et lentes d'une période de temps supérieure à votre graphique actuel - une méthode professionnelle. - HTF Moving Averages Cross intègre des
TRI Visualizer
Yoshimi Mon 三 Ura
TRI Visualizer MT5 – Thermodynamic Market Analysis Overview The TRI (Thermal Range Indicator) Visualizer Enhanced is a rare market analysis indicator that goes beyond conventional technical analysis, applying principles of thermodynamics from physics. It interprets market price fluctuations as “thermodynamic energy,” enabling the highly accurate detection of subtle market changes that are often overlooked. Innovative Mechanisms 1. Dual Calculation Engines Classic TRI Mode Formula: |Close
The Trend Duration Forecast MT5 indicator is designed to estimate the probable lifespan of a bullish or bearish trend. Using a Hull Moving Average (HMA) to detect directional shifts, it tracks the duration of each historical trend and calculates an average to forecast how long the current trend is statistically likely to continue. This allows traders to visualize both real-time trend strength and potential exhaustion zones with exceptional clarity. KEY FEATURES Dynamic Trend Detection:   Utiliz
Max Min Delta Indicator - Market Volume Imbalance Analysis Gain Deeper Insights into Market Volume Imbalance with Delta Analysis What is the Max Min Delta Indicator? The Max Min Delta Indicator is a powerful market volume analysis tool that visually represents maximum and minimum delta values using a histogram. It helps traders identify market strength, weakness, absorption, and aggressive buying/selling activity with precision. Key Features Histogram Visualization: Displays Max Delta (Green) an
Indicateur Crypto_Forex Motif PINBAR pour MT5, sans refonte, sans délai. - L'indicateur « Motif PINBAR » est un indicateur très performant pour le trading Price Action. - L'indicateur détecte les PinBars sur le graphique : - PinBar haussière : signal de flèche bleue sur le graphique (voir images). - PinBar baissière : signal de flèche rouge sur le graphique (voir images). -   Avec alertes PC et mobile. - L'indicateur « Motif PINBAR » est idéal pour combiner les niveaux de support et de résista
Les acheteurs de ce produit ont également acheté
SuperScalp Pro
Van Minh Nguyen
4.72 (18)
SuperScalp Pro – Système d’indicateur de scalping avancé multi-filtres SuperScalp Pro est un système d’indicateur de scalping avancé qui combine le Supertrend classique avec plusieurs filtres de confirmation intelligents. L’indicateur fonctionne efficacement sur toutes les unités de temps de M1 à H4 et est particulièrement adapté à XAUUSD, BTCUSD et aux principales paires Forex. Il peut être utilisé comme système autonome ou intégré de manière flexible dans des stratégies de trading existantes.
Power Candles MT5
Daniel Stein
4.75 (8)
Power Candles – Signaux d’entrée basés sur la force pour tous les marchés Power Candles intègre l’analyse de force éprouvée de Stein Investments directement dans le graphique des prix. Au lieu de réagir uniquement au prix, chaque bougie est colorée en fonction de la force réelle du marché, ce qui permet d’identifier instantanément les phases de momentum, l’accélération de la force et les transitions de tendance propres. Une logique unique pour tous les marchés Power Candles fonctionne automatiqu
Azimuth Pro
Ottaviano De Cicco
5 (6)
Azimuth Pro V2: Synthetic Fractal Structure and Confirmed Entries for MT5 Overview Azimuth Pro is a multi-level swing structure indicator by Merkava Labs . Four nested swing layers, swing-anchored VWAP, ABC pattern detection, three-timeframe structural filtering, and closed-bar confirmed entries — one chart, one workflow from micro-swings to macro-cycles. This is not a blind signal product. It is a structure-first workflow for traders who care about location, context, and timing. V2 Launch Offe
Entry In The Zone and SMC Multi Timeframe is a real-time 2-in-1 market analysis tool that combines market structure analysis and a No Repaint BUY / SELL signal system into a single indicator, built on Smart Money Concepts (SMC) — a widely adopted framework used by professional traders to understand market structure. This indicator helps you see the market more clearly, make decisions based on structure rather than guesswork, and focus on high-probability zones where price is more likely to react
Divergence Bomber
Ihor Otkydach
4.9 (86)
Chaque acheteur de cet indicateur reçoit également gratuitement : L’outil exclusif « Bomber Utility », qui accompagne automatiquement chaque opération de trading, fixe les niveaux de Stop Loss et de Take Profit, et clôture les positions selon les règles de la stratégie Des fichiers de configuration (set files) pour adapter l’indicateur à différents actifs Des set files pour configurer le Bomber Utility selon différents modes : « Risque Minimum », « Risque Équilibré » et « Stratégie d’Attente » U
OmniSync Projection
Antonio-alin Teculescu
5 (1)
Chronos Fractal Engine is an innovative price projection indicator for MetaTrader 5, designed to transform your technical analysis by intelligently identifying and projecting historical price patterns. Built upon an advanced correlation algorithm and the fractal principles of the market, this powerful tool visualizes potential future price movements, giving you a unique edge in your trading decisions. What is Chronos Fractal Engine? At its core, the Chronos Fractal Engine employs a sophisticat
Meridian Pro
Ottaviano De Cicco
5 (1)
Meridian Pro: Professional Multi-Timeframe Trend Matrix for MT5 Overview Meridian Pro is a multi-timeframe trend matrix by Merkava Labs that compresses directional state, strength, momentum condition and matrix agreement into one compact panel. One adaptive engine, applied consistently from M1 to W1. No per-symbol tuning. No indicator stacking. One structured readout across every asset and every timeframe. Launch Offer — Get Meridian Pro for USD 99 (introductory). Regular price: USD 149. 1. Why
Si vous achetez cet indicateur, vous recevrez mon Gestionnaire de Trading Professionnel + EA  GRATUITEMENT. Tout d'abord, il convient de souligner que ce système de trading est un indicateur non repeint, non redessiné et non retardé, ce qui le rend idéal pour le trading manuel et automatisé. Cours en ligne, manuel et téléchargement de préréglages. Le "Système de Trading Smart Trend MT5" est une solution de trading complète conçue pour les traders débutants et expérimentés. Il combine plus de 10
Trend Screener Pro MT5
STE S.S.COMPANY
4.85 (104)
Indicateur de tendance, solution unique révolutionnaire pour le trading et le filtrage des tendances avec toutes les fonctionnalités de tendance importantes intégrées dans un seul outil ! Il s'agit d'un indicateur multi-période et multi-devises 100 % non repeint qui peut être utilisé sur tous les symboles/instruments : forex, matières premières, crypto-monnaies, indices et actions. Trend Screener est un indicateur de suivi de tendance efficace qui fournit des signaux de tendance fléchés avec des
FX Trend MT5 NG
Daniel Stein
5 (4)
FX Trend NG : La Nouvelle Génération d’Intelligence de Tendance Multi-Marchés Vue d’ensemble FX Trend NG est un outil professionnel d’analyse de tendance multi-timeframe et de surveillance des marchés. Il vous permet de comprendre la structure complète du marché en quelques secondes. Au lieu de naviguer entre de nombreux graphiques, vous identifiez immédiatement quels instruments sont en tendance, où le momentum s’affaiblit et où plusieurs unités de temps sont alignées. Offre de Lancement – Ob
Quantum TrendPulse
Bogdan Ion Puscasu
5 (22)
Présentation de   Quantum TrendPulse   , l'outil de trading ultime qui combine la puissance de   SuperTrend   ,   RSI   et   Stochastic   dans un seul indicateur complet pour maximiser votre potentiel de trading. Conçu pour les traders qui recherchent précision et efficacité, cet indicateur vous aide à identifier les tendances du marché, les changements de dynamique et les points d'entrée et de sortie optimaux en toute confiance. Caractéristiques principales : Intégration SuperTrend :   suivez f
Btmm state engine pro
Garry James Goodchild
5 (3)
BTMM State Engine Pro is a MetaTrader 5 indicator for traders who use the Beat The Market Maker approach: Asian session context, kill zone timing, level progression, peak formation detection, and a multi-pair scanner from a single chart. It combines cycle state logic with a built-in scanner dashboard so you do not need the same tool on many charts at once. What it does Draws the Asian session range; session times can follow broker server offset or be set in inputs. Tracks level progression (L
Trend indicator AI mt5
Ramil Minniakhmetov
5 (16)
L'indicateur Trend Ai est un excellent outil qui améliorera l'analyse du marché d'un trader en combinant l'identification des tendances avec des points d'entrée exploitables et des alertes d'inversion. Cet indicateur permet aux utilisateurs de naviguer dans les complexités du marché forex avec confiance et précision Au-delà des signaux primaires, l'indicateur Trend Ai identifie les points d'entrée secondaires qui surviennent lors des retraits ou des retracements, permettant aux traders de capit
Gann Made Easy   est un système de trading Forex professionnel et facile à utiliser qui est basé sur les meilleurs principes de trading en utilisant la théorie de mr. WD Gann. L'indicateur fournit des signaux d'ACHAT et de VENTE précis, y compris les niveaux Stop Loss et Take Profit. Vous pouvez échanger même en déplacement en utilisant les notifications PUSH. VEUILLEZ ME CONTACTER APRÈS L'ACHAT POUR RECEVOIR GRATUITEMENT DES INSTRUCTIONS DE TRADING ET D'EXCELLENTS INDICATEURS SUPPLÉMENTAIRES! V
ARICoins
Temirlan Kdyrkhan
ARICoin is a powerful trading companion designed to generate high-probability entry signals with dynamic TP/SL/DP levels based on volatility. Built-in performance tracking shows win/loss stats, PP1/PP2 hits, and success rates all updated live. Key Features: Buy/Sell signals with adaptive volatility bands Real-time TP/SL/DP levels based on ATR Built-in MA Filter with optional ATR/StdDev volatility Performance stats panel (Success, Profit/Loss, PP1/PP2) Alerts via popup, sound, push, or email Cust
Crystal Heikin Ashi Signals
Muhammad Jawad Shabir
5 (2)
Crystal Heikin Ashi Signals - Professional Trend & Signal Detection Indicator Advanced Heikin Ashi Visualization with Intelligent Signal System for Manual & Automated Trading Final Price: $149 ---------> Price goes up $10 after every 10 sales . Limited slots available — act fast . Overview Crystal Heikin Ashi Signals is a professional-grade MetaTrader 5 indicator that combines pure Heikin Ashi candle visualization with an advanced momentum-shift detection system. Designed for both manual traders
RFI levels PRO MT5
Roman Podpora
3.67 (3)
L'indicateur montre avec précision les points de retournement et les zones de retour des prix où le       Acteurs majeurs   . Vous repérez les nouvelles tendances et prenez des décisions avec une précision maximale, en gardant le contrôle de chaque transaction. VERSION MT4     -    Révèle son potentiel maximal lorsqu'il est combiné à l'indicateur   TREND LINES PRO Ce que l'indicateur montre : Structures et niveaux d'inversion avec activation au début d'une nouvelle tendance. Affichage des nivea
Voyez quelle strategie fonctionne reellement sur votre symbole - avant de risquer de l'argent reel. Power Bar detecte les barres de prix extremes sur n'importe quel symbole et n'importe quel timeframe, puis backteste instantanement 3 strategies de trading differentes pour que vous puissiez comparer les taux de reussite, les facteurs de profit et les P&L cote a cote. Le tout dans un seul panneau interactif. Pas de suppositions. Pas de suroptimisation. Juste des donnees. Qu'est-ce qui rend Power
Atomic Analyst MT5
Issam Kassas
3.94 (31)
Tout d'abord, il convient de souligner que cet indicateur de trading n'est ni repainting, ni redrawing et ne présente aucun délai, ce qui le rend idéal à la fois pour le trading manuel et automatisé. Manuel de l'utilisateur : réglages, entrées et stratégie. L'Analyste Atomique est un indicateur d'action sur les prix PA qui utilise la force et le momentum du prix pour trouver un meilleur avantage sur le marché. Équipé de filtres avancés qui aident à éliminer les bruits et les faux signaux, et à
Tout d'abord, il convient de souligner que cet outil de trading est un indicateur non repeint, non redessiné et non retardé, ce qui le rend idéal pour le trading professionnel. Cours en ligne, manuel utilisateur et démonstration. L'indicateur Smart Price Action Concepts est un outil très puissant à la fois pour les nouveaux et les traders expérimentés. Il regroupe plus de 20 indicateurs utiles en un seul, combinant des idées de trading avancées telles que l'analyse du trader Inner Circle et le
Auto Optimized Parabolic RSI : Moteur de Momentum 3D Avancé La plupart des indicateurs pour les particuliers échouent car ils s'appuient sur des paramètres statiques qui se brisent dès que la volatilité du marché change. L'Auto Optimized Parabolic RSI résout le problème de l'« obsolescence des indicateurs » en recalculant continuellement son propre avantage mathématique, apportant une adaptation quantitative de niveau institutionnel directement sur votre terminal MT5. L'Avantage Principal : Opti
RelicusRoad Pro : Système d'Exploitation Quantitatif du Marché 70% DE RÉDUCTION ACCÈS À VIE (DURÉE LIMITÉE) - REJOIGNEZ 2 000+ TRADERS Pourquoi la plupart des traders échouent-ils même avec des indicateurs "parfaits" ? Parce qu'ils tradent des concepts isolés dans le vide. Un signal sans contexte est un pari. Pour gagner, il faut de la CONFLUENCE . RelicusRoad Pro est un Écosystème Quantitatif complet . Il cartographie la "Fair Value Road", distinguant le bruit des cassures structurelles. Arrête
FX Power MT5 NG
Daniel Stein
5 (31)
FX Power : Analysez la force des devises pour des décisions de trading plus intelligentes Aperçu FX Power est l'outil essentiel pour comprendre la force réelle des principales devises et de l'or, quelles que soient les conditions du marché. En identifiant les devises fortes à acheter et les faibles à vendre, FX Power simplifie vos décisions de trading et révèle des opportunités à forte probabilité. Que vous suiviez les tendances ou anticipiez les retournements à l'aide de valeurs extrêmes de D
Bill Williams Advanced
Siarhei Vashchylka
5 (11)
Bill Williams Advanced is designed for automatic chart analysis using Bill Williams' "Profitunity" system. The indicator analyzes four timeframes at once. Manual (Be sure to read before purchasing) Advantages 1. Analyzes the chart using Bill Williams' "Profitunity" system. Signals are displayed in a table in the corner of the screen and on the price chart. 2. Finds all known AO and AC signals, as well as zone signals. Equipped with a trend filter based on the Alligator. 3. Finds "Divergence Bar
Currency Strength Dashboard Pro Tableau de bord professionnel d’ analyse de la force des devises en temps réel pour MetaTrader 5 . L’indicateur calcule et affiche la force de 8 devises majeures (EUR, USD, GBP, JPY, CHF, AUD, CAD, NZD) en utilisant 28 paires de devises simultanément sur plusieurs unités de temps. Le tableau de bord offre au trader une vision complète du marché en un seul coup d’œil — sans calculs supplémentaires ni changement entre plusieurs graphiques. Méthode de calcul L’indica
CGE Trading Suite
Carl Gustav Johan Ekstrom
5 (1)
CGE Trading Suite delivers the analytical edge typically reserved for professional trading desks. The platform integrates a full suite of analytical tools into one seamless workflow: dynamic grid mapping, liquidity behavior analysis, ECM, trend lines, MIDAS, trade cycles, and directional channel projections. Together, these provide a unified view of market structure and momentum. Directional clarity is further enhanced by the capital flow index, which measures currency basket strength to identif
TREND LINES PRO   Cet indicateur permet de comprendre les véritables changements de direction du marché. Il révèle les renversements de tendance et les points de retour des principaux acteurs. Tu vois   Lignes BOS   Détection des changements de tendance et des niveaux clés sur des unités de temps supérieures, sans paramètres complexes ni interférences inutiles. Les signaux restent affichés sur le graphique même après la fermeture de la bougie. Version MT4   -   Révèle son potentiel maximal lorsq
ARIPoint
Temirlan Kdyrkhan
ARIPoint is a powerful trading companion designed to generate high-probability entry signals with dynamic TP/SL/DP levels based on volatility. Built-in performance tracking shows win/loss stats, PP1/PP2 hits, and success rates all updated live. Key Features: Buy/Sell signals with adaptive volatility bands Real-time TP/SL/DP levels based on ATR Built-in MA Filter with optional ATR/StdDev volatility Performance stats panel (Success, Profit/Loss, PP1/PP2) Alerts via popup, sound, push, or email Cu
Berma Bands
Muhammad Elbermawi
5 (8)
L'indicateur Berma Bands (BB) est un outil précieux pour les traders qui cherchent à identifier et à capitaliser sur les tendances du marché. En analysant la relation entre le prix et les BB, les traders peuvent déterminer si un marché est dans une phase de tendance ou de range. Visitez le [ Berma Home Blog ] pour en savoir plus. Les bandes de Berma sont composées de trois lignes distinctes : la bande de Berma supérieure, la bande de Berma moyenne et la bande de Berma inférieure. Ces lignes sont
[ My Products ] , [ My Channel ]   ,  [ LIVE SIGNAL ] HFT Spike Detector HFT Spike Detector est un outil professionnel de surveillance des ticks conçu pour analyser et mesurer en temps réel les mouvements de prix à haute fréquence (pics soudains causés par le HFT). Son objectif est de vous permettre de détecter les glissements anormaux, les lacunes de liquidité et les pics de prix au niveau milliseconde causés par le broker, à l'aide de données numériques. Comme il analyse le flux de ticks e
Plus de l'auteur
NightTrader
Ugur Oezcan
5 (1)
No grid! No martingale! No manual configuration or adjustment needed! Every trade is protected by stop loss. You can find metatrader4 version here: https://www.mql5.com/de/market/product/18571# This Expert Advisor only trades for a short time frame at night, during the ending of the New York session. It uses low volatility moments in EURUSD and enters trades based on indicators. It then manages those trades with dynamic stop losses and take profits also based on indicators.  Please find a signal
MT4 Telegram Signal
Ugur Oezcan
4.06 (17)
!!! New faeture sending Signals as VIP EMAILS MT4 Telegram Signal is tool, which sends selected trades via magic number to telegram channel, sms and email to user. Tool sends trades when open and close with chart to telegram chanel. It also sends every modification from trades to telegram. Tool can send multiple charts and magic numbers and pairs from a single chart. For this you have to fill in on the chart corresponding magic number to be sent by the chart. Send information of all type of ord
FREE
This is no martingale, grid, hedge or other averaging strategy. This expert is a classic break-out-strategy with special filter. It monitors market movements and set pending trades. If not activated in a certain time frame, new levels are set. On activation the experts trails the trade very closely. Every trade is protected by stop-loss. Best trading times are while London and USA is open. We suggest – and have tested it with – EURUSD and GBPUSD We also suggest a VPS with very fast ping times an
Night Trader EURUSD
Ugur Oezcan
4.21 (29)
The EA can trade multiple currencies. Please check our signals ( https://www.mql5.com/en/users/ugur-edin/seller ) for detailed information. No grid or martingale! No manual configuration or adjustment needed! Every trade is protected by stop loss. This Expert Advisor only trades for a short time frame at night, during the ending of the New York session. It uses low volatility moments and enters trades based on indicators. It then manages those trades with dynamic stop losses and take profits als
This tool monitors your current Expert Advisors and manages stop losses and take profits. You can customize which EAs and/or which currencies to monitor. It is primarily meant for EAs that you feel manage stop losses and/or take profits poorly. If you want this tool to be able to monitor manual trades, please use '0' (zero) as the magic number. Supports hidden stoploss and take profit Supports ATR-calculated dynamic stoploss Supports Breakeven for individual trades Supports Trailing stop Lower r
Retro Trader
Ugur Oezcan
3.9 (10)
This expert trades on price action. It does not use signals from indicators but creates a statistics-based custom channel for entry and exit of trades. Due to independence of indicators, the expert can be optimized for several currency pairs and trading times. Each trade position is protected by stop-loss, both hidden and visible. No martingale, hedging or grid. The expert uses 3 different strategies within the same channel for entry and exit. Each opens only 1 trade at a time. Please find a sig
Turbo pivot levels
Ugur Oezcan
4.5 (2)
This Expert Advisor is based on pivot points. Users can choose entry level and direct themselves. Expert use martingale strategy to recover unsuccessful trades. When going into drawdown it starts its slipping mode in which it always tries to keep the whole set of trades on a steady course level. In hedging mode, all take profits will be deleted and the basket will try to close at breakeven price. EA can also be used as normal with Stop loss. Please test before using with Stop loss. The EA can tr
This indicator shows the trend based on two configurable moving averages. A custom calculation shows market volatility in the lower frame. Higher bars mean higher volatility. The chart also shows suggestions for buy, sell or close with the help of arrows. It is possible to set minimum volatility for entry points and to set time filtered alerts. This indicator is useful to judge trends or market volatility, for example to catch good periods for scalping. Parameters Volatility Period - volatility
This EA trades mainly in the London and New York Sessions of the market. Forex Agent A is a day scalper with a bigger stop loss and a smaller take profit. Trades are opened at the first tick of the bar. In case of extended drawdown, take profits are adjusted to exit the market sooner and if at all possibly profitable. The built-in news filter prevents the opening of new trades when important news is upcoming. Entry points are determined exclusively by various indicators. Trade exits determined e
NightXploiter
Ugur Oezcan
5 (1)
Expert opens trades by level and uses no indicator. It can be used with multiple currency pairs with correct settings. Depending on the currency pair, trading sessions are mostly short before the newyork close to the middle of Japan session. Due to independence of indicators, the expert can be optimized for several currency pairs and trading times. In case of extended drawdown, take profits are adjusted to exit the market sooner and if at all possibly profitable. The built-in news filter prevent
Diamond Pattern
Ugur Oezcan
5 (1)
The diamond top and bottom are reversal patterns. It represents a rally to a new high with a drop to a support level followed by a rally to make a new high and a quick decline, breaking the support level to make a higher low. The bounce from the higher low is then followed by a rally, but making a lower high instead. Once this behavior is identified, prices then break the trend line connecting the first and second lows and start to decline further. You can find MT5 version hier Indicator shows
What is Double Top and Bottom Double top and bottom patterns are chart patterns that occur when the underlying investment moves in a similar pattern to the letter "W" (double bottom) or "M" (double top). Double top and bottom analysis is used in technical analysis to explain movements in a security or other investment, and can be used as part of a trading strategy to exploit recurring patterns. You can find MT5 version hier Indicator shows you 2 Level target and stop loss level. Stoploss level
!!! New faeture sending Signals as VIP EMAILS MT4 Telegram Signal is tool, which sends selected trades via magicno to telegram channel , sms and email to user. Tool sends trades when open and close with chart to telegram chanel. It also sends every modification from trades to telegram. Tool can send multiple charts and magicno and pairs from a single chart. For this you have to fill in on the chart corresponding magic number to be sent by the chart. You must add the URL “ http://api.telegram.o
The diamond top and bottom are reversal patterns. It represents a rally to a new high with a drop to a support level followed by a rally to make a new high and a quick decline, breaking the support level to make a higher low. The bounce from the higher low is then followed by a rally, but making a lower high instead. Once this behavior is identified, prices then break the trend line connecting the first and second lows and start to decline further. You can find MT4 version hier Indicator shows
Filtrer:
Aucun avis
Répondre à l'avis