Market Structure MTF

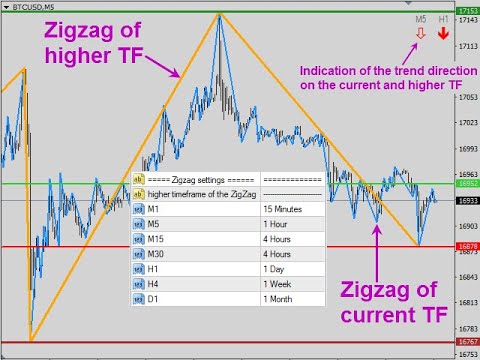
L'indicatore Market Structure MTF è un tentativo riuscito di formalizzare la struttura del movimento dei Prezzi secondo un algoritmo unico. Stabilisce inequivocabilmente qualsiasi movimento di prezzo sugli elementi costitutivi e ti consente di non perdere alcun punto di ingresso o uscita interessante.
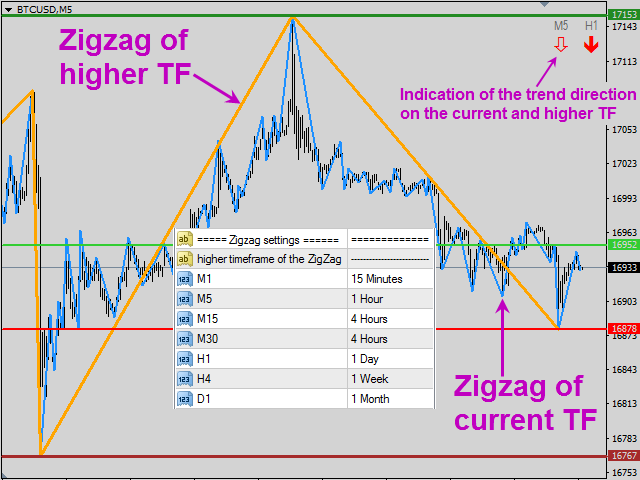
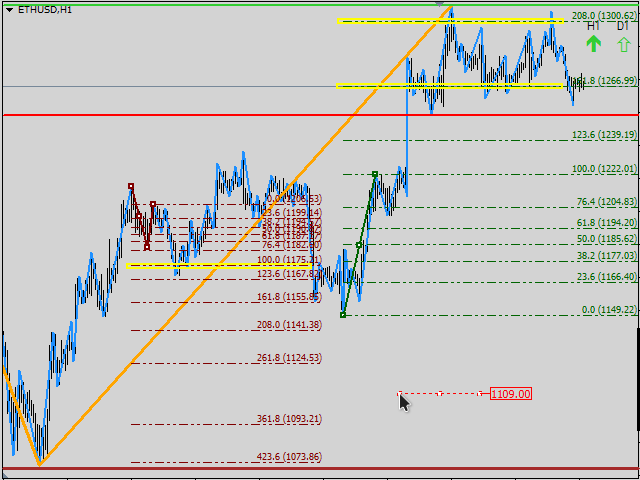
Una caratteristica importante dell'indicatore Market Structure MTF è la visualizzazione della struttura del movimento dei prezzi su due intervalli di tempo contemporaneamente – su quello attuale e su quello più vecchio a scelta dell'utente.
Nonostante la somiglianza esterna con vari zigzag, questo indicatore è fondamentalmente diverso da loro ed è privo di tutti gli svantaggi che si trovano negli zigzag: ritardi e ridisegni.
L'uso DELL'indicatore Market Structure MTF ti consente di lavorare basandosi solo sulla struttura «correzione Momentum», sia seguendo la tendenza che determinando i momenti di inversione della tendenza.
Inoltre, questo indicatore si combina perfettamente con qualsiasi sistema di trading e strategie (livelli, linee di tendenza, profilo di mercato, zone di margine, livelli di opzioni e così via) rafforzandoli e ti consente di trovare punti di ingresso all'inizio del movimento e di uscire quando cambi direzione della tendenza.
Inoltre, i seguenti strumenti sono inclusi nell'indicatore Market Structure MTF:
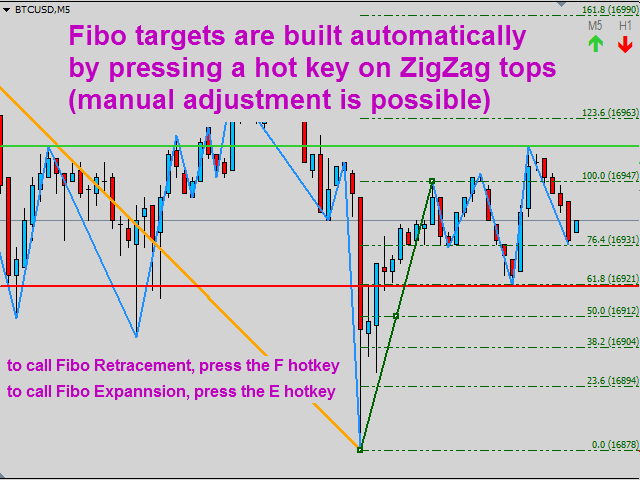
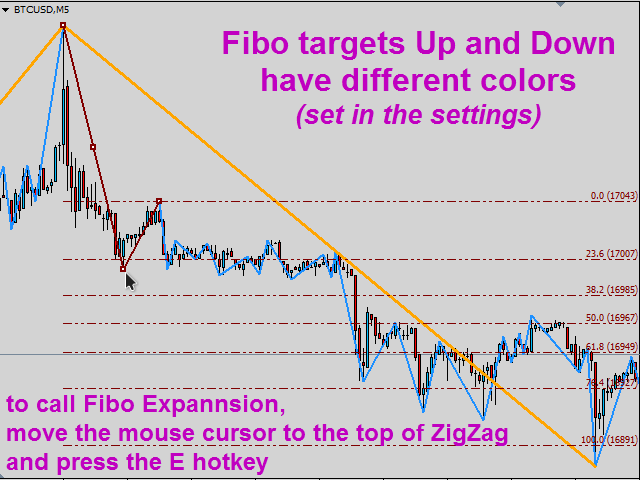
* Fibo Retracement e Fibo Expansion per identificare gli obiettivi del movimento e le aree importanti nel percorso del movimento dei Prezzi
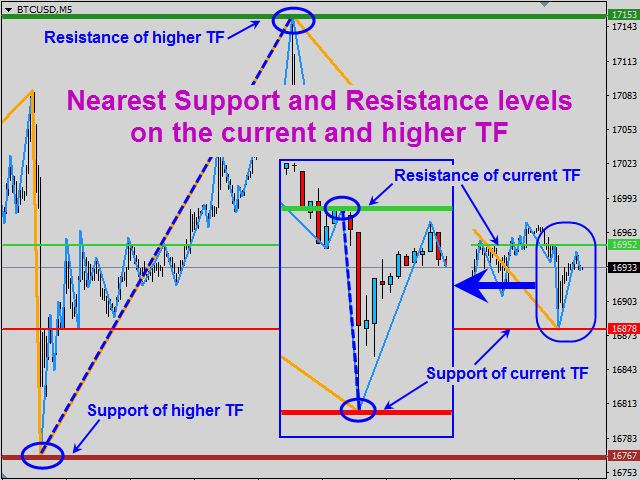
* Tracciare linee orizzontali in modalità automatica-i livelli più vicini di supporto e resistenza, determinati da importanti estremi sopra e sotto il prezzo corrente sia nel periodo di tempo corrente che in quello più vecchio.
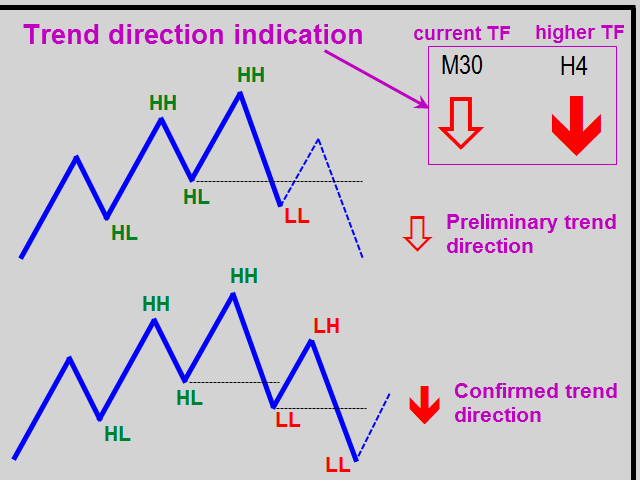
* Rilevamento automatico dello Stato del mercato sui tempi attuali e più vecchi (trend su / giù o flat) e visualizzazione grafica di queste informazioni sotto forma di frecce 
* Avvisi "intelligenti" - segni impostati premendo un pulsante. Quando si tocca il quale prezzo l'utente riceve una notifica.
* Profondità storia personalizzabile visualizzazione struttura dei Prezzi
* Tutte le possibili notifiche e avvisi disponibili nel terminale MT4
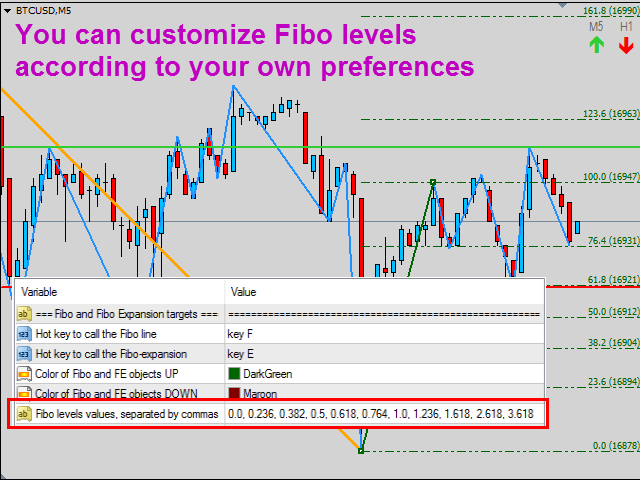
All'utente sono disponibili tutte le impostazioni di colore e le impostazioni dei tasti di scelta rapida per tutte le funzioni integrate. I livelli per gli strumenti Fibo possono anche essere impostati in base alle proprie preferenze.
Prodotti consigliati
Profit Factor
Dmitriy Moshnin
The Profit Factor indicator calculates one of the three parameters: 1 - market entry level (in the 'Calculate the' parameter - Market Open Trade), 2 - the Stop Loss level (Calculate the - Market Price Loss), 3 - the Take Profit level (Calculate the - Market Price Profit) - with a desired profit/loss ratio (Profit Factor), as well as the lot size (trade volume) according to the value of the risk percentage of available funds specified in the settings (a simpler analog is the Lot Calculation indic
MarketProfile EForex
Veridiana Adorno Kendrick
Market Profile Shows where the price has spent more time, highlighting important levels that can be used in trading. It is a powerful tool which is designed to take the fundamental components which comprise every market; price/volume/time, and visually display their relationship in real-time as the market develops for a pre-determined time period. Very powerful tool!
BoxChart MT4
Evgeny Shevtsov
4.4 (5)
The market is unfair if only because 10% of participants manage 90% of funds. An ordinary trader has slim changes to stand against these "vultures". This problem can be solved. You just need to be among these 10%, learn to predict their intentions and move with them. Volume is the only preemptive factor that faultlessly works on any timeframe and symbol. First, the volume appears and is accumulated, and only then the price moves. The price moves from one volume to another. Areas of volume accumu
VR Grid
Vladimir Pastushak
5 (3)
L'indicatore Griglia VR è progettato per creare una griglia grafica con impostazioni definite dall'utente. A differenza della griglia standard , VR Grid viene utilizzata per costruire livelli circolari . A seconda della scelta dell'utente, il passaggio tra i livelli rotondi può essere arbitrario. Inoltre, a differenza di altri indicatori e utilità, VR Grid mantiene la posizione della griglia anche quando cambia l'intervallo di tempo o si riavvia il terminale. È possibile ottenere impostazioni, f
FREE
L'indicatore costruisce le quotazioni attuali, che possono essere confrontate con quelle storiche e su questa base fanno una previsione del movimento dei prezzi. L'indicatore ha un campo di testo per una rapida navigazione fino alla data desiderata. Opzioni: Simbolo - selezione del simbolo che visualizzerà l'indicatore; SymbolPeriod - selezione del periodo da cui l'indicatore prenderà i dati; IndicatorColor - colore dell'indicatore; HorisontalShift - spostamento delle virgolette disegnate d
Chinetti pip collector XL is a complete turnkey trading system. If a trader does not yet have his own trading system, he can apply Chinetti pip collector XL to trading. Trading with this indicator is very easy. Even a beginner in Forex can handle it. Trading rules: wait for the indicator to start drawing a blue line. This means that the price trend is starting now. Now we are waiting for the indicator to analyze the market and draw an up arrow on the chart. At this point, we open a buy order.
VSA Histogram
Richard Bystricky
VSA - P (Volume Spread Analysis) Period-Based Histogram is a tool that visually represents market volume dynamics using Volume Spread Analysis principles, with a focus on highlighting key volume changes over specific time periods. The histogram captures changes in volume and price spread relationships in real-time, enabling traders to detect early signals of accumulation, distribution, and shifts in buying or selling pressure. Indicator is non repainting and working with real-time on tick data.
Adjustable Volume Profile Indicator The Adjustable Volume Profile is a custom MetaTrader 4 (MT4) indicator designed to visually display the volume distribution of a financial instrument across a specific price range and time period. This indicator allows traders to analyze the volume profile based on either real volume or tick volume, helping to identify key levels of support, resistance, and market activity. Key Features: Customizable Timeframe: The indicator can be set to any available timefr
Dollar Mint Indicator
David Mwaniki Mbugua
Dollar mint indicator is a special workmanship with years of experience in forex.   Dollar mint ea is a fully non repaint indicator optimised with price action data such that once it gives you a signal t . The indicator   can be used to trade anything on the mt4 with much ease. Benefits ; Fully non repaint Use in any timeframe Use in all the available tradable assets on mt4 Best to use on h4. It generates fully analysed buy and sell signals based on trend and also filters out retracements and
AQ XFifteen
HIT HYPERTECH INNOVATIONS LTD
4 (7)
Χ15 indicator is a MetaTrader 4 tool that allows you to BUILD & BACKTEST ON REAL TIME your own strategies quickly, easily and efficiently. It contains 15 of the most popular technical analysis indicators that you can use, each one in a different way. Choose the indicators that you want to use, select how you will use them and you will see on the chart BUY (green) and SELL (red) arrows implementing your strategy. Choose Take Profit and Stop Loss and you will see the results of your strategy with
FREE
Auto Fibo Pro m
DMITRII GRIDASOV
Indicatore "Auto FIBO Pro" Crypto_Forex: è un ottimo strumento ausiliario nel trading! - L'indicatore calcola e posiziona automaticamente sul grafico i livelli di Fibo e le linee di tendenza locali (colore rosso). - I livelli di Fibonacci indicano le aree chiave in cui il prezzo può invertirsi. - I livelli più importanti sono 23,6%, 38,2%, 50% e 61,8%. - Puoi usarlo per lo scalping di inversione o per il trading di zone grid. - Ci sono molte opportunità per migliorare il tuo sistema attuale us
AQ XFifteen Pro
HIT HYPERTECH INNOVATIONS LTD
Χ15 indicator is a MetaTrader 4 tool that allows you to  BUILD & BACKTEST ON REAL TIME  your own strategies quickly, easily and efficiently. It contains  15 of the most popular technical analysis indicators  that you can use, each one in a different way. Choose the indicators that you want to use, select how you will use them and you will see on the chart BUY (green) and SELL (red) arrows implementing your strategy. Choose Take Profit and Stop Loss and you will see the results of your strategy w
Volume Compair
Thiago Pereira Pinho
Professional Cumulative Delta & Volume Median Indicator Track   real buying/selling pressure   with this powerful volume analysis tool. The   Volume Compare Indicator   combines   Cumulative Delta   and   Volume Medians   to help you identify institutional activity, imbalances, and potential reversals. Key Features: Cumulative Delta Histogram   – Visualizes net buying vs. selling volume in real-time. Buy/Sell Volume Medians   – Horizontal lines showing average buy & sell volume levels. Smart Vo
Questo è un prodotto gratuito che puoi utilizzare per le tue esigenze! Inoltre apprezzo molto i tuoi feedback positivi! Grazie mille! Clicca qui per vedere robot e indicatori di trading di alta qualità! Indicatore Crypto_Forex: candele Heiken Ashi per MT4. Nessuna riverniciatura. - Heiken_Ashi_Candles ha una grande combinazione con l'indicatore Trend Line MA come nell'immagine. - L'indicatore Heiken_Ashi_Candles è un indicatore ausiliario molto utile per rendere la tendenza più visibile. - È
FREE
The indicator analyzes the change in the minimum and maximum prices of the previous bars fixing the entrance of the big players. If the change (delta) increases, a signal is displayed on the graph in the form of an arrow. At the same time, virtual trade on history is carried out. In case of a repeat of the signal, the positions are increased (refilling). Thus the lot of positions can differ. The results of virtual trading in the form of losses / losses, profitability, drawdown and transaction li
The Pairs Spread indicator has been developed for the popular strategy known as pairs trading, spread trading, or statistical arbitrage. This indicator measures the distance (spread) between prices of two directly (positively) correlated instruments and shows the result as a curve with standard deviations. So, traders can quickly identify when the instruments are too far apart and use this information for trade opportunities.  How to use the Pairs Spread indicator Best results are attained whe
Gold Venamax MT4
Sergei Linskii
5 (1)
Gold Venamax : questo è il miglior indicatore tecnico azionario. L'algoritmo dell'indicatore analizza il movimento dei prezzi di un asset e riflette la volatilità e le potenziali zone di ingresso. Caratteristiche dell'indicatore: Questo è un super indicatore con Magic e due blocchi di frecce di tendenza per un trading comodo e redditizio. Sul grafico viene visualizzato il pulsante rosso per cambiare blocco. Magic è impostato nelle impostazioni dell'indicatore, in modo da poter installare l'indi
Nuova versione più accurata dell'indicatore Xmaster. Più di 200 trader di tutto il mondo hanno condotto più di 15.000 test di diverse combinazioni di questo indicatore sui loro PC per ottenere la formula più efficace e precisa. E qui ti presentiamo l'indicatore "Xmaster formula indicator forex no repaint", che mostra segnali accurati e non ridipinge. Questo indicatore invia anche segnali al trader tramite e-mail e push. Con l'arrivo di ogni nuovo tick, analizza costantemente il mercato in base
Blahtech Market Profile
Blahtech Limited
4.53 (15)
Was: $249  Now: $99   Market Profile defines a number of day types that can help the trader to determine market behaviour. A key feature is the Value Area, representing the range of price action where 70% of trading took place. Understanding the Value Area can give traders valuable insight into market direction and establish the higher odds trade. It is an excellent addition to any system you may be using. Blahtech Limited presents their Market Profile indicator for the MetaTrader community. Ins
Simply The Best Pro
Szymon Palczynski
5 (1)
This indicator displays the histogram and arrows on chart. When Simple The Best Pro are placed on a chart, they identify the trend.  The color of may be blue or red. The blue color stands for upside moves and the red color stands for downside trends. The indicator offers to set Stop Loss (SL) and  Take Profit (TP)  setting. The default value is ATR. Indicator has automatic optimization. The STB is a unique indicator that shows the tendency (button Bars) of a particular signals. The STB tells us
Likdon
Nadiya Mirosh
Using the Likdon Forex indicator algorithm, you can quickly determine the current trend in the market. The Elephant indicator tracks long trends and can be used without restrictions on instruments or timeframes. With its help, you can try to predict future price values, but its main purpose is to generate buy and sell signals. The indicator tracks the market trend, ignoring sharp fluctuations and market noise around the average price. It implements a technical analysis method based on the assu
Extremes Day
Aleksey Maltsev
v. 1.0 This indicator can show with maximum accuracy up to 1 bar the presence of a Maximum/minimum on the chart, regardless of the timeframe. It has a flexible configuration. You can use either one value on all TF, or you can use your own value on each TF individually. This indicator is already being improved and those who purchase it receive all updates for free. Next, it is planned to display an indication of the strength of the pivot point at each extremum (in % or in color drawing). It wi
Forecast Pro
PAOLO BONFANTI
Questo tipo di indicatore fa previsioni leggendo il volume delle candele. Il valore ATR, compreso nell'indicatore FORECAST PRO,è confrontato con i livelli di supporto e resistenza con le medie dei prezzi di apertura e chiusura delle candele. Creando così segnali di ingresso sul mercato tramite frecce colorate. Le frecce saranno confermate una volta che si è verificato il breakout.
Market Dynamics
Thomas Bradley Butler
Market Dynamics è per lo scalping delle tendenze. Il blu è comprare e il rosso è vendere. Le linee sono aree di consolidamento dei prezzi e le normali candele da bar non sono decise. Il prezzo si consoliderà tra le linee di supporto e resistenza e quindi si verificherà un breakout dell'azione dei prezzi fuori dalle aree. Pic aree per scalpare sopra o sotto e seguire le tendenze principali o scambi giornalieri per scalpi.
Profit Loss Meter
Alexander Sevastyanov
5 (3)
This indicator allow you to measure Profit/Loss of current, closed or future trade in account currency and estimate margin level at the trade close point. Profit/Loss indicator is based on MT4 native Crosshair instrument and has following inputs:  Trade Direction = Buy/Sell Lot size = 0.1 Font size = 8 Font color = DeepSkyBlue Offset horizontal Offset vertical   
FREE
Blahtech Supply Demand
Blahtech Limited
4.58 (36)
Was: $299  Now: $99   Supply Demand uses previous price action to identify potential imbalances between buyers and sellers. The key is to identify the better odds zones, not just the untouched ones. Blahtech Supply Demand indicator delivers functionality previously unavailable on any trading platform. This 4-in-1 indicator not only highlights the higher probability zones using a multi-criteria strength engine, but also combines it with multi-timeframe trend analysis, previously confirmed swings
Daily Candle Predictor è un indicatore che prevede il prezzo di chiusura di una candela. L'indicatore è destinato principalmente all'uso sui grafici D1. Questo indicatore è adatto sia per il trading forex tradizionale che per il trading di opzioni binarie. L'indicatore può essere utilizzato come sistema di trading autonomo o può fungere da aggiunta al sistema di trading esistente. Questo indicatore analizza la candela corrente, calcolando alcuni fattori di forza all'interno del corpo della cande
VolumeDeltaM1
Stanislav Korotky
3.25 (4)
This indicator provides tick volume delta analysis on M1 timeframe. It monitors up and down ticks and sums them up as separate volumes for buys and sells, as well as their delta volumes, and volume clusters on price scale within a specified number of bars. This indicator complements VolumeDelta , which uses similar algorithms but does not process ticks and therefore cannot work on M1. VolumeDelta can show its signals on entire history because it reads M1 volumes for calculations on higher timefr
BoxInside MT4
Evgeny Shevtsov
4.83 (6)
This indicator calculates the volume profile and places labels that correspond to the VAH, VAL and POC levels, for each candle individually. Indicator operation features The indicator works on the timeframes from M5 to MN, but it uses the history data of smaller periods: M1 - for periods from M5 to H1, M5 - for the H4 period, M30 - for the D1 period, H4 - for the W1 period, D1 - for the MN period. The color and location of the VAL, VAH and POC labels on the current candle are considered to be c
FREE
Il   Donchian Time Sync Analyzer   aggiunge una potente dimensione   multi-timeframe   all'analisi classica del canale di Donchian, consentendo ai trader di monitorare simultaneamente   la forza del trend   e i potenziali   segnali di inversione   su cinque diversi periodi del grafico. Questo indicatore avanzato calcola i massimi più alti e i minimi più bassi nei timeframe selezionati, generando   chiari segnali visivi   che aiutano a identificare la convergenza della direzione del trend su più
Gli utenti di questo prodotto hanno anche acquistato
Scalper Inside PRO
Alexey Minkov
4.74 (69)
An exclusive indicator that utilizes an innovative algorithm to swiftly and accurately determine the market trend. The indicator automatically calculates opening, closing, and profit levels, providing detailed trading statistics. With these features, you can choose the most appropriate trading instrument for the current market conditions. Additionally, you can easily integrate your own arrow indicators into Scalper Inside Pro to quickly evaluate their statistics and profitability. Scalper Inside
Attualmente 20% di sconto! La soluzione migliore per ogni principiante o trader esperto! Questo software per cruscotti funziona su 28 coppie di valute. Si basa su 2 dei nostri indicatori principali (Advanced Currency Strength 28 e Advanced Currency Impulse). Offre un'ottima panoramica dell'intero mercato Forex. Mostra i valori di forza delle valute avanzate, la velocità di movimento delle valute e i segnali per 28 coppie Forex in tutti i (9) timeframe. Immaginate come migliorerà il vostro tra
GOLD Impulse with Alert
Bernhard Schweigert
4.64 (11)
Questo indicatore è una super combinazione dei nostri 2 prodotti Advanced Currency IMPULSE with ALERT  +   Currency Strength Exotics . Funziona per tutti i time frame e mostra graficamente l'impulso di forza o debolezza per le 8 valute principali più un simbolo! Questo indicatore è specializzato nel mostrare l'accelerazione della forza delle valute per qualsiasi simbolo come oro, coppie esotiche, materie prime, indici o futures. Primo nel suo genere, qualsiasi simbolo può essere aggiunto all
Volatility Trend System - un sistema di trading che fornisce segnali per le voci. Il sistema di volatilità fornisce segnali lineari e puntuali nella direzione del trend, nonché segnali per uscirne, senza ridisegnare e ritardi. L'indicatore di tendenza monitora la direzione della tendenza a medio termine, mostra la direzione e il suo cambiamento. L'indicatore di segnale si basa sui cambiamenti della volatilità e mostra gli ingressi nel mercato. L'indicatore è dotato di diversi tipi di avvisi. Pu
Indicatore Miraculous – Strumento Forex e Binario 100% Non-Repaint Basato sul Quadrato di Nove di Gann Questo video presenta l' Indicatore Miraculous , uno strumento di trading altamente accurato e potente, sviluppato specificamente per i trader di Forex e Opzioni Binarie . Ciò che rende unico questo indicatore è la sua base sul leggendario Quadrato di Nove di Gann e sulla Legge della Vibrazione di Gann , rendendolo uno degli strumenti di previsione più precisi disponibili nel trading moderno. L
Currency Strength Exotics
Bernhard Schweigert
4.88 (33)
ATTUALMENTE SCONTATO DEL 20%! La soluzione migliore per qualsiasi principiante o trader esperto! Questo indicatore è specializzato nel mostrare la forza della valuta per qualsiasi simbolo come coppie esotiche, materie prime, indici o futures. È il primo nel suo genere, qualsiasi simbolo può essere aggiunto alla nona riga per mostrare la vera forza della valuta di Oro, Argento, Petrolio, DAX, US30, MXN, TRY, CNH ecc. Si tratta di uno strumento di trading unico, di alta qualità e conveniente pe
Dynamic Forex28 Navigator
Bernhard Schweigert
4.43 (7)
Dynamic Forex28 Navigator - Lo strumento di trading Forex di nuova generazione. ATTUALMENTE SCONTATO DEL 49%. Dynamic Forex28 Navigator è l'evoluzione dei nostri indicatori popolari di lunga data, che combinano la potenza di tre in uno: Advanced Currency Strength28 Indicator (695 recensioni) + Advanced Currency IMPULSE con ALERT (520 recensioni) + CS28 Combo Signals (Bonus). Dettagli sull'indicatore https://www.mql5.com/en/blogs/post/758844 Cosa offre l'indicatore di forza di nuova generazione?
Algo Pumping MT4
Ihor Otkydach
4.69 (16)
PUMPING STATION – La tua strategia personale "all inclusive" Ti presentiamo PUMPING STATION — un indicatore Forex rivoluzionario che trasformerà il tuo modo di fare trading in un’esperienza efficace ed entusiasmante. Non si tratta solo di un assistente, ma di un vero e proprio sistema di trading completo con potenti algoritmi che ti aiuteranno a operare in modo più stabile. Acquistando questo prodotto, riceverai GRATUITAMENTE: File di configurazione esclusivi: per un'impostazione automatica e pr
Trend Lines PRO
Roman Podpora
5 (1)
LINEE DI TENDENZA PRO       Aiuta a capire dove il mercato sta realmente cambiando direzione. L'indicatore mostra reali inversioni di tendenza e punti in cui i principali attori rientrano. Vedi  Linee BOS   Cambiamenti di tendenza e livelli chiave su timeframe più ampi, senza impostazioni complesse o rumore inutile. I segnali non vengono ridisegnati e rimangono sul grafico dopo la chiusura della barra. Cosa mostra l'indicatore: Cambiamenti reali       tendenza (linee BOS) Una volta che un segna
Supply and Demand Dashboard PRO
Bernhard Schweigert
4.8 (20)
Attualmente 20% di sconto! Questo cruscotto è un software molto potente che lavora su più simboli e fino a 9 timeframe. Si basa sul nostro indicatore principale (migliori recensioni: Advanced Supply Demand ).   Il cruscotto offre un'ottima panoramica. Mostra:    Valori filtrati di domanda e offerta, compresa la valutazione della forza delle zone, distanze dei pip da/all'interno delle zone, Evidenzia le zone annidate, Fornisce 4 tipi di allarmi per i simboli scelti in tutti i (9) time-frames.
Presentiamo l'Indicatore F-16 Plane, uno strumento all'avanguardia per MT4 progettato per rivoluzionare la tua esperienza di trading. Ispirato alla velocità e alla precisione imbattibili dell'aereo da combattimento F-16, questo indicatore combina algoritmi avanzati e tecnologia all'avanguardia per offrire prestazioni senza precedenti sui mercati finanziari. Con l'Indicatore F-16 Plane, volerai al di sopra della concorrenza poiché fornisce analisi in tempo reale e genera segnali di trading estrem
Friends, we present to your attention our new Forex Gump Laser indicator. Since there are no designers in our team, but mainly mathematicians, financiers, programmers and traders, we did not make any special changes in the indicator design. In appearance, it resembles the usual Forex Gump. On the other hand, Forex Gump has become not just the name of an indicator, it is a brand. And we try to preserve the corporate identity in all its varieties. The whole essence of the indicator in its operatio
Shogun Trade
Yuki Miyake
5 (1)
SHOGUN Trade - The Shocking Truth of 16 Years Unoptimized. Strategic Market Structure & The Art of Maximizing Gains. The Truth of "16 Years" That Even Stunned the Developer First, please take a look at the attached image (backtest results). This is the verification result for USDJPY H1 for a full 16 years, from January 1, 2010, to January 1, 2026. To be clear: This is NOT an EA (Expert Advisor) for sale. It is a manual trading indicator system. However, I dare to present this graph to you and
Meravith
Ivan Stefanov
5 (1)
L'indicatore analizza il volume da ogni punto e calcola i livelli di esaurimento del mercato per quel volume. È composto da tre linee: Linea di esaurimento del volume rialzista Linea di esaurimento del volume ribassista Una linea che indica la tendenza del mercato. Questa linea cambia colore per riflettere se il mercato è rialzista o ribassista. Puoi analizzare il mercato da qualsiasi punto di partenza tu scelga. Una volta che una linea di esaurimento del volume è raggiunta, identifica un nuovo
Indicatore in anticipo   determina i livelli e le zone di inversione del mercato , consente di attendere che il prezzo ritorni al livello ed entrare all'inizio di un nuovo trend, e non alla sua fine. Lui mostra   livelli di inversione   dove il mercato conferma un cambio di direzione e forma un ulteriore movimento. L'indicatore funziona senza ridisegnare, è ottimizzato per qualsiasi strumento e rivela il suo massimo potenziale quando abbinato al   LINEE DI TENDENZA PRO   indicatore. Scanner st
Questo indicatore è un indicatore per l'analisi automatica delle onde perfetto per il trading pratico! Caso... Nota:   non sono abituato a usare nomi occidentali per la classificazione delle onde a causa dell'influenza della convenzione di denominazione di Tang Lun (Tang Zhong Shuo Zen), ho chiamato l'onda base come   penna   e la banda dell'onda secondaria come   segmento   At allo stesso tempo, il segmento ha la direzione del trend. La denominazione   è principalmente segmento di trend   (que
Gold Channel is a volatility-based indicator, developed with a specific timing algorithm for the XAUUSD pair, which consists of finding possible corrections in the market. This indicator shows two outer lines, an inner line (retracement line) and an arrow sign, where the theory of the channel is to help identify overbought and oversold conditions in the market. The market price will generally fall between the boundaries of the channel. If prices touch or move outside the channel it is a tradi
Adaptive Volatility Range [AVR] is a powerful tool for identifying key trend reversal points. AVR accurately reflects the Average True Range (ATR) of volatility, taking into account the Volume-Weighted Average Price (VWAP). The indicator adapts to any market volatility by calculating the average volatility over a specific period, ensuring a stable rate of profitable trades. You receive not just an indicator but a professional automated trading system , AVR-EA . Advantages: Automated Trading Sys
Entry Points Pro
Yury Orlov
4.6 (173)
Indicatore top per MT5 che fornisce segnali accurati per entrare in un trade senza riverniciare! Può essere applicato a qualsiasi attività finanziaria: forex, criptovalute, metalli, azioni, indici.  La versione MT5 è qui Fornirà segnali di trading piuttosto precisi e ti dirà quando è meglio aprire un trade e chiuderlo. Guarda il video (6:22) con un esempio di elaborazione di un solo segnale che ha ripagato l'indicatore! La maggior parte dei trader migliora i propri risultati di trading dura
Hidden Cycles
Lev Vladimirovic Marushkin
5 (1)
The Only 100% Universal Tool! Stop trading against nature! This is your chance to secure the only indicator rooted in the absolute laws that govern the entire universe. Most tools guess—this one reveals the truth. Buy another toy or buy the truth. Your choice... Based on Universal Laws — NOT Some Guy’s Algorithm: Let the market adjust to the Hidden Cycles Geometry — not the other way around. Most indicators are based on a man-made formula. They often lag, fail over time, or need constant re-o
Presentazione       Quantum Trend Sniper Indicator   , l'innovativo indicatore MQL5 che sta trasformando il modo in cui identifichi e scambi le inversioni di tendenza! Sviluppato da un team di trader esperti con un'esperienza di trading di oltre 13 anni,       Indicatore Quantum Trend Sniper       è progettato per spingere il tuo viaggio di trading verso nuove vette con il suo modo innovativo di identificare le inversioni di tendenza con una precisione estremamente elevata. *** Acquista Quantum
PROFESSIONAL FOOTPRINT CHART INDICATOR A Footprint Chart is an advanced order flow visualization tool that displays the volume traded at each price level within a candlestick. Unlike traditional candlestick charts that only show open, high, low, and close prices, footprint charts reveal the  battle between buyers and sellers  at every price level. KEY CONCEPT:   Footprint charts show WHERE volume occurred, not just HOW MUCH volume occurred. This is critical for understanding institutional activ
Quantum Breakout Indicator PRO
Bogdan Ion Puscasu
4.96 (26)
Presentazione       Quantum Breakout PRO   , l'innovativo indicatore MQL5 che sta trasformando il modo in cui scambi le zone di breakout! Sviluppato da un team di trader esperti con un'esperienza di trading di oltre 13 anni,   Quantum Breakout PRO   è progettato per spingere il tuo viaggio di trading a nuovi livelli con la sua strategia innovativa e dinamica della zona di breakout. Quantum Breakout Indicator ti fornirà frecce di segnalazione sulle zone di breakout con 5 zone target di profitt
The Super Arrow Indicator provides non-repainting buy and sell signals with exceptional accuracy. Key Features No repainting – confirmed signals remain fixed Clear visual arrows: green for buy, red for sell Real-time alerts via pop-up, sound, and optional email Clean chart view with no unnecessary clutter Works on all markets: Forex, gold, oil, indices, crypto Adjustable Parameters TimeFrame Default: "current time frame" Function: Sets the time frame for indicator calculation Options: Can be set
OrderFlow Absorption – Indicatore professionale di Delta e Segnali di Assorbimento per MT4 Sblocca la potenza della vera analisi del flusso degli ordini con OrderFlow Absorption – l’indicatore definitivo di istogramma delta e segnali di assorbimento per MetaTrader 4. Progettato per i trader che vogliono vedere cosa succede davvero dietro ogni movimento di prezzo, questo strumento rivela la pressione nascosta di acquisto/vendita e gli eventi di assorbimento che muovono il mercato. Caratteristiche
ATTUALMENTE SCONTATO DEL 26%!! Questo indicatore è una super combinazione di entrambi i nostri indicatori principali ( Advanced Currency Strength 28   &  Advanced Currency IMPULSE with ALERT  ). Mostra i valori di forza della valuta per unità di TICK e segnali di allerta per 28 coppie Forex. È possibile utilizzare 11 diverse unità di Tick. Si tratta di 1, 2, 3, 4, 5, 6, 10, 12, 15, 20 e 30 secondi. La barra dell'unità di tick nella finestra secondaria verrà mostrata e spostata a sinistra quand
PZ Divergence Trading
PZ TRADING SLU
5 (2)
Unlock hidden profits: accurate divergence trading for all markets Tricky to find and scarce in frequency, divergences are one of the most reliable trading scenarios. This indicator finds and scans for regular and hidden divergences automatically using your favourite oscillator. [ Installation Guide | Update Guide | Troubleshooting | FAQ | All Products ] Easy to trade Finds regular and hidden divergences Supports many well known oscillators Implements trading signals based on breakouts Display
Elliott Wave Trend was designed for the scientific wave counting. This tool focuses to get rid of the vagueness of the classic Elliott Wave Counting using the guideline from the template and pattern approach. In doing so, firstly Elliott Wave Trend offers the template for your wave counting. Secondly, it offers Wave Structural Score to assist to identify accurate wave formation. It offers both impulse wave Structural Score and corrective wave Structure Score. Structural Score is the rating to sh
The Nihilist 5.0 Indicator includes Forexalien and Nihilist Easy Trend trading strategies and systems. It is composed of an MTF Dashboard where you can analyze the different input possibilities of each strategy at a glance. It has an alert system with different types of configurable filters. You can also configure which TF you want to be notified on your Metatrader 4 platform and Mobile application The indicator has the option to view how could be a TP and SL by using ATR or fixed points, even w
Current event:  https://c.mql5.com/1/326/A2SR2025_NoMusic.gif R. Cos'è l'A2SR ?   * È un indicatore tecnico leader (nessuna riverniciatura, nessun ritardo). -- Guida : -- su https://www.mql5.com/en/blogs/post/734748/page4#comment_16532516 -- e https://www.mql5.com/en/users/yohana/blog A2SR ha una tecnica speciale per determinare i livelli di supporto (domanda) e resistenza (offerta). A differenza del modo ordinario che abbiamo visto in rete, A2SR ha un concetto originale nel determinare i li
Altri dall’autore
Bar Size MT4
Mikhail Tcvetkov
5 (3)
The technical indicator, in real time, searches for candlesticks that exceed the size set in the settings and gives signals about them. As a rule, such abnormally large candles appear either at the beginning of strong impulses or at the end of a directional price movement. At the beginning of the pulse, the signal can serve as a basis for searching for an entry point, at the end of the movement, it is a sign of a climax and may indicate the near end of the trend. The reference size for filtering
FREE
Trigger KX5
Mikhail Tcvetkov
5 (1)
L'indicatore in tempo reale fornisce segnali di acquisto e vendita. Quando si sceglie la direzione della tendenza principale, circa il 75-80% dei segnali viene lavorato in profitto. Assolutamente tutti i segnali rimangono sul grafico e non cambiano la loro posizione, quindi puoi facilmente testare il lavoro dell'indicatore sia sulla storia che nel tester delle strategie.  Le impostazioni dell'indicatore semplici e logiche: il parametro Velocity è responsabile per il numero e la frequenza dei seg
Filtro:
Nessuna recensione
Rispondi alla recensione