Market Structure MTF

L'indicateur MTF Market Structure est une tentative réussie de formaliser la structure du mouvement des prix selon un algorithme unique. Il organise sans équivoque tout mouvement de prix sur les éléments constitutifs et vous permet de ne pas manquer un seul point d'entrée ou de sortie intéressant.
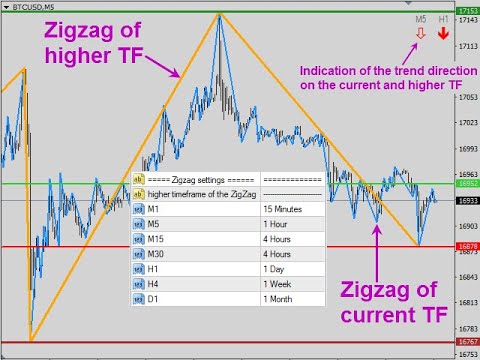
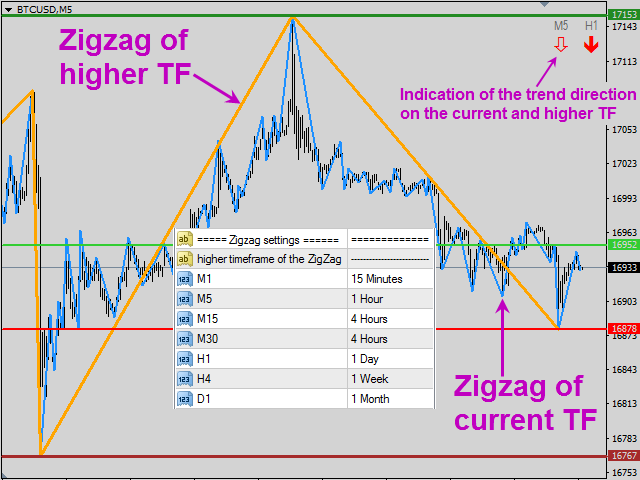
Une caractéristique importante de l'indicateur Market structure MTF est la visualisation de la structure du mouvement des prix à la fois sur deux périodes-sur le courant et sur n'importe quel supérieur au choix de l'utilisateur.
Malgré la similitude externe avec les différents Zigzags, cet indicateur est fondamentalement différent d'eux et dépourvu de tous les inconvénients qui sont dans les Zigzags – retards et repeindre.
L'application de l'indicateur Market structure MTF vous permet de travailler en s'appuyant uniquement sur la structure «Momentum – correction», à la fois en suivant la tendance et en déterminant les moments d'inversion de la tendance.
En outre, cet indicateur est parfaitement combiné avec tous les systèmes de négociation et de stratégies (niveaux, lignes de tendance, profil du marché, zones de marge, niveaux d'options, etc.) les renforcer, et vous permet de trouver des points d'entrée au tout début du mouvement et de sortir lorsque vous changez la direction de la tendance.
En outre, les outils suivants sont inclus dans l'indicateur Market Structure MTF:
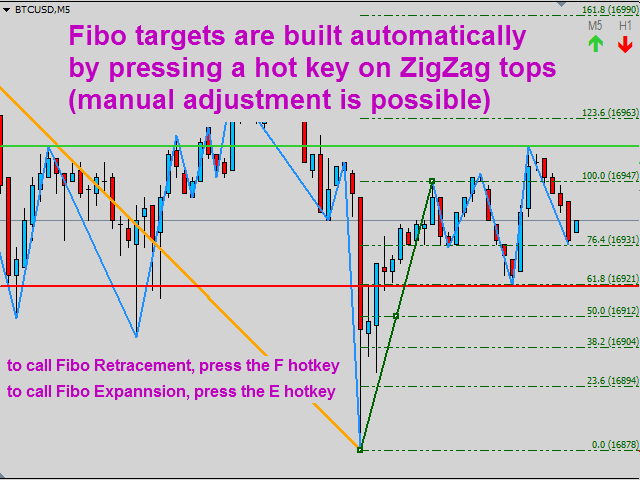
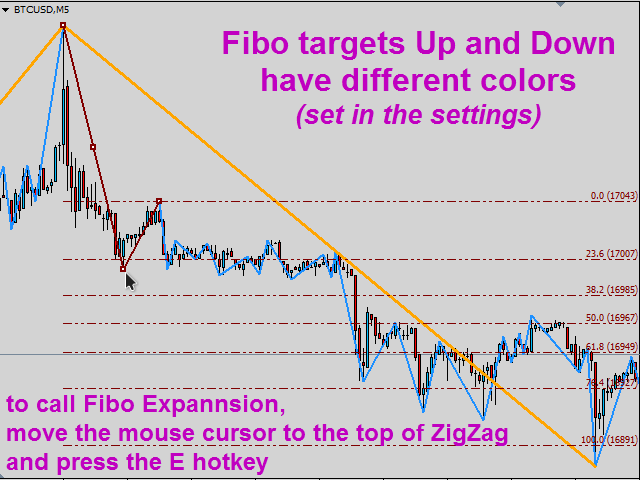
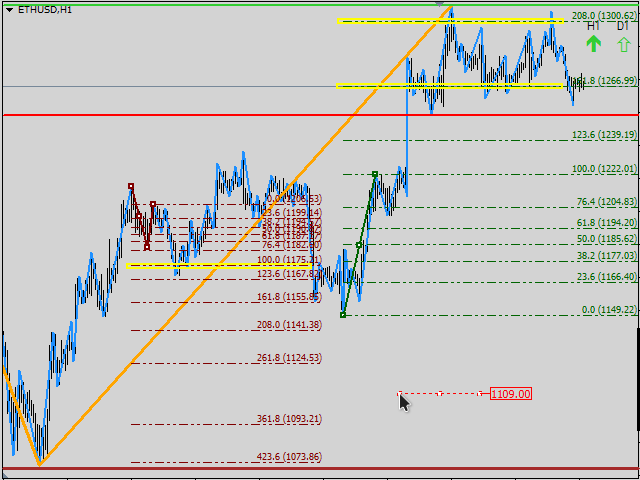
* FIBO Retracement et Fibo Expansion pour identifier les objectifs de mouvement et les zones importantes sur le chemin du mouvement des prix
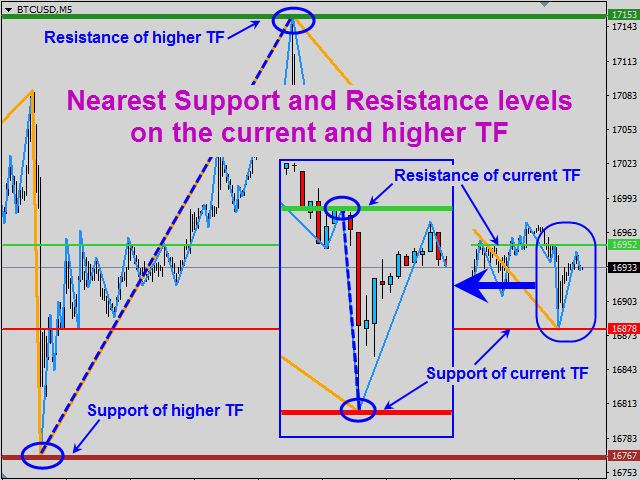
* Construction automatique de lignes horizontales - les niveaux de support et de résistance les plus proches, déterminés par des extrêmes importants au-dessus et au-dessous du prix actuel, à la fois sur le calendrier actuel et le plus ancien.
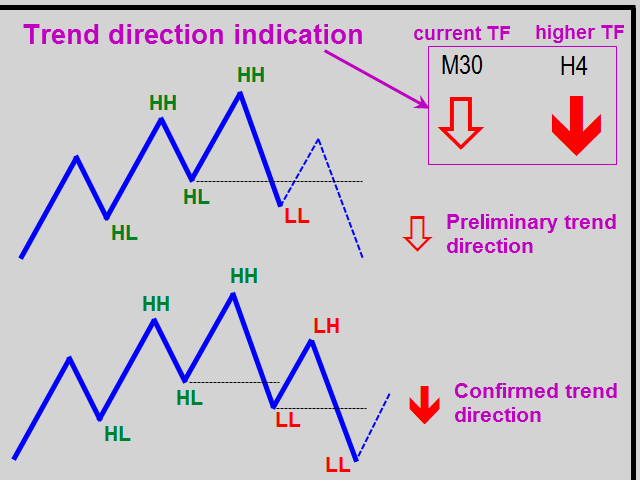
* Détection automatique de l'état du marché sur les délais actuels et anciens (tendance haut / bas ou plat) et affichage graphique de ces informations sous la forme de flèches 
* Alertes "intelligentes" - marques affichées en appuyant sur un bouton. Lorsque vous touchez un prix, l'utilisateur reçoit une notification.
* Profondeur personnalisable de l'historique d'affichage de la structure de prix
• Toutes les notifications et alertes possibles disponibles dans le terminal MT4
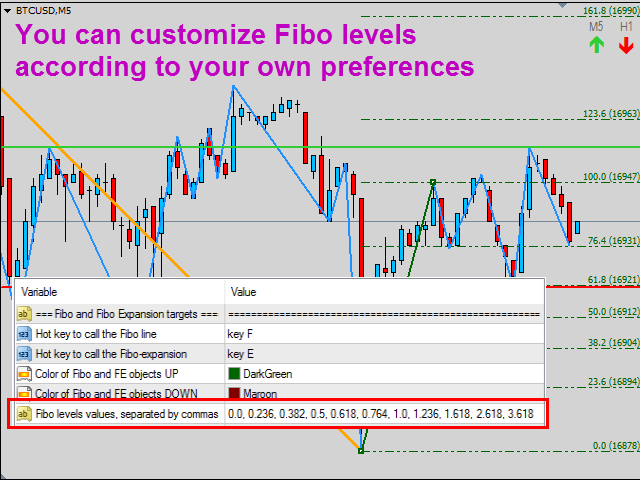
Tous les paramètres de couleur et les raccourcis clavier pour toutes les fonctions intégrées sont disponibles pour l'utilisateur. Vous pouvez également définir des niveaux pour les outils FIBO en fonction de vos préférences.
Produits recommandés
L'indicateur construit les cotations actuelles, qui peuvent être comparées aux cotations historiques et, sur cette base, faire une prévision de l'évolution des prix. L'indicateur dispose d'un champ de texte pour une navigation rapide jusqu'à la date souhaitée. Option : Symbole - sélection du symbole que l'indicateur affichera ; SymbolPeriod - sélection de la période à partir de laquelle l'indicateur prendra des données ; IndicatorColor - couleur de l'indicateur ; HorisontalShift - décalage
The Profit Factor indicator calculates one of the three parameters: 1 - market entry level (in the 'Calculate the' parameter - Market Open Trade), 2 - the Stop Loss level (Calculate the - Market Price Loss), 3 - the Take Profit level (Calculate the - Market Price Profit) - with a desired profit/loss ratio (Profit Factor), as well as the lot size (trade volume) according to the value of the risk percentage of available funds specified in the settings (a simpler analog is the Lot Calculation indic
MarketProfile EForex
Veridiana Adorno Kendrick
Market Profile Shows where the price has spent more time, highlighting important levels that can be used in trading. It is a powerful tool which is designed to take the fundamental components which comprise every market; price/volume/time, and visually display their relationship in real-time as the market develops for a pre-determined time period. Very powerful tool!
BoxChart MT4
Evgeny Shevtsov
4.4 (5)
The market is unfair if only because 10% of participants manage 90% of funds. An ordinary trader has slim changes to stand against these "vultures". This problem can be solved. You just need to be among these 10%, learn to predict their intentions and move with them. Volume is the only preemptive factor that faultlessly works on any timeframe and symbol. First, the volume appears and is accumulated, and only then the price moves. The price moves from one volume to another. Areas of volume accumu
VR Grid
Vladimir Pastushak
5 (3)
L'indicateur VR Grid est conçu pour créer une grille graphique avec des paramètres définis par l'utilisateur. Contrairement à la grille standard , VR Grid est utilisée pour créer des niveaux circulaires . Selon le choix de l'utilisateur, le pas entre les niveaux ronds peut être arbitraire. De plus, contrairement à d'autres indicateurs et utilitaires, VR Grid maintient la position de la grille même lorsque la période de temps change ou que le terminal est redémarré. Les paramètres, les fichiers d
FREE
Dynamic Trend Sniper MT4
Vincent Georges David Ferrier
Trade Like an Institution. Protect Like a Professional. Early Sniper Access: Limited Launch Offer! Get ready to elevate your trading precision. We are offering an exclusive, highly limited launch price for the first Dynamic Trend Sniper users. Our Unbeatable Launch Offer: First 10 Snipers Only: $69 (Full lifetime access + all v1.x updates) Standard Retail Price (After 10 Purchases): $129 Why Act Now? This is not just a discount; it's a strategic entry point. We are committed to rewarding o
Chinetti pip collector XL is a complete turnkey trading system. If a trader does not yet have his own trading system, he can apply Chinetti pip collector XL to trading. Trading with this indicator is very easy. Even a beginner in Forex can handle it. Trading rules: wait for the indicator to start drawing a blue line. This means that the price trend is starting now. Now we are waiting for the indicator to analyze the market and draw an up arrow on the chart. At this point, we open a buy order.
VSA Histogram
Richard Bystricky
VSA - P (Volume Spread Analysis) Period-Based Histogram is a tool that visually represents market volume dynamics using Volume Spread Analysis principles, with a focus on highlighting key volume changes over specific time periods. The histogram captures changes in volume and price spread relationships in real-time, enabling traders to detect early signals of accumulation, distribution, and shifts in buying or selling pressure. Indicator is non repainting and working with real-time on tick data.
Adjustable Volume Profile Indicator The Adjustable Volume Profile is a custom MetaTrader 4 (MT4) indicator designed to visually display the volume distribution of a financial instrument across a specific price range and time period. This indicator allows traders to analyze the volume profile based on either real volume or tick volume, helping to identify key levels of support, resistance, and market activity. Key Features: Customizable Timeframe: The indicator can be set to any available timefr
Dollar mint indicator is a special workmanship with years of experience in forex.   Dollar mint ea is a fully non repaint indicator optimised with price action data such that once it gives you a signal t . The indicator   can be used to trade anything on the mt4 with much ease. Benefits ; Fully non repaint Use in any timeframe Use in all the available tradable assets on mt4 Best to use on h4. It generates fully analysed buy and sell signals based on trend and also filters out retracements and
AQ XFifteen
HIT HYPERTECH INNOVATIONS LTD
4 (7)
Χ15 indicator is a MetaTrader 4 tool that allows you to BUILD & BACKTEST ON REAL TIME your own strategies quickly, easily and efficiently. It contains 15 of the most popular technical analysis indicators that you can use, each one in a different way. Choose the indicators that you want to use, select how you will use them and you will see on the chart BUY (green) and SELL (red) arrows implementing your strategy. Choose Take Profit and Stop Loss and you will see the results of your strategy with
FREE
"Auto FIBO Pro" Crypto_Forex indicator - est un excellent outil auxiliaire dans le trading ! - L'indicateur calcule et place automatiquement sur le graphique les niveaux de Fibo et les lignes de tendance locales (couleur rouge). - Les niveaux de Fibonacci indiquent les zones clés où le prix peut s'inverser. - Les niveaux les plus importants sont 23,6 %, 38,2 %, 50 % et 61,8 %. - Vous pouvez l'utiliser pour le scalping inversé ou pour le trading en grille de zones. - Il existe également de nomb
AQ XFifteen Pro
HIT HYPERTECH INNOVATIONS LTD
Χ15 indicator is a MetaTrader 4 tool that allows you to  BUILD & BACKTEST ON REAL TIME  your own strategies quickly, easily and efficiently. It contains  15 of the most popular technical analysis indicators  that you can use, each one in a different way. Choose the indicators that you want to use, select how you will use them and you will see on the chart BUY (green) and SELL (red) arrows implementing your strategy. Choose Take Profit and Stop Loss and you will see the results of your strategy w
The indicator analyzes the change in the minimum and maximum prices of the previous bars fixing the entrance of the big players. If the change (delta) increases, a signal is displayed on the graph in the form of an arrow. At the same time, virtual trade on history is carried out. In case of a repeat of the signal, the positions are increased (refilling). Thus the lot of positions can differ. The results of virtual trading in the form of losses / losses, profitability, drawdown and transaction li
Price Magnet — Price Density and Attraction Levels Indicator Price Magnet is a professional analytical tool designed to identify key support and resistance levels based on statistical Price Density. The indicator analyzes a specified historical period and detects price levels where the market spent the most time. These zones act as “magnets,” attracting price action or forming a structural base for potential reversals. Unlike traditional Volume Profile tools, Price Magnet focuses on price-time d
The Pairs Spread indicator has been developed for the popular strategy known as pairs trading, spread trading, or statistical arbitrage. This indicator measures the distance (spread) between prices of two directly (positively) correlated instruments and shows the result as a curve with standard deviations. So, traders can quickly identify when the instruments are too far apart and use this information for trade opportunities.  How to use the Pairs Spread indicator Best results are attained whe
Gold Venamax MT4
Sergei Linskii
3 (2)
Gold Venamax   - c'est le meilleur indicateur technique boursier. L'algorithme de l'indicateur analyse l'évolution des prix d'un actif et reflète la volatilité et les zones d'entrée potentielles. Caractéristiques de l'indicateur: Il s'agit d'un super indicateur avec Magic et deux blocs de flèches de tendance pour un trading confortable et rentable. Le bouton rouge pour changer de bloc est affiché sur le graphique. La magie est définie dans les paramètres de l'indicateur, afin que vous puissiez
Nouvelle version plus précise de l'indicateur Xmaster. Plus de 200 commerçants du monde entier ont effectué plus de 15 000 tests de différentes combinaisons de cet indicateur sur leurs PC afin d'obtenir la formule la plus efficace et la plus précise. Et ici, nous vous présentons l'indicateur « Indicateur de formule Xmaster forex sans repeindre », qui affiche des signaux précis et ne repeint pas. Cet indicateur envoie également des signaux au commerçant par e-mail et push. Avec l'arrivée de chaq
Blahtech Market Profile
Blahtech Limited
4.53 (15)
Was: $249  Now: $99   Market Profile defines a number of day types that can help the trader to determine market behaviour. A key feature is the Value Area, representing the range of price action where 70% of trading took place. Understanding the Value Area can give traders valuable insight into market direction and establish the higher odds trade. It is an excellent addition to any system you may be using. Blahtech Limited presents their Market Profile indicator for the MetaTrader community. Ins
Simply The Best Pro
Szymon Palczynski
5 (1)
This indicator displays the histogram and arrows on chart. When Simple The Best Pro are placed on a chart, they identify the trend.  The color of may be blue or red. The blue color stands for upside moves and the red color stands for downside trends. The indicator offers to set Stop Loss (SL) and  Take Profit (TP)  setting. The default value is ATR. Indicator has automatic optimization. The STB is a unique indicator that shows the tendency (button Bars) of a particular signals. The STB tells us
Likdon
Nadiya Mirosh
Using the Likdon Forex indicator algorithm, you can quickly determine the current trend in the market. The Elephant indicator tracks long trends and can be used without restrictions on instruments or timeframes. With its help, you can try to predict future price values, but its main purpose is to generate buy and sell signals. The indicator tracks the market trend, ignoring sharp fluctuations and market noise around the average price. It implements a technical analysis method based on the assu
Extremes Day
Aleksey Maltsev
v. 1.0 This indicator can show with maximum accuracy up to 1 bar the presence of a Maximum/minimum on the chart, regardless of the timeframe. It has a flexible configuration. You can use either one value on all TF, or you can use your own value on each TF individually. This indicator is already being improved and those who purchase it receive all updates for free. Next, it is planned to display an indication of the strength of the pivot point at each extremum (in % or in color drawing). It wi
Questo tipo di indicatore fa previsioni leggendo il volume delle candele. Il valore ATR, compreso nell'indicatore FORECAST PRO,è confrontato con i livelli di supporto e resistenza con le medie dei prezzi di apertura e chiusura delle candele. Creando così segnali di ingresso sul mercato tramite frecce colorate. Le frecce saranno confermate una volta che si è verificato il breakout.
Volume Profile Sniper v11. 1-un outil Complet pour l'analyse du marché Approche professionnelle du commerce Volume Profile Sniper V11.1 combine plus de 15 filtres clés dans un seul indicateur, fournissant des signaux clairs basés sur une évaluation complète de la situation du marché. Principales caractéristiques Analyse du déséquilibre volumétrique-l'algorithme calcule la proportion d'acheteurs et de vendeurs dans chaque bougie, signalant la prédominance de l'une des parties (seuil configurabl
Market Dynamics
Thomas Bradley Butler
Market Dynamics est pour le scalping de tendance. Le bleu est acheter et le rouge est vendre. Les lignes sont des zones de consolidation des prix et les chandelles régulières ne sont pas décidées. Le prix se consolidera entre les lignes de support et de résistance, puis il y aura une cassure de l'action des prix hors des zones. Pictez les zones à scalper au-dessus ou au-dessous et suivez les principales tendances ou les échanges quotidiens pour les scalps.
Profit Loss Meter
Alexander Sevastyanov
5 (3)
This indicator allow you to measure Profit/Loss of current, closed or future trade in account currency and estimate margin level at the trade close point. Profit/Loss indicator is based on MT4 native Crosshair instrument and has following inputs:  Trade Direction = Buy/Sell Lot size = 0.1 Font size = 8 Font color = DeepSkyBlue Offset horizontal Offset vertical   
FREE
Blahtech Supply Demand
Blahtech Limited
4.58 (36)
Was: $299  Now: $99   Supply Demand uses previous price action to identify potential imbalances between buyers and sellers. The key is to identify the better odds zones, not just the untouched ones. Blahtech Supply Demand indicator delivers functionality previously unavailable on any trading platform. This 4-in-1 indicator not only highlights the higher probability zones using a multi-criteria strength engine, but also combines it with multi-timeframe trend analysis, previously confirmed swings
Daily Candle Predictor est un indicateur qui prédit le cours de clôture d'une bougie. L'indicateur est principalement destiné à être utilisé sur les graphiques D1. Cet indicateur convient à la fois au trading forex traditionnel et au trading d'options binaires. L'indicateur peut être utilisé comme un système de trading autonome, ou il peut servir de complément à votre système de trading existant. Cet indicateur analyse la bougie actuelle, calcule certains facteurs de force à l'intérieur du corps
VolumeDeltaM1
Stanislav Korotky
3.25 (4)
This indicator provides tick volume delta analysis on M1 timeframe. It monitors up and down ticks and sums them up as separate volumes for buys and sells, as well as their delta volumes, and volume clusters on price scale within a specified number of bars. This indicator complements VolumeDelta , which uses similar algorithms but does not process ticks and therefore cannot work on M1. VolumeDelta can show its signals on entire history because it reads M1 volumes for calculations on higher timefr
BoxInside MT4
Evgeny Shevtsov
4.83 (6)
This indicator calculates the volume profile and places labels that correspond to the VAH, VAL and POC levels, for each candle individually. Indicator operation features The indicator works on the timeframes from M5 to MN, but it uses the history data of smaller periods: M1 - for periods from M5 to H1, M5 - for the H4 period, M30 - for the D1 period, H4 - for the W1 period, D1 - for the MN period. The color and location of the VAL, VAH and POC labels on the current candle are considered to be c
FREE
Les acheteurs de ce produit ont également acheté
The Propfolio Master Suite is the ultimate all-in-one analytical workstation for professional traders. Combining the power of the Beat The Market Maker (BTMM) methodology, Smart Money Concepts (SND/Liquidity), and Advanced Volume Profile, this suite replaces multiple different indicators with one optimized engine. Monitor up to 14 pairs simultaneously from a single chart, instantly identify market cycles, and seamlessly map institutional footprints with the click of a button. The Command Center
Scalper Inside PRO
Alexey Minkov
4.74 (69)
Scalper Inside PRO Scalper Inside PRO is an intraday trend and scalping indicator for MetaTrader 4 that uses an exclusive algorithm to quickly detect market direction and key target levels. It automatically calculates entry, exit and multiple profit targets, and shows detailed performance statistics so you can see how different instruments and strategies performed. This helps you choose the most suitable trading instruments for the current market conditions. Additionally, you can easily integrat
PZ Harmonacci Patterns
PZ TRADING SLU
3.17 (6)
Trade smarter, not harder: Empower your trading with Harmonacci Patterns This is arguably the most complete harmonic price formation auto-recognition indicator you can find for the MetaTrader Platform. It detects 19 different patterns, takes fibonacci projections as seriously as you do, displays the Potential Reversal Zone (PRZ) and finds suitable stop-loss and take-profit levels. [ Installation Guide | Update Guide | Troubleshooting | FAQ | All Products  ] It detects 19 different harmonic pric
NAM Order Blocks
NAM TECH GROUP, CORP.
3.67 (3)
MT4 Multi-timeframe Order Blocks detection indicator. Features - Fully customizable on chart control panel, provides complete interaction. - Hide and show control panel wherever you want. - Detect OBs on multiple timeframes. - Select OBs quantity to display. - Different OBs user interface. - Different filters on OBs. - OB proximity alert. - ADR High and Low lines. - Notification service (Screen alerts | Push notifications). Summary Order block is a market behavior that indicates order collection
Quants HL Break
Ferhat Mutlu
5 (2)
Calcul avancé effectué par l'action pure des prix pour trouver les cassures LH et HL. Cela vous donnera d'excellents points d'inversion sur le marché.Les signaux LH et HL peuvent également être utilisés pour les évasions de traingle. Une fois que la cassure se produit, cela indique un fort renversement.Beau filtre pour les moyennes mobiles.Je suggère fortement de l'utiliser avec des indicateurs de tendance. Peut être utilisé comme une confirmation supplémentaire pour le support et la résistanc
Dynamic Forex28 Navigator
Bernhard Schweigert
4.43 (7)
Dynamic Forex28 Navigator - L'outil de trading Forex de nouvelle génération. ACTUELLEMENT 49 % DE RÉDUCTION. Dynamic Forex28 Navigator est l'évolution de nos indicateurs populaires de longue date, combinant la puissance de trois en un : Advanced Currency Strength28 Indicator (695 avis) + Advanced Currency IMPULSE avec ALERT (520 avis) + CS28 Combo Signals (Bonus). Détails sur l'indicateur https://www.mql5.com/en/blogs/post/758844 Qu'offre l'indicateur de force de nouvelle génération ? Tout
RFI levels PRO
Roman Podpora
5 (1)
L'indicateur montre avec précision les points de retournement et les zones de retour des prix où le       Acteurs majeurs   . Vous repérez les nouvelles tendances et prenez des décisions avec une précision maximale, en gardant le contrôle de chaque transaction. VERSION MT5     -     Révèle son potentiel maximal lorsqu'il est combiné à l'indicateur   TREND LINES PRO Ce que l'indicateur montre : Structures et niveaux d'inversion avec activation au début d'une nouvelle tendance. Affichage des nive
Signal GoldRush Trend Arrow L'indicateur GoldRush Trend Arrow Signal fournit une analyse précise et en temps réel des tendances, spécialement conçue pour les scalpers à haute vitesse et à court terme sur la paire XAU/USD. Conçu spécialement pour les intervalles de temps d'une minute, cet outil affiche des flèches directionnelles indiquant clairement les points d'entrée, ce qui permet aux scalpers de naviguer en toute confiance dans des conditions de marché volatiles. L'indicateur se compose
KURAMA GOLD SIGNAL PRO (MT4) — Système de Trading XAUUSD Complet avec Filtre à 7 Couches, TP/SL Automatique et Notation de Qualité PAS DE REPAINT. PAS DE REDESSIN. PAS DE RETARD. Chaque signal est permanent. Ce que vous voyez est ce que vous obtenez. BONUS : Achetez la licence à vie et recevez AI Zone Radar (valeur $59) + manuel PDF complet GRATUIT. Envoyez-moi un message après l'achat. AI Zone Radar : https://www.mql5.com/en/market/product/175834 CONFIANCE DES TRADERS : Déjà utilisé par une
L'indicateur « Dynamic Scalper System » est conçu pour la méthode de scalping, permettant de trader au sein des vagues de tendance. Testé sur les principales paires de devises et l'or, il est compatible avec d'autres instruments de trading. Fournit des signaux pour l'ouverture de positions à court terme le long de la tendance, avec un support supplémentaire pour les fluctuations de prix. Principe de l'indicateur : De grandes flèches déterminent la direction de la tendance. Un algorithme de gén
Un indicateur technique qui structure les graphiques et identifie les mouvements de prix cycliques. Peut fonctionner sur n'importe quel graphique. Plusieurs types de notifications. Il y a des flèches supplémentaires sur le graphique lui-même. Sans revenir sur l'histoire, fonctionne sur la fermeture de la bougie. TF recommandé à partir de M5 et plus. Facile à utiliser et à configurer les paramètres. Lorsque vous utilisez 2 indicateurs avec des paramètres différents, vous pouvez les utiliser sans
KuKl
IGOR KIRIANEN
The indicator is built on a non-standard Zig Zag, it draws accumulations after which if the price leaves this zone and a test of this zone occurs, then a sound signal is given and an arrow appears - after the test candle closes.The indicator does not redraw its signals, it is very easy to use, there are only three settings 1- this is the zig zag parameter 2- this is the minimum price exit from the zone 3- this is the maximum price exit from the zone. The lower the parameter for Zig Zag, the more
NAM Divergences
NAM TECH GROUP, CORP.
5 (1)
MT4 Multi-timeframe Divergence and Overbougt/Oversold detection indicator. Features - Fully customizable on chart control panel, provides complete interaction. - Hide and show control panel wherever you want. - Real time information about non-capitalized divergences. - Real time information about overbougt / oversold situations. - Real time information about regular divergences. - Real time information about hidden divergences. - Oscillators available for divergences detection: AO, RSI, CCI, MA
Super Signal – Skyblade Edition Système de signaux de tendance professionnel sans repaint / sans latence, avec un taux de réussite exceptionnel | Pour MT4 / MT5 Il fonctionne mieux sur des unités de temps inférieures, comme 1 minute, 5 minutes et 15 minutes. Caractéristiques principales : Super Signal – Skyblade Edition est un système de signaux intelligent conçu spécifiquement pour le trading de tendance. Il utilise une logique de filtrage multicouche pour détecter uniquement les mouvements d
GOLD Impulse with Alert
Bernhard Schweigert
4.67 (12)
Cet indicateur est une super combinaison de nos 2 produits Advanced Currency IMPULSE with ALERT  +   Currency Strength Exotics . Il fonctionne pour tous les cadres temporels et montre graphiquement l'impulsion de force ou de faiblesse pour les 8 principales devises plus un symbole ! Cet indicateur est spécialisé pour montrer l'accélération de la force des devises pour tout symbole comme l'or, les paires exotiques, les matières premières, les indices ou les contrats à terme. C'est le premier
Indicateur Miraculous – Outil Forex et Binaire 100% Non-Repaint Basé sur le Carré de Neuf de Gann Cette vidéo présente l' Indicateur Miraculous , un outil de trading très précis et puissant, spécifiquement développé pour les traders du Forex et des Options Binaires . Ce qui rend cet indicateur unique est sa fondation sur le légendaire Carré de Neuf de Gann et la Loi de Vibration de Gann , en faisant l'un des outils de prévision les plus précis disponibles dans le trading moderne. L'Indicateur Mi
Quantum Breakout Indicator PRO
Bogdan Ion Puscasu
4.96 (26)
Présentation       Quantum Breakout PRO   , l'indicateur révolutionnaire MQL5 qui transforme la façon dont vous négociez les zones d'évasion ! Développé par une équipe de traders expérimentés avec une expérience de trading de plus de 13 ans,   Quantum Breakout PRO   est conçu pour propulser votre parcours de trading vers de nouveaux sommets grâce à sa stratégie de zone de discussion innovante et dynamique. Quantum Breakout Indicator vous donnera des flèches de signalisation sur les zones d'év
IQ FX Gann Levels a precision trading indicator based on W.D. Gann’s square root methods . It plots real-time, non-repainting support and resistance levels to help traders confidently spot intraday and scalping opportunities with high accuracy. William Delbert Gann (W.D. Gann) was an exceptional market analyst, whose trading technique was based on a complex blend of mathematics, geometry, astrology, and ancient mathematics which proved to be extremely accurate. Setup & Guide:  Download  MT5 Ver
Route Lines Prices - est un indicateur conçu pour identifier les directions des prix. Son interface simple intègre plusieurs algorithmes de calcul du comportement des prix et de leur direction future. Ces algorithmes incluent le calcul de la volatilité et le lissage des prix en fonction des unités de temps utilisées. L'indicateur possède un unique paramètre permettant de modifier la valeur « Calculating price values ». La valeur par défaut de 1 assure un calcul automatique équilibré, utilisabl
Precautions for subscribing to indicator This indicator only supports the computer version of MT4 Does not support MT5, mobile phones, tablets The indicator only shows the day's entry arrow The previous history arrow will not be displayed (Live broadcast is for demonstration) The indicator is a trading aid Is not a EA automatic trading No copy trading function The indicator only indicates the entry position No exit (target profit)  The entry stop loss point is set at 30-50 PIPS Or the front hi
Volatility Trend System - un système de trading qui donne des signaux pour les entrées. Le système de volatilité donne des signaux linéaires et ponctuels dans le sens de la tendance, ainsi que des signaux pour en sortir, sans redessiner ni retarder. L'indicateur de tendance surveille la direction de la tendance à moyen terme, montre la direction et son changement. L'indicateur de signal est basé sur les changements de volatilité et montre les entrées sur le marché. L'indicateur est équipé de pl
Apex Edge No Repaint Indicateur de trading professionnel sans repeint pour MT4 Apex Edge No Repaint est un outil de trading haut de gamme, clair et fiable, conçu pour les traders forex et cryptomonnaies exigeants qui recherchent des signaux précis sans la frustration des flèches qui se repeignent constamment. Caractéristiques principales : Aucun repeint – Les signaux restent fixes une fois affichés sur le graphique Système de double signal : Signaux bruts pour les opportunités précoces et
Panther Trade Scenario — affiche un scénario de trading clair directement sur le graphique. L’indicateur élimine le principal problème du trading — l’incertitude au moment où vous devez agir. Au lieu d’essayer de deviner le meilleur timing, vous voyez exactement : où entrer, où limiter le risque et où prendre vos profits.   Pourquoi la plupart des erreurs se produisent à l’entrée Le problème n’est pas que vous ne comprenez pas le marché. Dans la plupart des cas, la situation est la suivante : vo
CRT Multi-Timeframe Market Structure & Liquidity Sweep Indicator Non-Repainting | Multi-Asset | MT5 Version Available MT5 Version:   https://www.mql5.com/en/market/product/162075 Full User Guide — explains what each feature does and why:   https://www.mql5.com/en/blogs/post/767525 Quick Start User Guide  — explains how to configure and in what order:  https://www.mql5.com/en/blogs/post/767540 Indicator Overview CRT Ghost Candle HTF Fractal is a complete institutional-grade market structure too
Cet indicateur fonctionne en conjonction avec la théorie des vagues d'Elliott de deux manières : Mode automatique : Dans ce mode, l'indicateur détectera automatiquement les cinq vagues motrices sur le graphique conformément à la théorie des vagues d'Elliott. Il fournira des prédictions et identifiera les zones potentielles de retournement. De plus, il a la capacité de générer des alertes et des messages push pour informer les traders des développements importants. Cette fonctionnalité automatiqu
Please send me Direct message on MQL5 CHAT after purchasing the Indicator for Training and Installation Support There are some additional files that is important to use with the Indicator . So be sure to contact me after purchasing the Indicator So that I can add you for training and support . If you find any difficulty with installation then send me Direct message here So that I can connect with you via Anydesk or Teamview for the product installation. " Smart Order Block Indicator " to find m
KT Alpha Hunter Arrows MT4
KEENBASE SOFTWARE SOLUTIONS
La plupart des indicateurs à flèches vous donnent un signal, puis vous laissent gérer tout le reste seul. KT Alpha Hunter Arrows vous fournit un plan de trading complet. Chaque flèche de signal s’affiche avec un plan déjà tracé : ligne d’entrée, stop loss, quatre niveaux de take profit et un verdict d’edge en temps réel indiquant si ce symbole et cette unité de temps méritent d’être tradés maintenant. Le package inclut un Trade Manager EA qui prend en charge l’exécution après votre entrée, afin
BTMM State Engine Pro is a MetaTrader 4 indicator for traders who use the Beat The Market Maker approach: Asian session context, kill zone timing, level progression, peak formation detection, and a multi-pair scanner from a single chart. It combines cycle state logic with a built-in scanner dashboard so you do not need the same tool on many charts at once. What it does Draws the Asian session range; session times can follow broker server offset or be set in inputs. Tracks level progression (L
Trend Lines PRO
Roman Podpora
5 (1)
TREND LINES PRO     Cet indicateur permet de comprendre les véritables changements de direction du marché. Il révèle les renversements de tendance et les points de retour des principaux acteurs. Tu vois     Lignes BOS     Détection des changements de tendance et des niveaux clés sur des unités de temps supérieures, sans paramètres complexes ni interférences inutiles. Les signaux restent affichés sur le graphique même après la fermeture de la bougie. VERSION MT 5    -     Révèle son potentiel max
Supply and Demand Dashboard PRO
Bernhard Schweigert
4.8 (20)
Actuellement 40% de réduction ! Ce tableau de bord est un logiciel très puissant qui fonctionne sur plusieurs symboles et jusqu'à 9 horizons temporels. Il est basé sur notre indicateur principal (Best reviews : Advanced Supply Demand ).   Le tableau de bord donne une excellente vue d'ensemble. Il montre :  Les valeurs d'offre et de demande filtrées, y compris l'évaluation de la force de la zone, Les distances en pips vers/et dans les zones, Il met en évidence les zones imbriquées, Il donne 4
Plus de l'auteur
Bar Size MT4
Mikhail Tcvetkov
5 (3)
The technical indicator, in real time, searches for candlesticks that exceed the size set in the settings and gives signals about them. As a rule, such abnormally large candles appear either at the beginning of strong impulses or at the end of a directional price movement. At the beginning of the pulse, the signal can serve as a basis for searching for an entry point, at the end of the movement, it is a sign of a climax and may indicate the near end of the trend. The reference size for filtering
FREE
Trigger KX5
Mikhail Tcvetkov
5 (1)
L'indicateur en temps réel donne des signaux d'achat et de vente. Lors du choix de la direction selon la tendance principale, environ 75-80% des signaux sont traités en profit. Absolument tous les signaux restent sur le graphique et ne changent pas leur position, de sorte que vous pouvez facilement tester le travail de l'indicateur à la fois sur l'histoire et dans le testeur de stratégie.  Les paramètres de l'indicateur sont simples et logiques: le paramètre Velocity est responsable du nombre et
BELevelsPro
Mikhail Tcvetkov
BELevelsPro indicator – visualization of break-even levels of positions The indicator displays the break-even (BE) prices for your positions on the chart, taking into account accumulated swaps and commissions. It also shows the average prices of pending orders and an information panel with detailed statistics. , What is displayed on the chart: The blue mark is the price at which all BUY positions will go to zero (including swaps and commissions) The red mark is the price at which all SELL po
Filtrer:
Aucun avis
Répondre à l'avis