TRSI with Alerts MT4

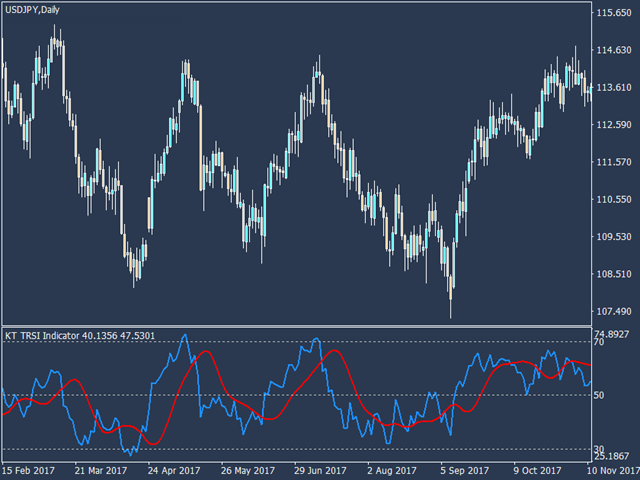
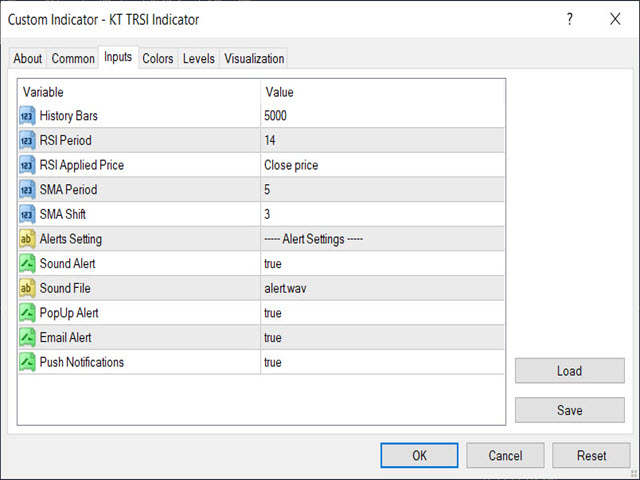
KT TRSI è un oscillatore costruito combinando RSI (Indice di Forza Relativa), EMA (Media Mobile Esponenziale) e SMA (Media Mobile Semplice). Rispetto all'RSI classico, il TRSI è meno soggetto a falsi segnali grazie all'effetto di smussamento della SMA. Inoltre, è dotato di tutti i tipi di avvisi compatibili con MetaTrader.

Regole di ingresso semplici

  • Acquisto: quando la linea blu (RSI) incrocia verso l'alto la linea rossa (TRSI).
  • Vendita: quando la linea blu (RSI) incrocia verso il basso la linea rossa (TRSI).

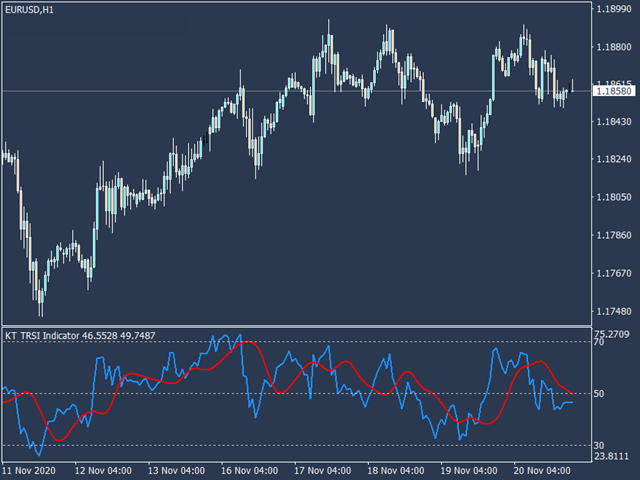
Regole di ingresso avanzate

  • Acquisto: quando la linea blu (RSI) scende sotto il livello di ipervenduto e poi torna sopra con un incrocio rialzista della linea rossa (TRSI).
  • Vendita: quando la linea blu (RSI) sale sopra il livello di ipercomprato e poi scende sotto con un incrocio ribassista della linea rossa (TRSI).

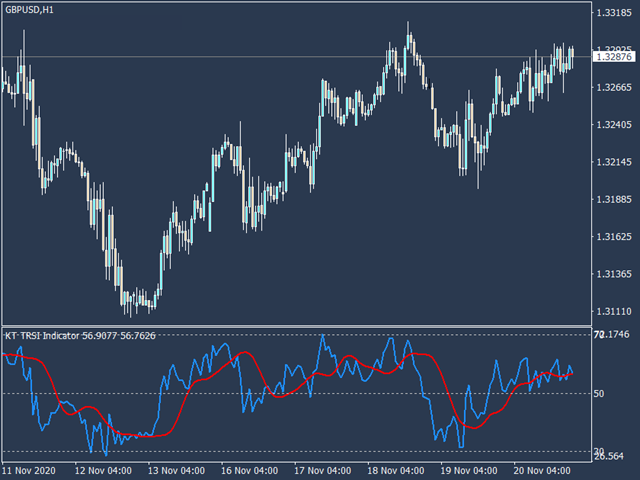
È fondamentale utilizzare altri indicatori e conferme insieme al TRSI per prendere decisioni più informate.

Formula del TRSI

Tripla EMA = EMA della EMA della EMA dell’RSI.
TRSI = SMA della Tripla EMA spostata di 3 barre a destra.
Prodotti consigliati
Koala Supply Demand
Ashkan Hazegh Nikrou
5 (2)
Presentazione dell'indicatore Koala Supply Demand per MetaTrader 4 (ti invitiamo a condividere la tua recensione o il tuo feedback, positivo o negativo, in modo che altri trader possano trarre vantaggio dalla tua esperienza.) : Benvenuti nell'indicatore Koala Supply Demand. Questo indicatore è progettato per identificare le zone di offerta e domanda ininterrotte. Questo indicatore può aiutare il trader a visualizzare il mercato come zone; è possibile vedere come il prezzo rispetti alcune potent
FREE
Auto Fibo Pro m
DMITRII GRIDASOV
Indicatore "Auto FIBO Pro" Crypto_Forex: è un ottimo strumento ausiliario nel trading! - L'indicatore calcola e posiziona automaticamente sul grafico i livelli di Fibo e le linee di tendenza locali (colore rosso). - I livelli di Fibonacci indicano le aree chiave in cui il prezzo può invertirsi. - I livelli più importanti sono 23,6%, 38,2%, 50% e 61,8%. - Puoi usarlo per lo scalping di inversione o per il trading di zone grid. - Ci sono molte opportunità per migliorare il tuo sistema attuale us
Weis Wave Indicator
Dhabaleswar Prasad Jena
This indicator is based on the Weis wave principle of wave volume. Below are few features of the indicator It draws the wave on the chart while the accumulated volume per wave in a different window at the bottom of the chart You can configure the turning point move It displays the accumulated volume (in thousands, eg for 15000 volume it will show 15) at the end of each wave You can also configure to show number of candles in the wave along with the wave volume The indicator calculates the distin
Alpha Trend sign has been a very popular trading tool in our company for a long time. It can verify our trading system and clearly indicate trading signals, and the signals will not drift. Main functions: Based on the market display of active areas, indicators can be used to intuitively determine whether the current market trend belongs to a trend market or a volatile market. And enter the market according to the indicator arrows, with green arrows indicating buy and red arrows indicating se
Daily Candle Predictor è un indicatore che prevede il prezzo di chiusura di una candela. L'indicatore è destinato principalmente all'uso sui grafici D1. Questo indicatore è adatto sia per il trading forex tradizionale che per il trading di opzioni binarie. L'indicatore può essere utilizzato come sistema di trading autonomo o può fungere da aggiunta al sistema di trading esistente. Questo indicatore analizza la candela corrente, calcolando alcuni fattori di forza all'interno del corpo della cande
VR Cub
Vladimir Pastushak
VR Cub è un indicatore per ottenere punti di ingresso di alta qualità. L'indicatore è stato sviluppato per facilitare i calcoli matematici e semplificare la ricerca dei punti di ingresso in una posizione. La strategia di trading per la quale è stato scritto l'indicatore ha dimostrato la sua efficacia per molti anni. La semplicità della strategia di trading è il suo grande vantaggio, che consente anche ai trader alle prime armi di commerciare con successo con essa. VR Cub calcola i punti di apert
EARLY REMINDER: The Starting price is 65 price will rise soon up to 365$ and then 750$ after first 10 copies of sales. Grab this offer now! Introduction Hello, traders! Welcome to the demonstration of the Forex Beast Indicator , a comprehensive tool designed to assist aspiring traders in navigating the complexities of the forex market. This indicator incorporates seven essential components to provide a well-rounded trading experience: Moving Averages Colored Zones Support and Resistance Levels
Nuova versione più accurata dell'indicatore Xmaster. Più di 200 trader di tutto il mondo hanno condotto più di 15.000 test di diverse combinazioni di questo indicatore sui loro PC per ottenere la formula più efficace e precisa. E qui ti presentiamo l'indicatore "Xmaster formula indicator forex no repaint", che mostra segnali accurati e non ridipinge. Questo indicatore invia anche segnali al trader tramite e-mail e push. Con l'arrivo di ogni nuovo tick, analizza costantemente il mercato in base
Royal Dutch Skunk
Sayan Vandenhout
ROYAL DUTCH SKUNK USES THE TREND WAVE INDICATOR AND IT CAN IDENTIFY THE BEGINNING AND THE END OF A NEW WAVE TREND MOVEMENT. AS AN OSCILLATOR, THE INDICATOR IDENTIFIES THE OVERBOUGHT AND OVERSOLD ZONES. IT WORKS GREAT TO CATCH THE SHORT TERM PRICE REVERSALS AND USES A MARTINGALE STRATEGY TO CLOSE ALL TRADES IN PROFIT. USE DEFAULT SETTINGS ON H1 OR HIGHER TIME FRAME ON ANY PAIR FOR MORE ACCURATE TRADES WHY THIS EA : Smart entries calculated by 6 great strategies The EA can be run on even a $20000
Shark Surfer is a new generation indicator applying a well-established trend-following trading. The product is good both for scalping, as well as medium- and long-term trading. Shark Surfer analyzes a selected symbol and shows the recommended market entry, take profit and stop loss levels. Shark Surfer trades on all symbols and timeframes. It also features email and push notifications concerning the new trading signals. The indicator searches for suitable market entry points on an already formed
Trend PA
Mikhail Nazarenko
5 (3)
The Trend PA indicator uses   Price Action   and its own filtering algorithm to determine the trend. This approach helps to accurately determine entry points and the current trend on any timeframe. The indicator uses its own algorithm for analyzing price changes and Price Action. Which gives you the advantage of recognizing, without delay, a new nascent trend with fewer false positives. Trend filtering conditions can be selected in the settings individually for your trading style. The indicator
RaysFX Supertrend Bar RaysFX Supertrend Bar è un indicatore personalizzato per MetaTrader 4. Utilizza l'indice di canale delle materie prime (CCI) per generare segnali di trading. L'indicatore mostra dei puntini in una finestra separata sotto il grafico principale per indicare i segnali di trading. Caratteristiche principali: Calcola il CCI per diversi periodi temporali. Visualizza puntini per indicare i segnali di trading. Permette all'utente di modificare i periodi temporali e la distanza tra
Fibonacci retracement and extension line drawing tool Fibonacci retracement and extended line drawing tool for MT4 platform is suitable for traders who use  golden section trading Advantages: There is no extra line, no too long line, and it is easy to observe and find trading opportunities Trial version: https://www.mql5.com/zh/market/product/35884 Main functions: 1. Multiple groups of Fibonacci turns can be drawn directly, and the relationship between important turning points can be seen
The indicator helps to identify possible rollbacks and reversals. Shows the direction of the price movement and is painted in the appropriate color. Allows you to conduct trend and counter trend trading It works on all timeframes, on any currency pairs, metals and cryptocurrency Can be used when working with binary options Distinctive features Does not redraw; Simple and clear settings; It works on all timeframes and on all symbols; Suitable for trading currencies, metals, options and cryptocurr
MACDivergence MTF
Pavel Zamoshnikov
4.29 (7)
Advanced ideas of the popular MACD indicator: It detects and displays classic and reverse divergences (three methods of detecting divergences). It uses different color to highlight an uptrend and a downtrend. Two methods of determining a trend: а) MACD crosses the 0 level (classic signal); б) MACD crosses its own average (early signal). This is a multi-timeframe indicator: it can display MACD data from other timeframes. Two methods of drawing: classic histogram and line. It generates sound and v
KT Renko Patterns MT4
KEENBASE SOFTWARE SOLUTIONS
2.33 (3)
KT Renko Patterns analizza il grafico Renko mattone per mattone per individuare i pattern grafici più famosi, frequentemente utilizzati dai trader nei vari mercati finanziari. Rispetto ai grafici basati sul tempo, i grafici Renko rendono il trading basato sui pattern più semplice e visivamente chiaro grazie alla loro struttura pulita. KT Renko Patterns include diversi pattern Renko, molti dei quali sono ampiamente spiegati nel libro “Profitable Trading with Renko Charts” di Prashant Shah. Un E
PZ Harmonacci Patterns
PZ TRADING SLU
3.17 (6)
Trade smarter, not harder: Empower your trading with Harmonacci Patterns This is arguably the most complete harmonic price formation auto-recognition indicator you can find for the MetaTrader Platform. It detects 19 different patterns, takes fibonacci projections as seriously as you do, displays the Potential Reversal Zone (PRZ) and finds suitable stop-loss and take-profit levels. [ Installation Guide | Update Guide | Troubleshooting | FAQ | All Products ] It detects 19 different harmonic pric
The Super Arrow Indicator provides non-repainting buy and sell signals with exceptional accuracy. Key Features No repainting – confirmed signals remain fixed Clear visual arrows: green for buy, red for sell Real-time alerts via pop-up, sound, and optional email Clean chart view with no unnecessary clutter Works on all markets: Forex, gold, oil, indices, crypto Adjustable Parameters TimeFrame Default: "current time frame" Function: Sets the time frame for indicator calculation Options: Can be set
Trend Oscillator - è un indicatore Crypto_Forex personalizzato avanzato, uno strumento di trading efficiente! - Viene utilizzato un nuovo metodo di calcolo avanzato - 20 opzioni per il parametro "Prezzo per calcolo". - L'oscillatore più fluido mai sviluppato. - Colore verde per i trend al rialzo, colore rosso per i trend al ribasso. - Valori di ipervenduto: inferiori a 5, valori di ipercomprato: superiori a 95. - Ci sono molte opportunità per aggiornare anche le strategie standard con questo i
Happy Scalping Indicator
Leandro Bernardez Camero
Questo indicatore è stato progettato per uno scalping aggressivo e per entrate rapide nelle opzioni binarie , generando segnali su ogni candela in modo da sapere esattamente cosa sta succedendo in ogni momento. Unisciti al canale Happy Scalping: MQL5 Non ripinta : il segnale della candela attuale viene generato in tempo reale , il che significa che può cambiare mentre la candela è ancora in formazione, a seconda che il prezzo salga o scenda rispetto alla chiusura della candela precedente. Tutt
Donchian channels are a tool in technical analysis used to determine the relative volatility of a market and the potential for price breakouts. Can help identify potential breakouts and reversals in price, which are the moments when traders are called on to make strategic decisions. These strategies can help you capitalize on price trends while having pre-defined entry and exit points to secure gains or limit losses. Using the Donchian channel can thus be part of a disciplined approach to managi
FREE
The Sensitive Volume indicator is an indicator designed to generate trading signals. The purpose of this indicator is to generate signals from the highest probability of trading. Using a number of price movements and a set of indicator properties to generate these signals.  Easy to use, simple and understandable to the user. With alert features, user signals can be reached quickly.  Visually the user can easily recognize the signals. This indicator will not repaint. Parameters Trend_Period - pe
EZZ Zig Zag MT4
Paulo Rocha
5 (1)
EZZ Elite Zig Zag is an indicator for the MetaTrader 4 terminal. This indicator traces the peak of the trend based on the market reversal, thus showing various opportunities in the financial market. EZZ Elite Zig Zag is a visual tool, intuitive, and easy to understand and use.  Test it Yourself by Downloading it for Free. Author Paulo Rocha all rights reserved
The indicator detects and displays 3 Drives harmonic pattern (see the screenshot). The pattern is plotted by the extreme values of the ZigZag indicator (included in the resources, no need to install). After detecting the pattern, the indicator notifies of that by a pop-up window, a mobile notification and an email. The indicator highlights the process of the pattern formation and not just the complete pattern. In the former case, it is displayed in the contour triangles. After the pattern is com
Dollar Mint Indicator
David Mwaniki Mbugua
Dollar mint indicator is a special workmanship with years of experience in forex.   Dollar mint ea is a fully non repaint indicator optimised with price action data such that once it gives you a signal t . The indicator   can be used to trade anything on the mt4 with much ease. Benefits ; Fully non repaint Use in any timeframe Use in all the available tradable assets on mt4 Best to use on h4. It generates fully analysed buy and sell signals based on trend and also filters out retracements and
Forex Gump Booster Scalping is a forex signal indicator. Shows on the Metatrader4 chart signals when to open trades to buy and sell. Also sends signals to the phone and email. EA works on all currency pairs and timeframes. The default parameters are set to EURUSD D1. But you can customize to any currency pair. The indicator will help you with this. You select the parameters in the settings, and the indicator displays the predicted profit / loss for the last 1000 bars. If the projected profit sui
This is a new strategy for SUPPLY DEMAND areas It is based on a calculation using the tick volume to detect the big price action in market for both bear /bull actions this smart volume action candles are used to determine the supply and demand areas prices in between main supply and demand lines indicate sideway market  up arrows will be shown when prices moves above the main supply and the secondary supply lines Down arrows will be shown when prices moves below the main demand and the secondary
Trend Ray
Andriy Sydoruk
The indicator shows the potential trend direction by cyclical-wave dependence. Thus, all the rays of the intersection will be optimal rays, in the direction of which the price is expected to move, taking into account the indicator period. Rays can be used as a direction for potential market movement. But we must not forget that the approach must be comprehensive, the indicator signals require additional information to enter the market.
Forex Gump Dot is a ready-made mechanical trading system for the +10 pips strategy. This strategy has been actively discussed and developed on the Internet for several years. The essence of this strategy is to open trade operations during the day and fix the minimum profit on each trade operation. That is, scalp. Our development team decided to adapt the indicators of the Forex Gump family and release a new product that will best match the scalping trading strategy. This product is Forex Gump Do
Discover the Power of Trend Strength Pro Unlock a new level of clarity in your trading with Trend Strength Pro , the ultimate tool for visualizing market momentum. Stop guessing and start seeing the true strength of a trend with a single glance. Our elegant and intuitive indicator helps you make smarter, more confident trading decisions. Key Advantages & Features Instantly See Trend Strength : Our color-coded histogram tells you whether the trend is getting stronger or weaker. Green means moment
FREE
Gli utenti di questo prodotto hanno anche acquistato
Gann Made Easy
Oleg Rodin
4.81 (154)
Gann Made Easy è un sistema di trading Forex professionale e facile da usare che si basa sui migliori principi del trading utilizzando la teoria di mr. WD Gann. L'indicatore fornisce segnali ACQUISTA e VENDI accurati, inclusi i livelli di Stop Loss e Take Profit. Puoi fare trading anche in movimento utilizzando le notifiche PUSH. CONTATTATEMI DOPO L'ACQUISTO PER RICEVERE CONSIGLI DI TRADING, BONUS E L'ASSISTENTE EA GANN MADE EASY GRATUITAMENTE! Probabilmente hai già sentito parlare molte volte d
M1 Sniper
Oleg Rodin
4.89 (18)
M1 SNIPER è un sistema di indicatori di trading facile da usare. Si tratta di un indicatore a freccia progettato per l'intervallo temporale M1. L'indicatore può essere utilizzato come sistema autonomo per lo scalping sull'intervallo temporale M1 e come parte del tuo sistema di trading esistente. Sebbene questo sistema di trading sia stato progettato specificamente per il trading sull'intervallo temporale M1, può comunque essere utilizzato anche con altri intervalli temporali. Inizialmente ho pro
Game Changer Indicator
Vasiliy Strukov
5 (14)
Game Changer è un indicatore di tendenza rivoluzionario, progettato per essere utilizzato su qualsiasi strumento finanziario, per trasformare il tuo Metatrader in un potente analizzatore di trend. L'indicatore non ridisegna e non subisce ritardi. Funziona su qualsiasi intervallo temporale e aiuta a identificare i trend, segnala potenziali inversioni, funge da meccanismo di trailing stop e fornisce avvisi in tempo reale per risposte tempestive del mercato. Che tu sia un trader esperto, un profess
Volatility Trend System - un sistema di trading che fornisce segnali per le voci. Il sistema di volatilità fornisce segnali lineari e puntuali nella direzione del trend, nonché segnali per uscirne, senza ridisegnare e ritardi. L'indicatore di tendenza monitora la direzione della tendenza a medio termine, mostra la direzione e il suo cambiamento. L'indicatore di segnale si basa sui cambiamenti della volatilità e mostra gli ingressi nel mercato. L'indicatore è dotato di diversi tipi di avvisi. Pu
Smc Blast Signal
Mohit Dhariwal
5 (3)
Full Fledged EA and Alert plus for alerts will also be provided in this offer along with the purchase of Indicator. Limited copies only at this price and Ea too. Grab your copy soon Alert plus for indicator with set file is kept in comment section with the image  SMC Blast Signal with FVG, BOS and trend Breakout The SMC Blast Signal is a Precise trading system for Meta Trader 4 that uses Smart Money Concepts (SMC), including Fair Value Gaps (FVG) and Break of Structure (BOS), to identify high-pr
Scalper Inside PRO
Alexey Minkov
4.74 (69)
An exclusive indicator that utilizes an innovative algorithm to swiftly and accurately determine the market trend. The indicator automatically calculates opening, closing, and profit levels, providing detailed trading statistics. With these features, you can choose the most appropriate trading instrument for the current market conditions. Additionally, you can easily integrate your own arrow indicators into Scalper Inside Pro to quickly evaluate their statistics and profitability. Scalper Inside
Se acquisti questo indicatore, riceverai il mio Trade Manager Professionale   + EA  GRATUITAMENTE. Innanzitutto è importante sottolineare che questo sistema di trading è un indicatore Non-Repainting, Non-Redrawing e Non-Lagging, il che lo rende ideale sia per il trading manuale che per quello automatico. Corso online, manuale e download di preset. Il "Sistema di Trading Smart Trend MT5" è una soluzione completa pensata sia per i trader principianti che per quelli esperti. Combina oltre 10 indic
Dynamic Forex28 Navigator
Bernhard Schweigert
4.43 (7)
Dynamic Forex28 Navigator - Lo strumento di trading Forex di nuova generazione. ATTUALMENTE SCONTATO DEL 49%. Dynamic Forex28 Navigator è l'evoluzione dei nostri indicatori popolari di lunga data, che combinano la potenza di tre in uno: Advanced Currency Strength28 Indicator (695 recensioni) + Advanced Currency IMPULSE con ALERT (520 recensioni) + CS28 Combo Signals (Bonus). Dettagli sull'indicatore https://www.mql5.com/en/blogs/post/758844 Cosa offre l'indicatore di forza di nuova generazione?
First 25 copies at $80, after that price becomes $149 (3 copies left) Gold Signal Pro is a powerful MT4 indicator designed to help traders spot strong price reactions in the market. It focuses on clear wick rejections , showing when price strongly rejects a level and often continues in the same direction. Gold Signal Pro is mainly built for scalping gold (XAUUSD) and works best on lower timeframes like M5 and M15 , where timing matters most. That said, it can also be used on any forex pair, a
Trend indicator AI
Ramil Minniakhmetov
4.75 (80)
Trend Ai indicator è un ottimo strumento che migliorerà l'analisi di mercato di un trader combinando l'identificazione della tendenza con punti di ingresso utilizzabili e avvisi di inversione. Questo indicatore consente agli utenti di navigare nelle complessità del mercato forex con fiducia e precisione Oltre ai segnali primari, l'indicatore Ai di tendenza identifica i punti di ingresso secondari che si presentano durante i pullback o i ritracciamenti, consentendo ai trader di capitalizzare le
PRO Renko System
Oleg Rodin
5 (30)
PRO Renko System è un sistema di trading altamente accurato appositamente progettato per il trading di grafici RENKO. Questo è un sistema universale che può essere applicato a vari strumenti di trading. Il sistema neutralizza efficacemente il cosiddetto rumore di mercato che consente di accedere a segnali di inversione accurati. L'indicatore è molto facile da usare e ha un solo parametro responsabile della generazione del segnale. Puoi facilmente adattare lo strumento a qualsiasi strumento di
Apollo SR Master è un indicatore di Supporto/Resistenza con caratteristiche speciali che rendono il trading con le zone di Supporto/Resistenza più semplice e affidabile. L'indicatore calcola le zone di Supporto/Resistenza in tempo reale senza alcun ritardo, rilevando i massimi e i minimi dei prezzi locali. Quindi, per confermare la nuova area SR formata, l'indicatore mostra un segnale speciale che segnala che la zona SR può essere presa in considerazione e utilizzata come un vero e proprio segna
Innanzitutto, vale la pena sottolineare che questo Strumento di Trading è un Indicatore Non-Ridipingente, Non-Ridisegnante e Non-Laggante, il che lo rende ideale per il trading professionale. Corso online, manuale utente e demo. L'Indicatore Smart Price Action Concepts è uno strumento molto potente sia per i nuovi che per i trader esperti. Racchiude più di 20 utili indicatori in uno solo, combinando idee di trading avanzate come l'Analisi del Trader del Circolo Interno e le Strategie di Trading
Trend Screener
STE S.S.COMPANY
4.79 (95)
Indicatore di tendenza, soluzione unica rivoluzionaria per il trading di tendenze e il filtraggio con tutte le importanti funzionalità di tendenza integrate in un unico strumento! È un indicatore multi-timeframe e multi-valuta al 100% non ridipingibile che può essere utilizzato su tutti i simboli/strumenti: forex, materie prime, criptovalute, indici e azioni. OFFERTA A TEMPO LIMITATO: l'indicatore di screening di supporto e resistenza è disponibile a soli 50$ e a vita. (Prezzo originale 250$) (o
Attualmente 40% di sconto! La soluzione migliore per ogni principiante o trader esperto! Questo software per cruscotti funziona su 28 coppie di valute. Si basa su 2 dei nostri indicatori principali (Advanced Currency Strength 28 e Advanced Currency Impulse). Offre un'ottima panoramica dell'intero mercato Forex. Mostra i valori di forza delle valute avanzate, la velocità di movimento delle valute e i segnali per 28 coppie Forex in tutti i (9) timeframe. Immaginate come migliorerà il vostro tra
Gold Scalper Super
Aleksandr Makarov
5 (2)
Gold Scalper Super is an easy-to-use trading system. The indicator can be used as a standalone scalping system on the M1 time frame, as well as part of your existing trading system. Bonus: when purchasing an indicator, Trend Arrow Super is provided free of charge, write to us after purchase. The indicator 100% does not repaint!!! If a signal appears, it does not disappear! Unlike indicators with redrawing, which lead to the loss of a deposit, because they can show a signal and then remove it.
Advanced Currency IMPULSE with ALERT
Bernhard Schweigert
4.91 (489)
ATTUALMENTE SCONTATO DEL 40%! La soluzione migliore per ogni principiante o trader esperto! Questo indicatore è uno strumento di trading unico, di alta qualità e conveniente perché abbiamo incorporato una serie di caratteristiche proprietarie e una formula segreta. Con un solo grafico fornisce avvisi per tutte le 28 coppie di valute. Immaginate come migliorerà il vostro trading perché sarete in grado di individuare l'esatto punto di innesco di una nuova tendenza o opportunità di scalping! Co
Advanced Supply Demand
Bernhard Schweigert
4.91 (297)
Speciale Trading- SCONTO DEL 40% La soluzione migliore per qualsiasi trader principiante o esperto! Questo indicatore è uno strumento di trading unico, di alta qualità e conveniente, perché abbiamo incorporato una serie di funzionalità proprietarie e una nuova formula. Con questo aggiornamento, potrai visualizzare doppie zone di timeframe. Non solo potrai visualizzare un TF più alto, ma anche entrambi, il TF del grafico e il TF più alto: MOSTRA ZONE ANNIDATE. Tutti i trader che operano con Of
Shogun Trade
Yuki Miyake
5 (2)
SHOGUN Trade - The Shocking Truth of 16 Years Unoptimized. Shogun Trading February Special Sale – Only $99 (Regular Price $199)! This special offer is available until February 28th . As we are dedicated to further product development and optimization , we are offering this discount in exchange for your valuable feedback. Your insights will directly influence our next round of updates and feature enhancements. Price: $99 (Special discount from $199) Requirement: Please leave a review and share
Pulse Scalping Line - an indicator for identifying potential pivot points. Based on this indicator, you can build an effective Martingale system. According to our statistics, the indicator gives a maximum of 4 erroneous pivot points in a series. On average, these are 2 pivot points. That is, the indicator shows a reversal, it is erroneous. This means that the second signal of the indicator will be highly accurate. Based on this information, you can build a trading system based on the Martingale
Presenting one-of-a-kind Gann Indicator for XAUUSD IQ Gold Gann Levels is a non-repainting, precision tool designed exclusively for XAUUSD/Gold intraday trading. It uses W.D. Gann’s square root method to plot real-time support and resistance levels, helping traders spot high-probability entries with confidence and clarity. William Delbert Gann (W.D. Gann) was an exceptional market analyst whose trading technique was based on a complex blend of mathematics, geometry, astrology, and ancient calcul
Slayer Scalping
Abdulkarim Karazon
5 (2)
Questo indicatore si concentra su due livelli take profit e uno stoploss molto stretto; l'idea principale è scalpare il mercato su intervalli temporali più alti a partire da m15 in su, poiché questi frame non vengono molto influenzati da spread e commissione del broker; l'indicatore dà segnali di compra/vendita basati sulla strategia di divergenza di prezzo dove traccia una freccia d'acquisto con livelli tp/sl quando le condizioni di divergenza rialzista sono pienamente soddisfatte. Lo stesso va
Questo cruscotto mostra gli ultimi pattern armonici disponibili per i simboli selezionati, in modo da risparmiare tempo ed essere più efficienti / versione MT5 . Indicatore gratuito: Basic Harmonic Pattern Colonne dell'indicatore Symbol : vengono visualizzati i simboli selezionati Trend: rialzista o ribassista Pattern: tipo di pattern (gartley, butterfly, bat, crab, shark, cypher o ABCD) Entry: prezzo di ingresso SL: prezzo di stop loss TP1: 1 prezzo di take profit TP2: 2 prezzo di take pr
FX Power MT4 NG
Daniel Stein
4.95 (21)
FX Power: Analizza la Forza delle Valute per Decisioni di Trading Più Intelligenti Panoramica FX Power è lo strumento essenziale per comprendere la reale forza delle principali valute e dell'oro in qualsiasi condizione di mercato. Identificando le valute forti da comprare e quelle deboli da vendere, FX Power semplifica le decisioni di trading e rivela opportunità ad alta probabilità. Che tu segua le tendenze o anticipi inversioni utilizzando valori estremi di Delta, questo strumento si adatta
RFI levels PRO
Roman Podpora
5 (1)
Indicatore in anticipo   determina i livelli e le zone di inversione del mercato , consente di attendere che il prezzo ritorni al livello ed entrare all'inizio di un nuovo trend, e non alla sua fine. Lui mostra   livelli di inversione   dove il mercato conferma un cambio di direzione e forma un ulteriore movimento. L'indicatore funziona senza ridisegnare, è ottimizzato per qualsiasi strumento e rivela il suo massimo potenziale quando abbinato al   LINEE DI TENDENZA PRO   indicatore. Scanner st
GOLD Impulse with Alert
Bernhard Schweigert
4.64 (11)
Questo indicatore è una super combinazione dei nostri 2 prodotti Advanced Currency IMPULSE with ALERT  +   Currency Strength Exotics . Funziona per tutti i time frame e mostra graficamente l'impulso di forza o debolezza per le 8 valute principali più un simbolo! Questo indicatore è specializzato nel mostrare l'accelerazione della forza delle valute per qualsiasi simbolo come oro, coppie esotiche, materie prime, indici o futures. Primo nel suo genere, qualsiasi simbolo può essere aggiunto all
System Trend Pro
Aleksandr Makarov
5 (2)
System Trend Pro - This is the best trend trading indicator!!! The indicator no repaint!!!  The indicator has   MTF   mode, which adds confidence to trading on the trend (   no repaint   ). How to trade? Everything is very simple, we wait for the first signal (big arrow), then wait for the second signal (small arrow) and enter the market in the direction of the arrow. (See screens 1 and 2.) Exit on the opposite signal or take 20-30 pips, close half of it, and keep the rest until the opposite
Supreme Commander
Ramon Sobrevals Arce
4.13 (8)
The indicator of the indicators. The Most Powerful Technique to Determine Forex Trend Strength in 2023. We have perfected Supreme Commander that it calculates an average of the selected indicators (up to 16) and the selected timeframe (all) with the result of a single trend that indicates the potential of buying and selling.  It includes the following indicators: Accelerator/Decelerator oscillator Average Directional Movement Index Awesome oscillator; Bulls and Bears  Commodity Channel Index; De
Trend Arrow Super
Aleksandr Makarov
5 (2)
Trend Arrow Super The indicator not repaint or change its data. A professional, yet very easy to use Forex system. The indicator gives accurate BUY\SELL signals. Trend Arrow Super is very easy to use, you just need to attach it to the chart and follow simple trading recommendations. Buy signal: Arrow + Histogram in green color, enter immediately on the market to buy. Sell signal: Arrow + Histogram of red color, enter immediately on the market to sell.
Un indicatore tecnico che struttura i grafici e identifica i movimenti ciclici dei prezzi. Può funzionare su qualsiasi grafico. Diversi tipi di notifiche. Ci sono altre frecce sul grafico stesso. Senza ridisegnare la storia, lavora sulla chiusura della candela. TF consigliati da M5 in su. Parametri facili da usare e configurare. Se si utilizzano 2 indicatori con parametri diversi, è possibile utilizzarli senza altri indicatori. Ha 2 parametri di input Ciclicità e durata del segnale Questi 2 pa
Altri dall’autore
KT RSI Divergence Robot MT4
KEENBASE SOFTWARE SOLUTIONS
KT RSI Divergence robot è un Expert Advisor completamente automatizzato che opera le divergenze regolari e nascoste tra il prezzo e l’oscillatore Relative Strength Index (RSI). I segnali di divergenza provengono dal nostro indicatore RSI Divergence disponibile gratuitamente. Non tutte le divergenze sfociano in un’inversione di prezzo di successo; per questo motivo l’EA combina i segnali grezzi di divergenza con il proprio modulo di analisi tecnica integrato per sfruttare l’inefficienza di prez
KT Momentum Arrows MT5
KEENBASE SOFTWARE SOLUTIONS
5 (2)
L'indicatore KT Momentum Arrows si basa su una rottura momentanea calcolata utilizzando la deviazione delle bande e la volatilità emergente in una determinata direzione. Un segnale di acquisto viene generato quando il prezzo chiude al di sopra della banda superiore, mentre un segnale di vendita viene generato quando chiude al di sotto della banda inferiore. Viene utilizzato un coefficiente di magnitudo come input, che influenza sia la deviazione delle bande sia la misurazione della volatilità. I
KT CCI Divergence MT5
KEENBASE SOFTWARE SOLUTIONS
KT CCI Divergence shows the regular and hidden divergence created between the price and CCI oscillator. Divergence is one of the vital signals that depicts the upcoming price reversal in the market. Manually spotting the divergence between price and CCI can be a hectic and ambiguous task. Limitations of KT CCI Divergence   Using the CCI divergence as a standalone entry signal can be risky. Every divergence can't be interpreted as a strong reversal signal. For better results, try to combine it w
ACB Breakout Arrows
KEENBASE SOFTWARE SOLUTIONS
4.12 (33)
L’indicatore ACB Breakout Arrows fornisce un segnale di ingresso cruciale rilevando uno specifico pattern di breakout. Monitora costantemente il grafico alla ricerca di un momentum stabile in una direzione e segnala con precisione l’ingresso poco prima del movimento principale.  Ottieni lo scanner multi-simbolo e multi-timeframe qui - Scanner per ACB Breakout Arrows MT4 Caratteristiche principali Lo Stop Loss e il Take Profit sono calcolati automaticamente dall'indicatore. Include una dashboard
ACB Breakout Arrows MT5
KEENBASE SOFTWARE SOLUTIONS
5 (1)
L’indicatore ACB Breakout Arrows fornisce un segnale di ingresso fondamentale nel mercato rilevando uno specifico pattern di breakout. L’indicatore analizza costantemente il grafico per individuare un momentum stabile in una direzione e fornisce un segnale preciso subito prima del movimento principale. Ottieni lo scanner multi-simbolo e multi-timeframe da qui - Scanner per ACB Breakout Arrows MT5 Caratteristiche principali I livelli di Stop Loss e Take Profit sono forniti automaticamente dall’
KT Stoch Divergence MT5
KEENBASE SOFTWARE SOLUTIONS
La divergenza è uno dei segnali chiave che può anticipare un'inversione di prezzo nel mercato. KT Stoch Divergence evidenzia le divergenze regolari e nascoste tra il prezzo e l’oscillatore stocastico. Limitazioni di KT Stoch Divergence Usare solo la divergenza dello stocastico come segnale di ingresso può essere rischioso. Non tutte le divergenze sono sinonimo di un'inversione forte. Per ottenere risultati migliori, combinarla con l’azione del prezzo e la direzione del trend. Caratteristiche
KT Psar Arrows MT5
KEENBASE SOFTWARE SOLUTIONS
5 (1)
KT Psar Arrows traccia frecce sul grafico utilizzando l'indicatore standard Parabolic SAR. Una freccia rialzista viene tracciata quando il massimo della candela tocca il SAR. Una freccia ribassista viene tracciata quando il minimo della candela tocca il SAR. I segnali vengono generati in tempo reale senza attendere la chiusura della candela.  Funzionalità Uno strumento utile per i trader che desiderano sperimentare strategie di trading che includono l'uso dell'indicatore Parabolic SAR.  Può ess
KT Trend Magic
KEENBASE SOFTWARE SOLUTIONS
KT Trend Magic shows the trend depiction on chart using the combination of market momentum and volatility. A smoothing coefficient is used to smooth out the noise from the signal.It can be used to find out the new entries or confirm the trades produced by other EA/Indicators. Usage Drag n drop MTF scanner which scans for the new signals across multiple time-frames. Find new entries in the trend direction. Improve the accuracy of other indicators when used in conjunction. Can be used as a dynami
ACB Trade Filter MT4
KEENBASE SOFTWARE SOLUTIONS
5 (1)
The ACB Trade Filter indicator provides a solution for filtering out the low probability trading setups in a trading strategy. The indicator uses a sophisticated filtration algorithm based on the market sentiment and trend. Applications Works great with our indicator " ACB Breakout Arrows ". Filter out low probability signals from any indicator. Avoid overtrading and minimize the losses. Trade in the direction of market sentiment and trend. Avoid the choppiness in the market. How to use Only L
KT Momentum Arrows
KEENBASE SOFTWARE SOLUTIONS
L'indicatore KT Momentum Arrows si basa su una rottura momentanea calcolata utilizzando la deviazione delle bande e la volatilità emergente in una determinata direzione. Un segnale di acquisto viene generato quando il prezzo chiude al di sopra della banda superiore, mentre un segnale di vendita viene generato quando chiude al di sotto della banda inferiore. Viene utilizzato un coefficiente di magnitudo come input, che influenza sia la deviazione delle bande sia la misurazione della volatilità. I
KT COG Advanced MT4
KEENBASE SOFTWARE SOLUTIONS
1 (1)
KT COG is an advanced implementation of the center of gravity indicator presented by John F. Ehlers in the May 2002 edition of Technical Analysis of Stocks & Commodities magazine. It's a leading indicator which can be used to identify the potential reversal points with the minimum lag. The COG oscillator catches the price swings quite effectively. MT5 version of the same indicator is available here KT COG Advanced MT5 Calculation of COG The COG indicator is consist of the two lines. The main l
KT Pin Bar
KEENBASE SOFTWARE SOLUTIONS
KT Pin Bar identifies the pin bar formation which is a type of price action pattern which depicts a sign of reversal or rejection of the trend. When combined with support and resistance, BRN and other significant levels, Pin Bar pattern proved to be a very strong sign of reversal. Basically, a pin bar is characterized by a small body relative to the bar length which is closed either in upper or lower 50% part of its length. They have very large wicks and small candle body. A pin bar candlestic
KT Auto Fibo
KEENBASE SOFTWARE SOLUTIONS
KT Auto Fibo traccia automaticamente i livelli di ritracciamento di Fibonacci basandosi sulla direzione della tendenza in corso. I massimi e i minimi vengono selezionati automaticamente utilizzando i punti massimi e minimi disponibili sul grafico. Puoi ingrandire, ridurre e scorrere il grafico per regolare i livelli di Fibonacci di conseguenza. Modalità Automatico:  Traccia automaticamente i livelli di Fibonacci in base all'area visibile del grafico. Manuale: Traccia i livelli di Fibonacci una
KT Psar Arrows
KEENBASE SOFTWARE SOLUTIONS
KT Psar Arrows traccia frecce sul grafico utilizzando l'indicatore standard Parabolic SAR. Una freccia rialzista viene tracciata quando il massimo della candela tocca il SAR. Una freccia ribassista viene tracciata quando il minimo della candela tocca il SAR. I segnali vengono generati in tempo reale senza attendere la chiusura della candela.  Funzionalità Uno strumento utile per i trader che desiderano sperimentare strategie di trading che includono l'uso dell'indicatore Parabolic SAR.  Può ess
KT Ichimoku Trader
KEENBASE SOFTWARE SOLUTIONS
1 (1)
KT Ichimoku Trader is a fully automated expert advisor that offers five popular trading strategies based on the Ichimoku indicator. Each strategy has it's own entry and exit method without any interference to other strategies. The Ichimoku system can be applied to all major currency pairs and metals. However, we found that it performs reasonably well mainly on two pairs.   MT5 Version is available here  https://www.mql5.com/en/market/product/35043 Features Trade up to 5 famous trading strategi
KT Volatility Oscillator
KEENBASE SOFTWARE SOLUTIONS
L'Oscillatore di Volatilità KT analizza i dati di mercato passati e presenti utilizzando una formula matematica per mostrare il risultato sotto forma di oscillatore. Le onde crescenti e decrescenti corrispondono rispettivamente a un'elevata e a una bassa volatilità dell'asset.  In poche parole, la volatilità è semplicemente una misura delle fluttuazioni di prezzo di un asset in un certo periodo di tempo. Senza volatilità, ci sarebbero pochi movimenti di mercato e i trader non potrebbero trarre p
KT COG Robot
KEENBASE SOFTWARE SOLUTIONS
KT COG Robot is a fully automated Expert Advisor based on the KT COG Indicator . The COG indicator was originally presented by John F. Ehlers in the May 2002 edition of Technical Analysis of Stocks & Commodities magazine. The EA fires a long trade when COG line cross above the signal line and a short trade is fired when the COG line cross below the signal line.  Adaptive Filtration Our adaptive filtration algorithm combines the original COG formula with the major trend direction and market acce
ACB Breakout Arrows EA
KEENBASE SOFTWARE SOLUTIONS
Questo è un Expert Advisor completamente automatizzato basato sul nostro indicatore personalizzato chiamato "ACB Breakout Arrows" . Le entrate si basano su un pattern di breakout che si verifica costantemente in entrambe le direzioni. L’intensità dei segnali può essere regolata tramite il parametro esterno "Signal Sensitivity". Conferma delle operazioni ACB Breakout Arrows EA consente di filtrare gli ingressi utilizzando un altro nostro indicatore personalizzato chiamato ACB Trade Filter . For
KT Asian Breakout
KEENBASE SOFTWARE SOLUTIONS
4 (1)
KT Asian Breakout carefully analyzes the range-bound market during the Asian session and then fires a long or short trade after doing some preassessment based on its inbuilt technical analysis module. The executed orders are closed within a day before the completion of the next day session. The inbuilt technical analysis module checks for the session range and compares it with the last 20 days price movement. If it finds any erratic price movement within the session, the orders are not executed
KT London Breakout
KEENBASE SOFTWARE SOLUTIONS
First thirty minutes are essential for a trading session. The early reaction of traders and market players sets a path for the rest of the day. KT London Breakout EA takes advantage of this phenomenon, and after analyzing the first thirty minutes of London session, it places two bidirectional pending orders. One of pending order is eventually canceled after realizing the market direction with certainty. It has been strictly tested and developed for EUR/JPY using 30-Min Time Frame. You can expe
Use of support and resistance in systematic trading is very subjective. Every trader has their own idea and way to plotting the support and resistance levels on the chart. KT Support and Resistance indicator take out this ambiguity out of the situation and automatically draws support and resistance levels following an algorithmic approach using a unique multi-timeframe analysis. When launched on the chart, It immediately scan the most significant extreme points across all the available timefra
Se fai trading nel Forex, avere informazioni dettagliate sulla forza delle valute e sulla correlazione tra coppie di valute può portare il tuo trading a un livello superiore. La correlazione ti aiuterà a dimezzare il rischio, mentre l'analisi della forza ti permetterà di massimizzare i profitti. Questo indicatore offre un approccio ibrido per selezionare le coppie di valute più appropriate, combinando l'analisi della forza delle valute e la correlazione tra coppie di valute. Come utilizzare l'a
MACD Divergence Seeker
KEENBASE SOFTWARE SOLUTIONS
KT MACD Divergence Seeker trades the regular and hidden divergence signals generated by our free indicator named KT MACD Divergence indicator. Trading the standalone divergences can be a risky affair that's why the KT MACD Divergence Seeker combines the standard divergence signals with an advanced analysis module to exploit the price inefficiencies on some FX pairs. What is the Divergence exactly? As a general conception if the price is making higher highs, then macd should also be making hig
KT Asian Breakout Indicator
KEENBASE SOFTWARE SOLUTIONS
L'indicatore KT Asian Breakout analizza una parte cruciale della sessione asiatica per generare segnali di acquisto e vendita in entrambe le direzioni, in base alla rottura del prezzo. Un segnale di acquisto si verifica quando il prezzo supera il massimo della sessione, mentre un segnale di vendita si verifica quando il prezzo scende al di sotto del minimo della sessione. Cose da ricordare Se la scatola della sessione è troppo ampia verticalmente, è consigliabile evitare di entrare in nuovi tra
MACD Divergence MT4
KEENBASE SOFTWARE SOLUTIONS
KT MACD Divergence mostra le divergenze regolari e nascoste che si formano tra il prezzo e l’oscillatore. Se la tua strategia di trading prevede un'inversione di tendenza, puoi utilizzare la divergenza regolare del MACD per identificare possibili punti di svolta. Se invece la tua strategia si basa sulla continuazione del trend, la divergenza nascosta del MACD sarà più adatta. Limitazioni di KT MACD Divergence Usare la divergenza del MACD come unico segnale d'ingresso può essere rischioso. Non
KT Bollinger Bands Trader MT4
KEENBASE SOFTWARE SOLUTIONS
KT Bollinger Bands Trader è un Expert Advisor completamente automatizzato che utilizza una strategia di ritorno alla media basata sulle bande di Bollinger durante i periodi di bassa volatilità. Il prezzo spesso reagisce sulla linea superiore o inferiore delle bande, ma non sempre si verifica un'inversione. Tuttavia, la probabilità di un’inversione è maggiore quando la volatilità è bassa. Ingressi Un trade long viene attivato quando il prezzo si posiziona correttamente al di sotto della banda in
KT CCI Divergence MT4
KEENBASE SOFTWARE SOLUTIONS
KT CCI Divergence shows the regular and hidden divergence created between the price and CCI oscillator. Divergence is one of the vital signals that depicts the upcoming price reversal in the market. Manually spotting the divergence between price and CCI can be a hectic and ambiguous task. Limitations of KT CCI Divergence   Using the CCI divergence as a standalone entry signal can be risky. Every divergence can't be interpreted as a strong reversal signal. For better results, try to combine it w
KT Heiken Ashi Smoothed MT4
KEENBASE SOFTWARE SOLUTIONS
KT Heiken Ashi Smoothed è una versione smussata dello Heiken Ashi standard e disegna frecce di acquisto/vendita quando la tendenza cambia. Viene tracciata una freccia di acquisto quando si passa da stato ribassista a rialzista. Viene tracciata una freccia di vendita quando si passa da rialzista a ribassista. Notifiche mobile, email, audio e pop-up incluse. Cosa è esattamente Heiken Ashi Smoothed? Filtra i falsi segnali e il rumore del Heiken Ashi standard applicando due medie mobili per render
KT MA Crossover MT4
KEENBASE SOFTWARE SOLUTIONS
KT MA Crossover disegna frecce di acquisto e vendita in base all'incrocio delle medie mobili selezionate. Inoltre, genera gli avvisi appropriati e visualizza il valore MFE (Escursione Più Favorevole) per ogni segnale consecutivo. L’incrocio delle medie mobili è una delle strategie più utilizzate dai trader di tutto il mondo. Di solito si basa su una media mobile veloce e una lenta per determinare segnali di ingresso in acquisto o vendita in base alla direzione dell’incrocio. Segnale di acquisto
KT Round Numbers MT4
KEENBASE SOFTWARE SOLUTIONS
KT Round Numbers plots the round number levels which are also commonly known as psychological levels in the Forex world. In the context of Forex trading, round number levels are those levels in which there are two or more zeroes at the end. They are named as 00 levels on the chart. Some traders also consider the halfway points as a valid round number level. They are named as 50 levels on the chart. Use of round number levels in trading Round number levels work as strong support and resistance
Filtro:
Nessuna recensione
Rispondi alla recensione