Price Direction Predictor
- Indicatori
- Versione: 1.51
- Aggiornato: 3 dicembre 2021
- Attivazioni: 5

PRICE Direction Predictor Indicator (LOW BUY PRICE 4 Limited time)
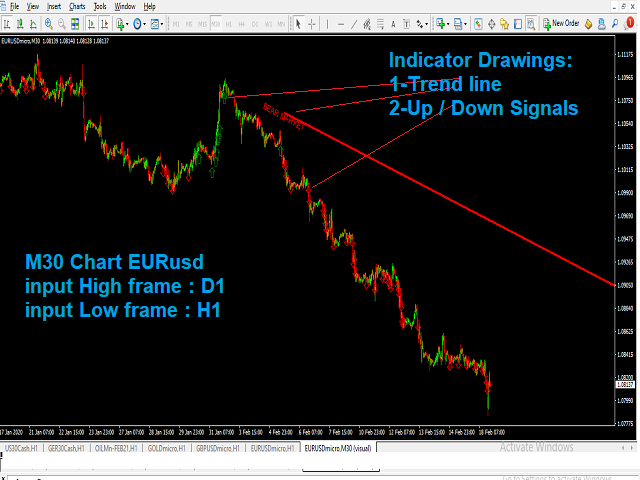
This Indicator provides Buy/Sell Signal based on calculations on Higher frame (main Trend) and Lower frame(Entry signals)
* You should select the higher and lower frame for indicator calculations
* You select the Trend line colors as you prefer
* Enable or disable Alerts!
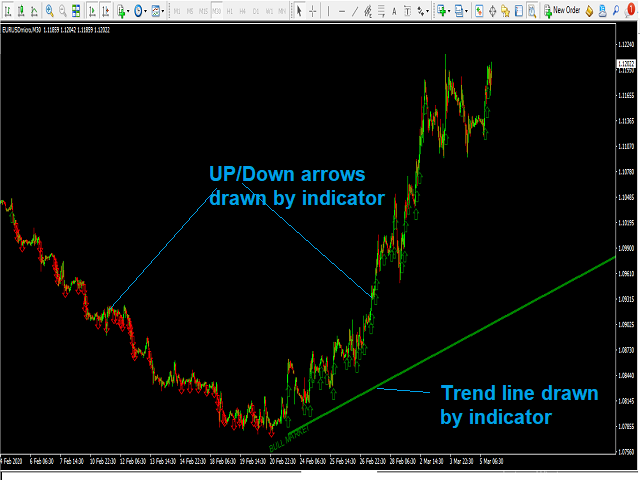
Trend lines UP/Down are drawn when a trend is detected
Wait for small arrows for entry :
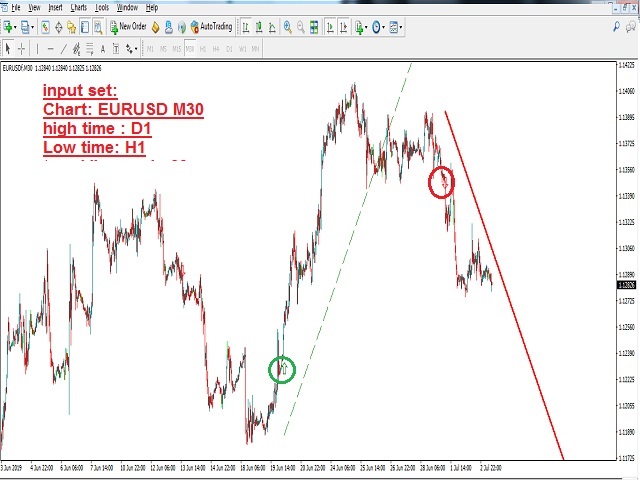
*Normally an UP arrow in an UP Trend is a BUY signal :
---you Close the BUY position IF a Reverse DOWN Trend signal appears
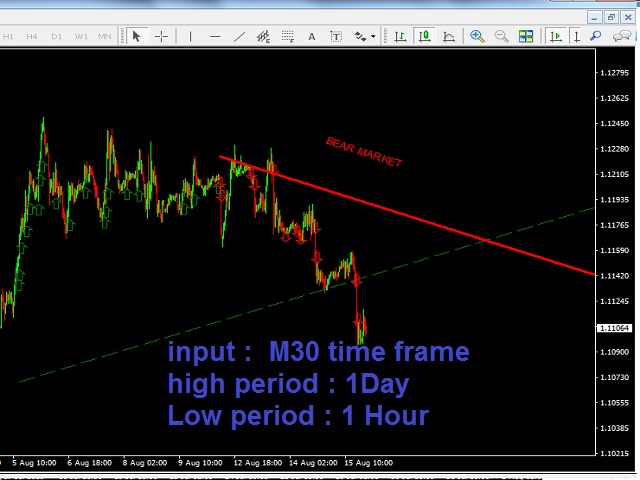
*Normally a DOWN arrow in a DOWN Trend is a SELL signal :
---you Close the SELL position IF a Reverse UP Trend signal appear
You can work on one entry signal in each trend OR you can accumulate multi-entries in same trend and Closes on trend reversal
my proposed input parameters :
M30 Chart ::::: High time frame : D1 Low time frame : H1
M1 Chart ::::: High time frame : H1 Low time frame : M5
L'utente non ha lasciato alcun commento sulla valutazione.