Multi Temporalities Osw MT5

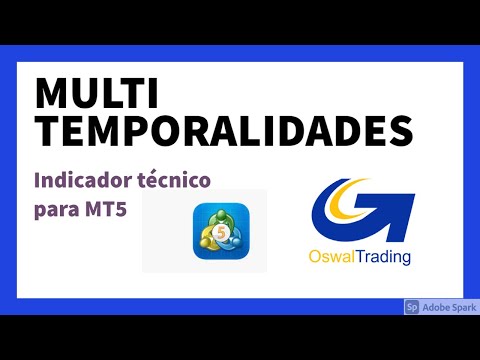
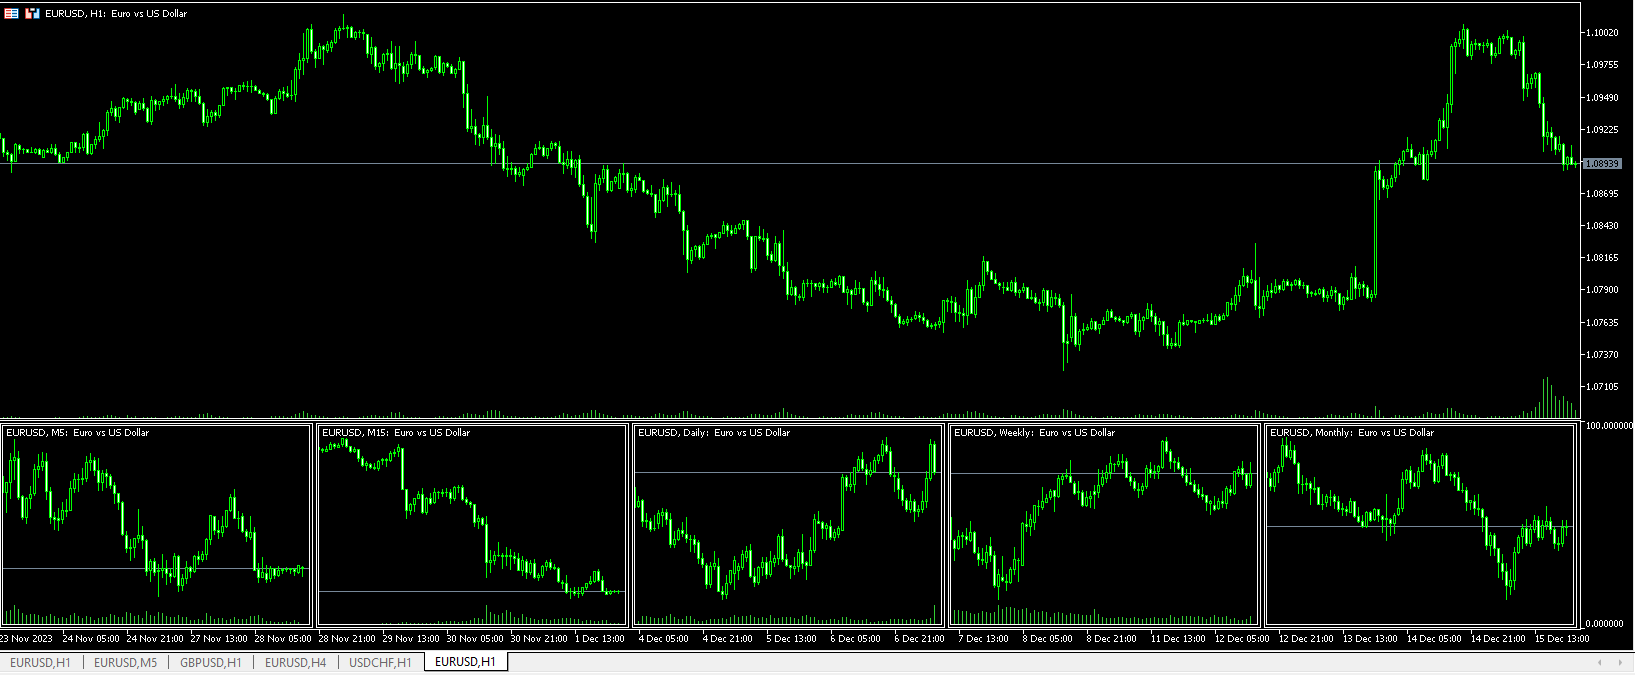
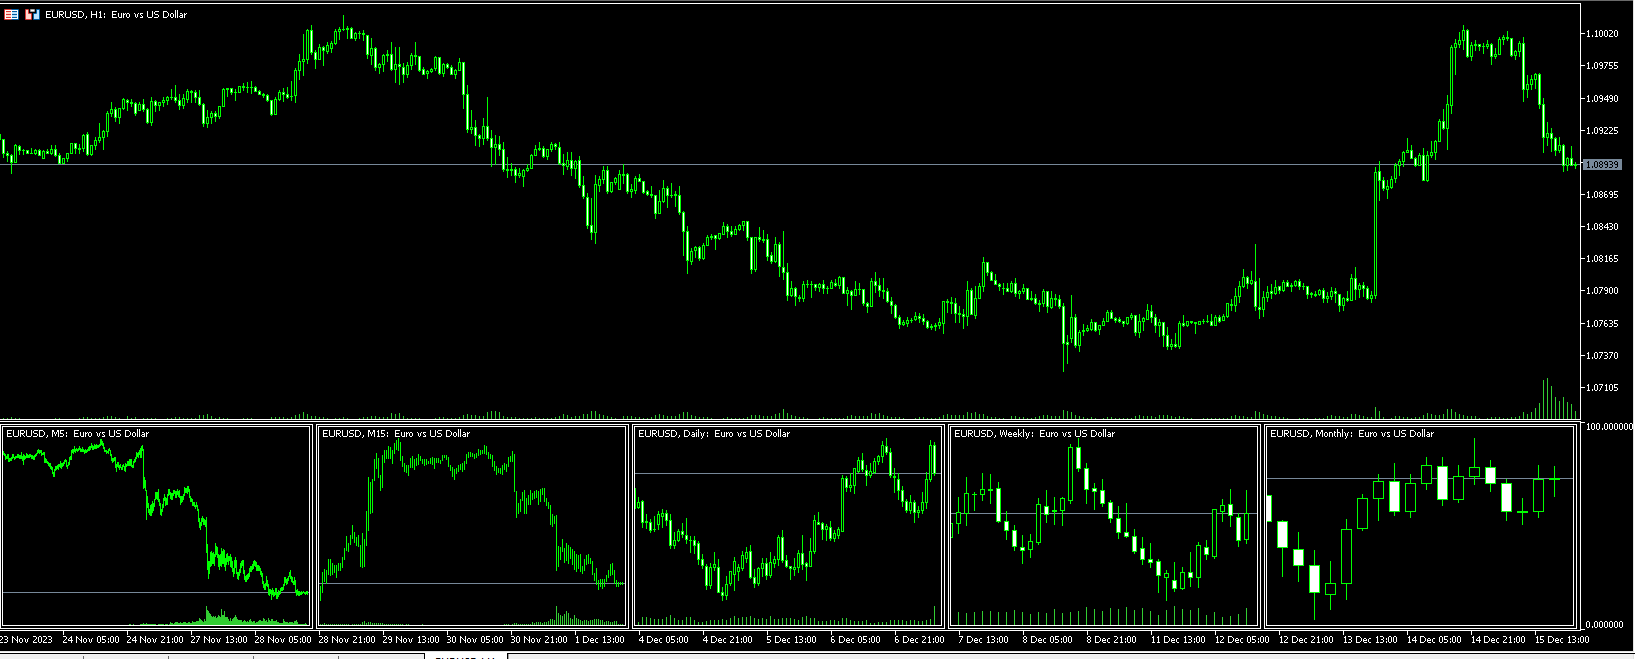
MULTI-TIMES FOR METATRADER 5

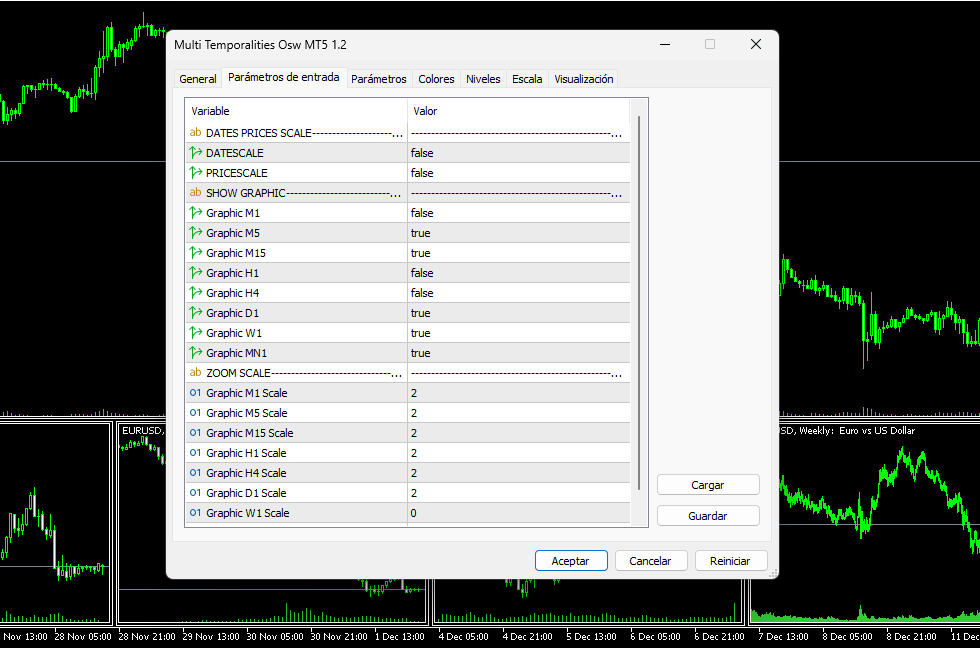
This indicator, in a lower window, shows the current chart in different timeframes, this can help you better decipher the market, taking into account the higher timeframes.

Among the settings that you can modify are:

view of prices in charts
view of the temporalities in the graphs
enable each of the graphics in the different temporalities
(M1, M5, M15, H1, H4, D1, W1, MN1).
Prodotti consigliati
Orderflow Super Candles - Simple Footprint Chart Indicator Platform: MetaTrader 5 (MT5)  (The last screenshot shows the use of the DOM tool in conjunction with the product.) 1. Product Introduction Orderflow Super Candles is a professional charting tool based on underlying Tick data analysis, designed to provide traders with a deep "X-ray" view of the market. By parsing the buy and sell volume distribution within each candlestick, this indicator visualizes the hidden market microstructure. It
--- StudentK Sync Chart --- 1. Move charts at the same time 2. Cross check among different Symbols and Timeframes 3. Plan your own trading strategies --- Context --- StudentK is not indicated as a master or K Sir for knowledgeable person who claims for winning all the time. (But lots of traders should know the fact that it is rarely truth, especially in fluctuated period of time) StudentK is a group of years-experienced traders who want to share amazing tools in Free and Paid versions. Aiming
Higher Time Frame Bars
Rajesh Kumar Nait
5 (1)
Questo indicatore traccia in modo efficiente qualsiasi altra candela temporale che desideri monitorare sullo stesso grafico 1. Seleziona un intervallo di tempo superiore per caricare le barre sullo stesso grafico 2. Personalizza i colori e lo stile dei candelieri 3. Scegli il numero di barre per disegnare candelieri 4. Tieni traccia delle candele complete con un intervallo di tempo più lungo insieme allo stoppino e al corpo 5. Facile e conveniente per coloro che non vogliono cambiare grafic
Rocket Trend
Andriy Sydoruk
The Rocket Trend indicator is trending. The indicator draws two-color points connected by lines along the chart. This is a trend indicator, it is an algorithmic indicator. It is easy to work and understand when a blue circle appears, you need to buy, when a red one appears, sell. The indicator is used for scalping and pipsing, and has proven itself well. Rocket Trend is available for analyzing the direction of the trend for a specific period of time. Ideal for novice traders learning the laws o
Beholder
Joao Marcilio
BEHOLDER – THE INDICATOR THAT REVEALS HIDDEN PATTERNS IN TIME THE REAL TRADER’S PROBLEM: TEMPORAL BLINDNESS Every week, thousands of traders face the same dilemma: A flood of economic events (NFP, CPI, Interest Rates, Retail Sales…) Very little time to analyze correlations Decisions made on “gut feeling,” without reliable historical context Trying to do this manually is insane: Scrolling back through dozens of weeks on the calendar Comparing event by event Trying to calculate patt
UT Bot Alerts MT5
Mohammad Taher Halimi Tabrizi
5 (2)
This indicator is converted from UT Bot alerts indicator by @QuantNomad of Trading View to MT5. its considering ATR and creating new candles on chart and also is giving good entry points based on its candles. all buffers of new candles and also entry signals are included as buffer so can be used easily on any EA. there are also some different strategies on the internet that can be used or contact me to create it for you.
Ali Levels Pro is an indicator designed to identify and draw levels of interest including: Opening Range High/Low with seconds precision,  Previous Session High/Low (if you are a Intraday trader who trades Indices or Commodities maybe you want to know yesterday New York Session high and low),  Overnight Session High/Low,  Previous Day High/Low,  Previous Week High/Low, and  Previous Month High/Low. Traders use this levels as support and resistance levels.  By searching for confluences between
First time on MetaTrader, introducing IQ Star Lines - an original Vedic Astrology based indicator. "Millionaires don't use astrology, billionaires do" . - J.P. Morgan, Legendary American financier and banker. IQ Star Lines, an unique astrological indicator purely based on   Vedic astrology   calculations, published for the   first time on Metatrader.  This unique tool plots dynamic planetary grid lines based on real-time stars, constellations, and celestial movements, which allows you to plot t
PZ Mean Reversion MT5
PZ TRADING SLU
3 (2)
Indicatore unico che implementa un approccio professionale e quantitativo al trading di reversione. Sfrutta il fatto che il prezzo devia e ritorna alla media in modo prevedibile e misurabile, il che consente regole di entrata e uscita chiare che superano di gran lunga le strategie di trading non quantitative. [ Installation Guide | Update Guide | Troubleshooting | FAQ | All Products ] Segnali di trading chiari Incredibilmente facile da scambiare Colori e dimensioni personalizzabili Implementa l
L'indicatore Trend Speaker è uno strumento potente progettato per i trader che vogliono monitorare e analizzare facilmente le tendenze del mercato in tempo reale. Fornisce segnali di acquisto e vendita chiari e affidabili sul grafico, rendendo estremamente conveniente valutare l'attuale tendenza del mercato. Con la sua interfaccia intuitiva, Trend Speaker garantisce che non perderai mai una potenziale opportunità di trading, aiutandoti a prendere decisioni informate e migliorare la tua strategia
KT Price Border MT5
KEENBASE SOFTWARE SOLUTIONS
KT Price Border crea un canale di prezzo a tre bande che identifica le potenziali aree di massimo e minimo nel mercato. Questi livelli possono anche essere utilizzati come supporti e resistenze dinamiche. La banda centrale può essere utilizzata per identificare la direzione del trend, rendendolo un indicatore di tipo trend-following. Inoltre, la sua semplicità d’uso e la chiarezza dei segnali di trading lo rendono particolarmente utile per i trader principianti. Caratteristiche Funziona bene c
The new update makes this indicator a complete tool for studying, analyzing and operating probabilistic patterns. It includes: On-chart Multi-asset percentage monitor. Configurable martingales. Twenty-one pre-configured patterns, including Mhi patterns and C3. An advanced pattern editor to store up to 5 custom patterns. Backtest mode to test results with loss reports. Trend filter. Hit operational filter. Martingale Cycles option. Various types of strategies and alerts. Confluence between patter
Session Kill zones with panel for quick changes. Asia Killzone London Killzone New York Killzone London Close Killzone In this indicator GMT+2 timings are used that are most common among many brokers. read the image attached in the screenshots to know more about sessions adjustments Session timings can be changed according to your broker timings and day light savings. Thank you :) Always open to feedback and criticism if it helps me provide you more value. - Rahul  My other indicators you may l
Advisor for hedging trading or pair trading. A convenient panel allows you to open positions on the necessary trading instruments and lots. Automatically determines the type of trading account - netting or hedging. Advisor can close all its positions upon reaching profit or loss (determined in the settings). A negative value is required to control losses (for example, -100, -500, etc.). If the corresponding fields are 0, the EA will not use this function.   Settings: Close profit (if 0 here
Go Ferramentas
Fabio Oliveira Magalhaes
This product is a set of tools that help the trader to make decisions, bringing information from different categories that complement each other: trend, support / resistance and candle patterns. It also has a panel with information about the balance. The trend has two different calculations and is shown as colored candles. Strategy 1 is longer, having 3 different states: up, down and neutral trend. Strategy 2 has a faster response and has only 2 states: up and down trend. Support and resistance
Fibonacci Sonar
Lorentzos Roussos
Fibonacci Sonar Il sonar di Fibonacci ha una libreria interna di modelli di price action raccolti da 28 simboli e 7 timeframe. Ogni pattern è diviso in 2 lati. Il lato prima e il lato dopo. Il sonar di Fibonacci usa il lato prima per riconoscere pattern simili. Il price action più recente (in qualsiasi momento) fino al prezzo di apertura della barra più recente è ciò che viene usato come lato prima per cercare nella libreria. Il lato dopo contiene un aggregato di tutte le attività che ogni pat
Session Map Pro automatically plots the critical price levels from previous trading days and overlays visual session markers, giving you an instant "roadmap" of potential support and resistance.   It transforms your chart into a strategic trading battlefield.   Detailed Line Reference Guide (For visual display m1-m5 works best but can be attached to any time frame) Default lookbackDays=5. "Set to 1 for today only and a less cluttered display"  1.Horizontal lines (n) Days)    Solid GREEN Line (
This is a simple arrow system based on Engulfing Candlestick Pattern. It gives you alerts on your smartphone when there is an engulfing candlestick pattern happens. Which type of alerts available? 1. It paints on chart Up/Down Arrows. 2. Popup message and sound alert in trading terminal window. 3. Push notification or Alert on your Android and IOS mobile phones (requires MT4 or MT5 app installed!) *Note: Use it on higher timeframes like H4 (4 hours), D1 (1 Day) then find trade opportunities on s
KT Horizontal Lines MT5
KEENBASE SOFTWARE SOLUTIONS
Su MetaTrader, tracciare più   linee orizzontali   e monitorare i rispettivi livelli di prezzo può essere un’attività noiosa. Questo indicatore disegna automaticamente più linee orizzontali a intervalli uguali per impostare avvisi di prezzo, tracciare livelli di supporto e resistenza, e per altri usi manuali. Questo indicatore è perfetto per i trader Forex alle prime armi che cercano opportunità per ottenere profitti rapidi tramite acquisto e vendita. Le linee orizzontali aiutano a identificare
Purpose : The SuperTrend indicator tracks price trends, plotting a line that follows the trend direction (up or down) and optionally fills the area between the trend line and the closing price Plots : SuperTrend Line : A colored line (green for uptrend, red for downtrend) plotted below the price in uptrends and above in downtrends. Filling : Optional filled area (bisque/pale green) between the SuperTrend line and the closing price, shown only if Show_Filling is true. Logic : Calculates ATR usin
Questo indicatore è un indicatore per l'analisi automatica delle onde perfetto per il trading pratico! Caso... Nota:   non sono abituato a usare nomi occidentali per la classificazione delle onde a causa dell'influenza della convenzione di denominazione di Tang Lun (Tang Zhong Shuo Zen), ho chiamato l'onda base come   penna   e la banda dell'onda secondaria come   segmento   At allo stesso tempo, il segmento ha la direzione del trend. La denominazione   è principalmente segmento di trend   (que
The Retracement Feeder  checks for retracement opportunities after the first move has occurred.  Basically it scans for the second wave of trend. Works with any financial instrument,  It does not repaint/change color or cancel arrows, Easy to set and use. Works great with Renko Charts ________________________________________ MT4 version  | Best used with :  Market Heart MT5 | How it works The indicator is based on RSI and Stochastics.  The algorithm used in the Retracement Feeder allows the Stoc
ADR Pro
Oleksandr Myrhorodskyi
ADR Pro — Auto Adaptive Daily Range & Volatility Indicator (ATR + ADR + Alerts) Auto Adaptation. All Markets. No Guesswork . Enhance your trading decisions with precise ADR levels — for Forex, Crypto, Stocks, Indices, Metals, Energy, Commodities, and ETFs. Easy Setup Professional Features Lifetime Free Updates ADR Pro is your personal "volatility compass" that shows the real daily range boundaries for any asset. Forget manual calculations and constant parameter adjustments — the indicator
QUANTUM OBSERVATION ENGINE Advanced Market Structure & Dominance Visualization Tool Quantum Observation Engine is a professional-grade, non-repainting market analysis indicator designed for traders who prefer clarity, structure, and decision control instead of direct buy/sell signals. This tool does NOT give forced trade entries. Instead, it reveals the internal state of the market in real time. WHAT THIS TOOL DOES Quantum Observation Engine con
FREE
ATR ZoneMaster calculates probability-based ATR levels for any timeframe and displays them as clear support and resistance zones. It is designed for traders who want quick visual levels without clutter . Features: Multiple ATR probability multipliers: 100%, 125%, 150%, 175%, 200% Works on any timeframe (M1 → MN1) Non-repainting, clean labels for easy decision-making Adjustable label shift and colors for chart clarity Minimalistic and intuitive chart design Benefits: Quickly identify potential
Esplora modelli per modelli a triangolo come triangolo simmetrico, triangolo asimmetrico o triangolo ad angolo retto, modello a cuneo come cuneo ascendente o cuneo discendente, modello di espansione e canale di tendenza Questo indicatore esplora il modello storico così come i modelli attuali, è il miglior indicatore per coloro che stanno cercando di risparmiare tempo disegnando manualmente una linea di tendenza o un triangolo e vogliono usarlo per l'analisi automatizzata del tracciamento dei m
Chart Replay Indicator MT5 Overview Chart Replay Indicator is a chart replay and training tool for MetaTrader that allows users to replay historical market data bar by bar directly on the chart. It is designed for manual backtesting, strategy training, and market behavior analysis without relying on future price information. Candles are displayed progressively to reproduce the flow of historical data. This indicator does not provide trading signals and does not execute or manage trades. Key Feat
A useful scanner/dashboard that shows the RSI values for multiple symbols and Time-frames. It can be easily hidden/displayed with a simple click on the scanner man top left of the dashboard. You can input upper and lower RSI values and the colours can be set to show when above/below these values. The default values are 70 and 30. There are also input colours for when the RSI is above or below 50 (but not exceeding the upper/lower levels Symbols and time-frames are input separated by commas. S
HIGH and LOW OTT
Mohammad Taher Halimi Tabrizi
This product is converted form Trading View of Kivanc Ozbilgic to be used on MT5 and below are descriptions of developer on Trading View: Anıl Özekşi's latest development on his precious OTT - Optimized Trend Tracker: In this version, there are two lines of OTT which are derived from HIGHEST price values (HOTT) and LOVEST price values (LOTT) which were originally sourced to CLOSE values on default OTT. Another significant difference is there is no Support Line (Moving Average) in this version
Three Candles Pattern
Edson Cavalca Junior
5 (1)
The patterns of 3 (three) Candles: Three White Soldiers; Three Black Crows; These are reversal patterns widely used by traders, as they have a high probability of showing the inversion of the current market movement. For example, if in a bullish trend there are three black crows, there is a high probability of reversing the current bullish movement. The Three White Soldiers have the following characteristics: There are 3 consecutive candles with a good body, that is, the difference between th
Gli utenti di questo prodotto hanno anche acquistato
Se acquisti questo indicatore, riceverai il mio Trade Manager Professionale + EA  GRATUITAMENTE. Innanzitutto è importante sottolineare che questo sistema di trading è un indicatore Non-Repainting, Non-Redrawing e Non-Lagging, il che lo rende ideale sia per il trading manuale che per quello automatico. Corso online, manuale e download di preset. Il "Sistema di Trading Smart Trend MT5" è una soluzione completa pensata sia per i trader principianti che per quelli esperti. Combina oltre 10 indicat
Power Candles MT5
Daniel Stein
5 (5)
Power Candles – Segnali di ingresso basati sulla forza per tutti i mercati Power Candles porta l’analisi di forza collaudata di Stein Investments direttamente sul grafico dei prezzi. Invece di reagire solo al prezzo, ogni candela viene colorata in base alla reale forza di mercato, consentendo di identificare immediatamente accumuli di momentum, accelerazioni della forza e transizioni di trend pulite. Un’unica logica per tutti i mercati Power Candles funziona automaticamente su tutti i simboli di
Divergence Bomber
Ihor Otkydach
4.9 (81)
Ogni acquirente dell’indicatore riceverà inoltre gratuitamente: L’utilità esclusiva “Bomber Utility”, che gestisce automaticamente ogni operazione, imposta i livelli di Stop Loss e Take Profit e chiude le posizioni secondo le regole della strategia I file di configurazione (set file) per adattare l’indicatore a diversi asset I set file per configurare il Bomber Utility in tre modalità: “Rischio Minimo”, “Rischio Bilanciato” e “Strategia di Attesa” Una guida video passo-passo per installare, conf
Entry In The Zone and SMC Multi Timeframe è uno strumento di analisi di mercato in tempo reale sviluppato sulla base degli Smart Money Concepts (SMC). È progettato per aiutare i trader ad analizzare la struttura del mercato in modo sistematico e ottenere una visione più chiara della direzione generale del mercato. Il sistema analizza automaticamente i Punti di Inversione, le Zone Chiave e la Market Structure su più timeframe, mostrando Point of Interest (POI), segnali No Repaint e Auto Fibonacci
SuperScalp Pro
Van Minh Nguyen
5 (1)
SuperScalp Pro – Sistema avanzato di indicatore per scalping con filtri multipli SuperScalp Pro è un sistema avanzato di indicatore per scalping che combina il classico Supertrend con molteplici filtri di conferma intelligenti. L’indicatore funziona in modo efficiente su tutti i timeframe da M1 a H4 ed è particolarmente adatto per XAUUSD, BTCUSD e le principali coppie Forex. Può essere utilizzato come sistema stand-alone o integrato in modo flessibile nelle strategie di trading esistenti. L’indi
Azimuth Pro
Ottaviano De Cicco
5 (1)
LAUNCH PROMO Azimuth Pro price is initially set at 299$ for the first 100 buyers. Final price will be 499$ . THE DIFFERENCE BETWEEN RETAIL AND INSTITUTIONAL ENTRIES ISN'T THE INDICATOR — IT'S THE LOCATION. Most traders enter at arbitrary price levels, chasing momentum or reacting to lagging signals. Institutions wait for price to reach structured levels where supply and demand actually shift. Azimuth Pro maps these levels automatically: swing-anchored VWAP, multi-timeframe structure lines, an
Ottieni l’indicatore AUX GRATUITO e il supporto EA Download diretto — Clicca qui [ D.I.C.E ] The DICE Indicator  Divergence in Chaos Environment è uno strumento MT5 specializzato per trader che applicano la Teoria delle Onde di Elliott nel contesto delle tecniche di Trading Chaos. Identifica divergenze nascoste e regolari nell’azione dei prezzi, sincronizzate con l’ambiente di mercato caotico descritto da Bill Williams. Caratteristiche principali Divergenza allineata alle Onde di Elliott: rilev
Atomic Analyst MT5
Issam Kassas
4.07 (28)
Innanzitutto, vale la pena sottolineare che questo indicatore di trading non è repaint, non è ridisegno e non presenta ritardi, il che lo rende ideale sia per il trading manuale che per quello automatico. Manuale utente: impostazioni, input e strategia. L'Analista Atomico è un indicatore di azione del prezzo PA che utilizza la forza e il momentum del prezzo per trovare un miglior vantaggio sul mercato. Dotato di filtri avanzati che aiutano a rimuovere rumori e segnali falsi, e aumentare il pote
Smart Stop Indicator – Precisione intelligente dello stop-loss direttamente sul grafico Panoramica Smart Stop Indicator è la soluzione ideale per i trader che desiderano posizionare il loro stop-loss in modo chiaro e metodico, senza dover indovinare o affidarsi all’intuizione. Questo strumento combina la logica classica del price action (massimi e minimi strutturali) con un moderno riconoscimento dei breakout per identificare il prossimo livello di stop realmente logico. In trend, in range o i
FX Power MT5 NG
Daniel Stein
5 (30)
FX Power: Analizza la Forza delle Valute per Decisioni di Trading Più Intelligenti Panoramica FX Power è lo strumento essenziale per comprendere la reale forza delle principali valute e dell'oro in qualsiasi condizione di mercato. Identificando le valute forti da comprare e quelle deboli da vendere, FX Power semplifica le decisioni di trading e rivela opportunità ad alta probabilità. Che tu segua le tendenze o anticipi inversioni utilizzando valori estremi di Delta, questo strumento si adatta
Trend Screener Pro MT5
STE S.S.COMPANY
4.84 (100)
Indicatore di tendenza, soluzione unica rivoluzionaria per il trading di tendenze e il filtraggio con tutte le importanti funzionalità di tendenza integrate in un unico strumento! È un indicatore multi-timeframe e multi-valuta al 100% non ridipingibile che può essere utilizzato su tutti i simboli/strumenti: forex, materie prime, criptovalute, indici e azioni. Trend Screener è un indicatore di tendenza che segue un indicatore efficiente che fornisce segnali di tendenza a freccia con punti nel gra
Top indicator for MT5   providing accurate signals to enter a trade without repainting! It can be applied to any financial assets:   forex, cryptocurrencies, metals, stocks, indices .  Watch  the video  (6:22) with an example of processing only one signal that paid off the indicator! MT4 version is here It will provide pretty accurate trading signals and tell you when it's best to open a trade and close it. Most traders improve their trading results during the first trading week with the help of
Super Signal – Skyblade Edition Sistema professionale di segnali di tendenza senza repaint / senza ritardo con tasso di vincita eccezionale | Per MT4 / MT5 Funziona meglio su timeframe più bassi, come 1 minuto, 5 minuti e 15 minuti. Caratteristiche principali: Super Signal – Skyblade Edition è un sistema intelligente di segnali progettato specificamente per il trading di tendenza. Utilizza una logica di filtraggio multilivello per identificare esclusivamente i movimenti direzionali forti, supp
L’indicatore evidenzia le zone in cui viene dichiarato interesse sul mercato , per poi mostrare la zona di accumulo degli ordini . Funziona come un book degli ordini su larga scala . Questo è l’indicatore per i grandi capitali . Le sue prestazioni sono eccezionali. Qualsiasi interesse ci sia nel mercato, lo vedrai chiaramente . (Questa è una versione completamente riscritta e automatizzata – non è più necessaria un’analisi manuale.) La velocità di transazione è un indicatore concettualmente nuo
FX Levels MT5
Daniel Stein
5 (12)
FX Levels: Supporti e Resistenze di Precisione Eccezionale per Tutti i Mercati Panoramica Rapida Cercate un modo affidabile per individuare livelli di supporto e resistenza in ogni mercato—coppie di valute, indici, azioni o materie prime? FX Levels fonde il metodo tradizionale “Lighthouse” con un approccio dinamico all’avanguardia, offrendo una precisione quasi universale. Basato sulla nostra esperienza reale con i broker e su aggiornamenti automatici giornalieri più quelli in tempo reale, FX
Innanzitutto, vale la pena sottolineare che questo Strumento di Trading è un Indicatore Non-Ridipingente, Non-Ridisegnante e Non-Laggante, il che lo rende ideale per il trading professionale. Corso online, manuale utente e demo. L'Indicatore Smart Price Action Concepts è uno strumento molto potente sia per i nuovi che per i trader esperti. Racchiude più di 20 utili indicatori in uno solo, combinando idee di trading avanzate come l'Analisi del Trader del Circolo Interno e le Strategie di Tradin
Grabber System MT5
Ihor Otkydach
4.82 (22)
Ti presento un eccellente indicatore tecnico: Grabber, che funziona come una strategia di trading "tutto incluso", pronta all’uso. In un solo codice sono integrati strumenti potenti per l’analisi tecnica del mercato, segnali di trading (frecce), funzioni di allerta e notifiche push. Ogni acquirente di questo indicatore riceve anche gratuitamente: L’utility Grabber: per la gestione automatica degli ordini aperti Video tutorial passo dopo passo: per imparare a installare, configurare e utilizzare
Shock Pullback
Suleiman Alhawamdah
5 (1)
Semplicemente, puoi iniziare a fare trading quando il movimento dei numeri bianchi — noti come "pips" — inizia ad apparire accanto alla candela corrente. I "pips" bianchi indicano che un'operazione di acquisto o vendita è attualmente attiva e si sta muovendo nella direzione corretta, come indicato dal colore bianco. Quando il movimento dei pips bianchi si interrompe e diventa di colore verde statico, questo segnala la fine della spinta attuale. Il colore verde dei numeri rappresenta il profitto
Market Structure Patterns
Samuel Manoel De Souza
4.47 (19)
Disponibile per   MT4   e   MT5 . Unisciti al canale Market Structure Patterns per scaricare materiale di studio e/o informazioni aggiuntive. Pubblicazioni correlate: Market Structure Patterns - Introduzione Acquistalo ora con 50% di sconto | Prezzo precedente $90 | Offerta valida fino al 31 dicembre | Un importante aggiornamento è in arrivo e il prezzo originale verrà adeguato. Market Structure Patterns   è un indicatore basato sui   Smart Money Concepts   che mostra gli   elementi SMC/ICT  
Quantum TrendPulse
Bogdan Ion Puscasu
5 (20)
Ecco   Quantum TrendPulse   , lo strumento di trading definitivo che combina la potenza di   SuperTrend   ,   RSI   e   Stocastico   in un unico indicatore completo per massimizzare il tuo potenziale di trading. Progettato per i trader che cercano precisione ed efficienza, questo indicatore ti aiuta a identificare con sicurezza le tendenze di mercato, i cambiamenti di momentum e i punti di entrata e uscita ottimali. Caratteristiche principali: Integrazione SuperTrend:   segui facilmente l'andame
IX Power MT5
Daniel Stein
4.92 (12)
IX Power: Scopri approfondimenti di mercato per indici, materie prime, criptovalute e forex Panoramica IX Power è uno strumento versatile progettato per analizzare la forza di indici, materie prime, criptovalute e simboli forex. Mentre FX Power offre la massima precisione per le coppie di valute utilizzando i dati di tutte le coppie disponibili, IX Power si concentra esclusivamente sui dati di mercato del simbolo sottostante. Questo rende IX Power una scelta eccellente per mercati non correlat
ARIScalping
Temirlan Kdyrkhan
ARIScalp is a powerful trading companion designed to generate high-probability entry signals with dynamic TP/SL/DP levels based on volatility. Built-in performance tracking shows win/loss stats, PP1/PP2 hits, and success rates all updated live. Key Features: Buy/Sell signals with adaptive volatility bands Real-time TP/SL/DP levels based on ATR Built-in MA Filter with optional ATR/StdDev volatility Performance stats panel (Success, Profit/Loss, PP1/PP2) Alerts via popup, sound, push, or email Cus
ARICoins
Temirlan Kdyrkhan
ARICoin is a powerful trading companion designed to generate high-probability entry signals with dynamic TP/SL/DP levels based on volatility. Built-in performance tracking shows win/loss stats, PP1/PP2 hits, and success rates all updated live. Key Features: Buy/Sell signals with adaptive volatility bands Real-time TP/SL/DP levels based on ATR Built-in MA Filter with optional ATR/StdDev volatility Performance stats panel (Success, Profit/Loss, PP1/PP2) Alerts via popup, sound, push, or email Cust
Gold Sniper Scalper Pro
Ich Khiem Nguyen
3.5 (8)
Gold Sniper Scalper Pro è un indicatore professionale per MetaTrader 5, progettato per supportare i trader nell'identificare punti di ingresso e gestire il rischio in modo efficace. L'indicatore fornisce un set completo di strumenti analitici che include un sistema di rilevamento dei segnali, gestione automatica di Entry/SL/TP, analisi del volume e statistiche delle performance in tempo reale. Guida utente per comprendere il sistema   |   Guida utente per altre lingue CARATTERISTICHE PRINCIPALI
FX Dynamic MT5
Daniel Stein
5 (5)
FX Dynamic: Monitora volatilità e trend con un’analisi ATR personalizzabile Panoramica FX Dynamic è uno strumento potente che sfrutta i calcoli di Average True Range (ATR) per fornire ai trader informazioni impareggiabili sulla volatilità, sia giornaliera che intraday. Impostando soglie di volatilità chiare—ad esempio 80%, 100%, 130%—puoi individuare rapidamente opportunità di profitto o ricevere avvisi quando il mercato supera i range abituali. FX Dynamic si adatta al fuso orario del tuo brok
PZ Swing Trading MT5
PZ TRADING SLU
5 (5)
Protect against whipsaws: revolutionize your swing trading approach Swing Trading is the first indicator designed to detect swings in the direction of the trend and possible reversal swings. It uses the baseline swing trading approach, widely described in trading literature. The indicator studies several price and time vectors to track the aggregate trend direction and detects situations in which the market is oversold or overbought and ready to correct. [ Installation Guide | Update Guide | Tro
Introduction to X3 Chart Pattern Scanner X3 Cherart Pattern Scanner is the non-repainting and non-lagging indicator detecting X3 chart patterns including Harmonic pattern, Elliott Wave pattern, X3 patterns, and Japanese Candlestick patterns. Historical patterns match with signal patterns. Hence, you can readily develop the solid trading strategy in your chart. More importantly, this superb pattern scanner can detect the optimal pattern of its kind. In addition, you can switch on and off individu
Trend Forecaster
Alexey Minkov
5 (7)
The Trend Forecaster indicator utilizes a unique proprietary algorithm to determine entry points for a breakout trading strategy. The indicator identifies price clusters, analyzes price movement near levels, and provides a signal when the price breaks through a level. The Trend Forecaster indicator is suitable for all financial assets, including currencies (Forex), metals, stocks, indices, and cryptocurrencies. You can also adjust the indicator to work on any time frames, although it is recommen
Trend indicator AI mt5
Ramil Minniakhmetov
5 (13)
Trend Ai indicator è un ottimo strumento che migliorerà l'analisi di mercato di un trader combinando l'identificazione della tendenza con punti di ingresso utilizzabili e avvisi di inversione. Questo indicatore consente agli utenti di navigare nelle complessità del mercato forex con fiducia e precisione Oltre ai segnali primari, l'indicatore Ai di tendenza identifica i punti di ingresso secondari che si presentano durante i pullback o i ritracciamenti, consentendo ai trader di capitalizzare le
Support And Resistance Screener è in un indicatore di livello per MetaTrader che fornisce più strumenti all'interno di un indicatore. Gli strumenti disponibili sono: 1. Screener della struttura del mercato. 2. Zona di ritiro rialzista. 3. Zona di ritiro ribassista. 4. Punti pivot giornalieri 5. Punti pivot settimanali 6. Punti pivot mensili 7. Forte supporto e resistenza basati sul modello e sul volume armonici. 8. Zone a livello di banca. OFFERTA A TEMPO LIMITATO: il supporto HV e l'indicatore
Altri dall’autore
RSI Alarm Osw
William Oswaldo Mayorga Urduy
RSI ALARM (For Metatrader 5) This indicator works like a normal RSI with all its settings (Periodicity, colors, levels, etc), but additionally, alarms can be set at the upper and lower level (Example 70 and 30), with the possibility of adjusting these levels by moving the blue and red lines to establish the upper and lower levels. You can also turn on and off an additional function that creates an arrow on the chart when the expected upper or lower RSI is met.
RSI Alarm Osw MT4
William Oswaldo Mayorga Urduy
RSI ALARM (For Metatrader 4) This indicator works like a normal RSI with all its settings (Periodicity, colors, levels, etc), but additionally, alarms can be set in the upper and lower level (Example 70 and 30), with the possibility of adjusting these levels by moving the upper and lower lines found on the indicator. You can also activate and deactivate an additional function that puts an arrow on the chart when the expected upper or lower RSI is met.
SORS Osw MT4
William Oswaldo Mayorga Urduy
THE SORS COMPLEXES (For Metatrader 4) This indicator is designed to draw the SORS lines on the graph, these are the modern way of calculating market points that it usually respects, they are comprised of supports and resistance, but unlike the classics, these are calculated from volatility endogenous and standard deviation, In the configuration you can change the color of each level linear and hide the ones that are not needed. A = Annual. M = Monthly. W = Weekly D = Daily.
Divergence Osw Metatrader 4
William Oswaldo Mayorga Urduy
DIVERGENCE OSW  (For Metatrader 4) This indicator works on divergences and has the following functions: Generate an alert when a divergence occurs. Create lines by calculating the Stoploss and Takeprofit according to projection waves of inverse waves. Create an arrow indicating the possible direction of the market. The signals sent by the indicator are given when the candle ends. The Trader must evaluate each divergence to take entries. Settings: Activation and deactivation of alerts. Alert inte
Trading Sesions MT4
William Oswaldo Mayorga Urduy
COMMERCIAL SESSIONS This indicator shows in the selected graph divided by tables each of the sessions ASIA, JAPAN, LONDON, NEW YORK: Allows you to configure: Session Color  ASIA, JAPON, LONDRES, NEW YORK Hide and show each session It works in the lowest timeframes on the market, among which H4, H1, M15, M5 and M1 are recommended. (Don't forget to check out our other indicators)
Automatic Support and Resistance Osw MT4 This Indicator graphs lines at the possible support and resistance points of the selected asset. it works in multiple temporalities. allows you to configure: Color of the lines. Width of the lines. Type of lines. When the indicator begins its operation, it analyzes the supports and resistances of higher levels for the temporality in which it is working.
Round Numbers Osw MT4
William Oswaldo Mayorga Urduy
ROUND NUMBERS (For Metatrader 4) This indicator allows you to add horizontal lines according to the round numbers that the asset contains. Unlike other indicators, this one calculates the closest levels dynamically and automatically as the price moves. works on currency pairs, indices, metals, stocks, etc. Round with 5 digits, 3 digits and integers of 10 100 or 1000. lines can be adjusted in parameters like: Hide the line or round number that you do not want to display. line color. line
SUPPORT LINES AND RESISTORS + COMMAND BLOCKS for METATRADER 4 A much more pleasant visual way to locate supports and resistance, unlike normal horizontal lines, these can be located from a specific point, without extending backwards, making the graph not look good, it also shows the name of the temporality in which it was created so that when you are operating, you can know to which temporality it belongs. You can also create order blocks in a comfortable and visual way, where you can also se
Whatch and Candle Alarm Osw MT4
William Oswaldo Mayorga Urduy
Osw Watch for METATRADER 4 This is an indicator that shows the remaining time for the current candle to expire on a watch, this is always located next to the last candle following the price, the numbers are shown the same as in the images, and can be modified both in size and color. between your settings you can set: the size of the numbers showing the time. the color of the numbers showing the time. Also within the configuration you can activate and deactivate so that an alarm sounds each
Alert Up Down MT4
William Oswaldo Mayorga Urduy
ALERT UP - DOWN FOR METATRADER 5 This indicator generates an alert when the price leaves the zone between the UP and DOWN lines. You can generate alerts of various types such as: > Sound > Message box > Message in the expert box > Mail (previously configured) > PUSH notifications (previously configured) The lines must be configured from the indicator properties and not from the lines properties, since if it is done from the lines properties, the finonacci may be affected. Among the s
Break Out Signal Osw
William Oswaldo Mayorga Urduy
BREAK OUT SEGNALE OSW (METATRADER 4) Vuoi lavorare rompendo alti e bassi? questo è l'indicatore perfetto per prendere segnali da questo tipo di voci. Non appena l'indicatore si avvia, non ti mostrerà alcun segnale, ma man mano che il prezzo avanza, leggerà il mercato fino a trovare lo schema perfetto per scoppiare. L'indicatore per leggere i massimi e i minimi ha una configurazione speciale per lo Zig Zag, che permette di prendere solo quelli più adatti. Come ogni indicatore, non dà voci p
Automatic OrderBlocks Osw MT4
William Oswaldo Mayorga Urduy
ORDERBLOCK AUTOMATICI OSW (METATRADER 5) Questo indicatore ha il compito di mostrare i Blocchi di ordini secondo alcune regole prestabilite, tra cui: >che c'è un impulso che rompe l'impulso precedente. >Quando viene trovato, è incaricato di trovare il modello di candele formato, calcolare nel modo più efficiente il massimo e il minimo del luogo, per creare il massimo e il minimo del Blocco ordini. >Dopo la creazione del blocco ordini, l'indicatore controlla costantemente se un candelabro a
Signal Indicator to Expert MT4
William Oswaldo Mayorga Urduy
Hai un indicatore che fornisce segnali e vuoi convertirlo in un Indicatore Expert? Con questo Indicatore Expert, puoi convertirlo senza riprogrammarlo o adattarlo. Segui semplicemente questi passaggi per configurarlo correttamente: 1) L'indicatore deve essere nella cartella degli indicatori. 2) Seleziona i buffer BUY e SELL forniti dall'indicatore. 3) Seleziona se desideri includere tutte le operazioni o solo quelle BUY o SELL. 4) Seleziona come desideri che le operazioni si chiudano: con
SORS Osw
William Oswaldo Mayorga Urduy
THE SORS COMPLEXES This indicator is designed to draw the SORS lines on the graph, these are the modern way of calculating market points that it usually respects, they are comprised of supports and resistance, but unlike the classics, these are calculated from volatility endogenous and standard deviation, In the configuration you can change the color of each level linear and hide the ones that are not needed. A = Annual. M = Monthly. W = Weekly D = Daily.
Automatic Support and Resistance Osw MT5 This Indicator graphs lines at the possible support and resistance points of the selected asset. it works in multiple temporalities. allows you to configure: Color of the lines. Width of the lines. Type of lines. When the indicator begins its operation, it analyzes the supports and resistances of higher levels for the temporality in which it is working.
Round Number Osw MT5
William Oswaldo Mayorga Urduy
ROUND NUMBERS (For Metatrader 5) This indicator allows you to add horizontal lines according to the round numbers that the asset contains. Unlike other indicators, this one calculates the closest levels dynamically and automatically as the price moves. works on currency pairs, indices, metals, stocks, etc. Round with 5 digits, 3 digits and integers of 10 100 or 1000. lines can be adjusted in parameters like: Hide the line or round number that you do not want to display. line color. line
SUPPORT LINES AND RESISTORS + COMMAND BLOCKS for METATRADER 5 A much more pleasant visual way to locate supports and resistance, unlike normal horizontal lines, these can be located from a specific point, without extending backwards, making the graph not look good, it also shows the name of the temporality in which it was created so that when you are operating, you can know to which temporality it belongs. You can also create order blocks in a comfortable and visual way, where you can also se
Whatch and Candle Alarm Osw MT5
William Oswaldo Mayorga Urduy
Osw Watch for METATRADER 5 This is an indicator that shows the remaining time for the current candle to expire on a watch, this is always located next to the last candle following the price, the numbers are shown the same as in the images, and can be modified both in size and color. between your settings you can set: the size of the numbers showing the time. the color of the numbers showing the time. Also within the configuration you can activate and deactivate so that an alarm sounds each
Alert Up Down MT5
William Oswaldo Mayorga Urduy
ALERT UP - DOWN FOR METATRADER 5 This indicator generates an alert when the price leaves the zone between the UP and DOWN lines. You can generate alerts of various types such as: > Sound > Message box > Message in the expert box > Mail (previously configured) > PUSH notifications (previously configured) The lines must be configured from the indicator properties and not from the lines properties, since if it is done from the lines properties, the finonacci may be affected. Among the s
Master Calendar Osw
William Oswaldo Mayorga Urduy
CALENDARIO OSW MASTER Questo indicatore è stato inizialmente creato per mio uso personale, ma l'ho migliorato poco a poco e ho implementato funzioni per aiutare il mio trading quotidiano e le funzioni continueranno ad essere implementate se saranno utili. DETTAGLI DEL CALENDARIO. >Calendario mobile e dettagliato delle notizie vicine alla data corrente, con dati quali: data, Paese, Valuta, Settore della notizia, Nome della notizia e Precedente, previsione e Dati attuali. >Il calendario si ag
Volumes Direction MT5
William Oswaldo Mayorga Urduy
DIREZIONE VOLUMI MT5 Normalmente l'indicatore del volume ha un cambio di colore predefinito quando il volume corrente è più alto del precedente, è importante ma non molto utile. Per questo motivo è stato creato questo indicatore che oltre al volume normale, quando la candela è rialzista o ribassista, le dipinge di un colore diverso, di default è blu per rialzista e rosso per ribassista, ma questi colori possono essere personalizzati al Il gusto del commerciante. Non dimenticare di controll
Trade Panel Osw MT5
William Oswaldo Mayorga Urduy
COMMERCIO PANNELLO OSW METATRADE 5 Questo pannello ti aiuterà a piazzare ordini a mercato, permettendoti di visualizzare il costo di ogni operazione, secondo la valuta stabilita nel conto. MANUALE DELLE FUNZIONI: 1) Selezionare uno STOPLOSS, con i pulsanti o per iscritto (si può attivare o disattivare l'opzione per metterlo). 2) Seleziona un TAKEPROFIT, con i pulsanti o per iscritto (Puoi attivare o disattivare l'opzione per metterlo). 3) Selezionare un VOLUME, con i pulsanti o per iscritt
GAPS Indicator MT5
William Oswaldo Mayorga Urduy
Indicatore GAPS Metatrader 5 Per alcune delle strategie utilizzate in indici, azioni e altri asset, il GAP di ogni candelabro viene solitamente misurato, ma se vogliamo farlo manualmente, questo può portarci a commettere errori di calcolo. Per questo motivo è stato creato "GAP Indicator", che mostra automaticamente il valore PIPS di ciascuno dei GAPS presentati tra ciascuna delle candele e genera un allarme quando compaiono, se l'opzione è attivata.
Signal Indicator to Expert MT5
William Oswaldo Mayorga Urduy
Hai un indicatore che dia segnali e vuoi convertirlo in Expert? Con questo esperto puoi convertirlo senza dover riprogrammare o adattare il tuo indicatore, devi solo seguire i passaggi per configurarlo correttamente: 1) L'indicatore deve trovarsi nella cartella degli indicatori. 2) Devi selezionare accuratamente i buffer ACQUISTA e VENDI forniti dall'indicatore. 3) Seleziona se vuoi intraprendere tutte le operazioni o solo quelle di tipo ACQUISTA o VENDI. 4) Seleziona come vuoi che le oper
Local Copy Trading Osw
William Oswaldo Mayorga Urduy
COPY TRADING LOCALE OSW Questo è uno strumento eccellente se vuoi copiare le negoziazioni da un conto all'altro. Per configurare l'esperto, è necessario seguire i seguenti passaggi: 1) Verificare che nel terminale SLAVE sia abilitato il trading automatico. 2) Verificare che l'EA disponga delle autorizzazioni di trading nel terminale SLAVE. 3) Aggiungere l'Expert a un grafico MASTER e configurarlo come MASTER. 4) Aggiungi l'esperto a un grafico SLAVE e configuralo come SLAVE (1,2,3,4,5) 5
Microlots Deriv
William Oswaldo Mayorga Urduy
MICROLOT DERIV Questo pannello sostituisce il tradizionale Pannello, con il quale è possibile inserire micro lotti quando il broker non ne consente il collocamento, solo a condizione che il broker offra lo step di Volume inferiore al Volume Minimo. Per esempio: se il Volume Minimo è 0.20 e il passo è 0.01, e vuoi mettere 0.02, normalmente non potrai farlo, ma questo strumento si occuperà di gestire l'invio dell'ordine in modo che l'ordine aperto rimanga al valore di 0,02. Suggerimenti per i
Heat Map OSW
William Oswaldo Mayorga Urduy
OSW MAPPA TESTA Questo indicatore è ideale per conoscere lo stato attuale di tutte le combinazioni di valute e per conoscerne la variazione. La variazione è calcolata dallo spostamento percentuale del prezzo dal prezzo corrente a 24 ore fa, o quanto configurato nel menu. Per conoscere la variazione di una valuta, devi semplicemente guardare la valuta principale, ad esempio: nell'EUR devi guardare verticalmente per confrontare con altre valute e alla fine trovi la media di tutti questi valor
ESS Enguifing Strategy Signals
William Oswaldo Mayorga Urduy
ESS ENGUIFING SEGNALI DI STRATEGIA Questo indicatore rileva candele di tipo busta a cui è applicato un filtro, questo filtro è composto da 3 strategie insieme, con le quali è possibile identificare la massima efficacia possibile all'interno dei parametri misurabili. I segnali sono indicati da frecce verso l'alto e verso il basso per ciascuna delle direzioni e puoi anche attivare o disattivare avvisi, e-mail e messaggi push sul cellulare. Vale la pena ricordare che nessun indicatore è efficac
MultiTimeFrame Moving Average Osw
William Oswaldo Mayorga Urduy
MULTI TIME FRAME MEDIA MOBILE OSW (METATRADER 5) Questo indicatore ti permetterà di aggiungere medie mobili di tutti i tipi di configurazione, con la differenza che se sei in un timeframe puoi aggiungere quella di livello superiore, per fare un esempio, se sei in un timeframe di 5 minuti e vuoi vedere l'esponenziale della media mobile di 20 della temporalità di 15 minuti, 1 ora e 4 ore, solo configurando i parametri corretti nel menu dell'indicatore potrai vederli come mostrato nelle immagini
Points Candles Osw
William Oswaldo Mayorga Urduy
PUNTI CANDELE OSW (METATRADER 5) Con questo indicatore puoi conoscere la dimensione in punti di ciascuna delle candele che vengono gestite nel grafico, fornendoti informazioni sulla dimensione e la direzione di ognuna, l'indicatore punterà verso l'alto se è rialzista e verso il basso se è ribassista . Inoltre puoi anche nascondere o mostrare tutte le candele, solo quelle rialziste o solo quelle ribassiste, questo è per i broker che gestiscono asset che danno candele più forti in una direzione
Filtro:
Nessuna recensione
Rispondi alla recensione