ABC Trend Detector Pro
- Indicatori
- Versione: 6.100
- Aggiornato: 10 giugno 2020
- Attivazioni: 5

Description
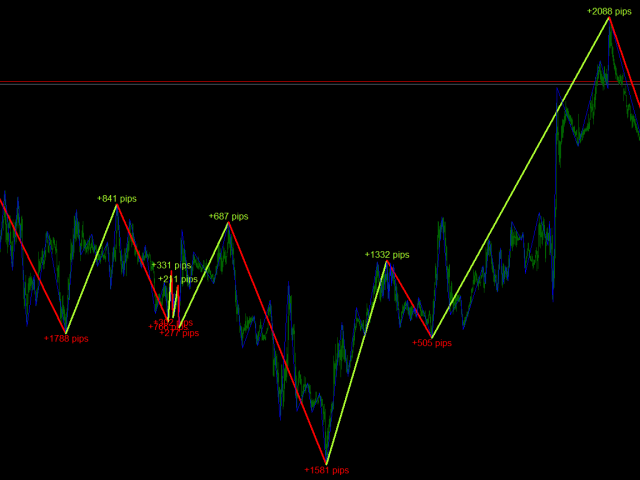
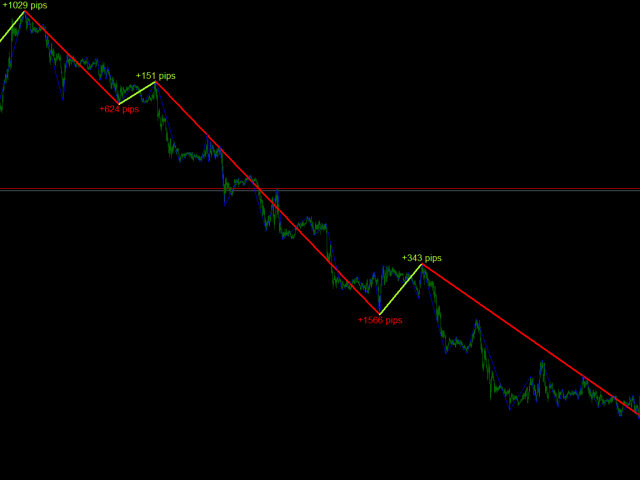
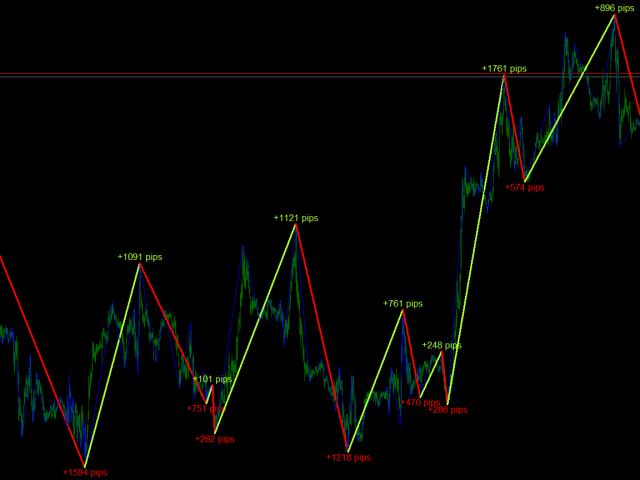
ABC Trend Detector Pro is an indicator that identifies impulses and trends in the market and displays their presence on the price chart. Found patterns are drawn as colored connecting lines between their highs and lows. Above / below each extreme, the value of the range (the number of pips) of the trend is displayed.
Recommendations
You can use this indicator to determine the trend and, accordingly, to determine the direction of opening a position or closing an opposite position.
Parameters
===== _INDICATOR_SETTINGS_ ===== - indicator settings
Maximum History Bars - maximum number of history bars for calculating the indicator.
Average True Range Period - ATR indicator period (used to calculate the difference between moving averages).
Fast Moving Period - period of the fast moving average.
Slow Moving Period - period of the slow moving average.
Movings Difference - minimum difference between moving averages (for searching impulses) expressed in the number of ATR-values.
Impulse Boost Level - boost level of impulse.
Turn Point Correction - correction of turn point.
A-Wave Create Type - creation type of wave A.
B-Wave Create Type - creation type of wave B.
Use Vic Line - use Vic Sperandeo line.
===== _GRAPHICS_SETTINGS_ ===== - graphics settings
Paint Impulses - draw impulses.
Impulse Lines Color - color of impulse lines.
Impulse Lines Width - width of impulse lines.
Up-Trend Lines Color - color of up-trend lines.
Down-Trend Lines Color - color of down-trend lines.
Trend Lines Width - width of trend lines.
Paint Vic Line - paint Vic Line.
Vic Line Color - color of Vic Line.
Vic Line Width - width of Vic Line.
===== _NOTIFICATIONS_SETTINGS_ ===== - notifications settings
Push Notification - allow push notification.
E-Mail Notification - allow e-mail notification.