VAP Volume at price
- Indicatori
- Versione: 1.10
- Aggiornato: 15 maggio 2022
- Attivazioni: 5

Traders know that paying attention to volume can make the crucial difference in understanding how the market will move. Information such as the traded volume, frequency of executed trades and the correlation of buyers and sellers at a certain time period expand our understanding of volume and can significantly improve the accuracy of our trading forecast.
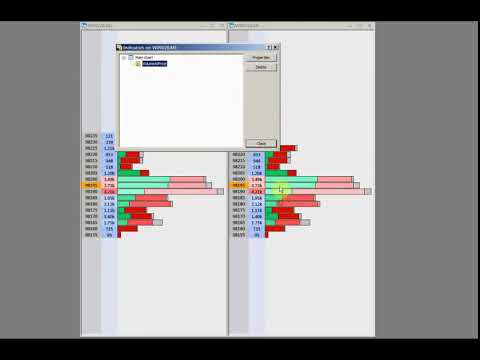
The Volume at Price (or VAP) indicator displays the cumulative traded volume for each price level during a time period, as well as the correlation of buyers and sellers agression, through the use of horizontal bars, such as a Market Profile. This feature expands the volume information into more detailed components, making it possible to identify points of support or resistance, at price levels which account for big traded volumes.
Features:
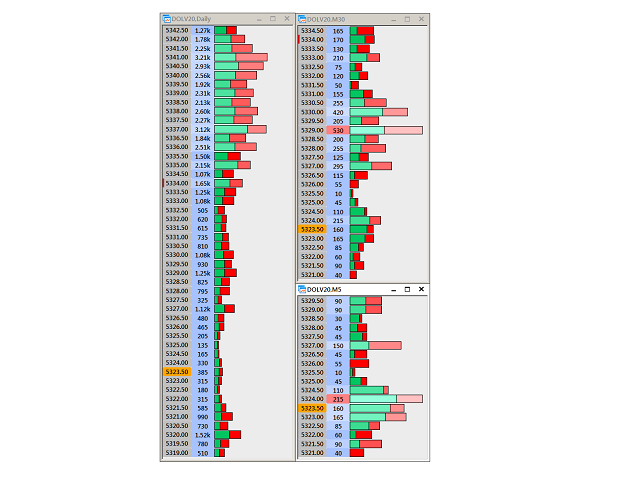
- columns for price and volumes
- horizontal bars are aligned to the price level and represent the cumulative volume traded at that price.
- bars are proportional in lengths to the volume traded at that particular level during thetime period.
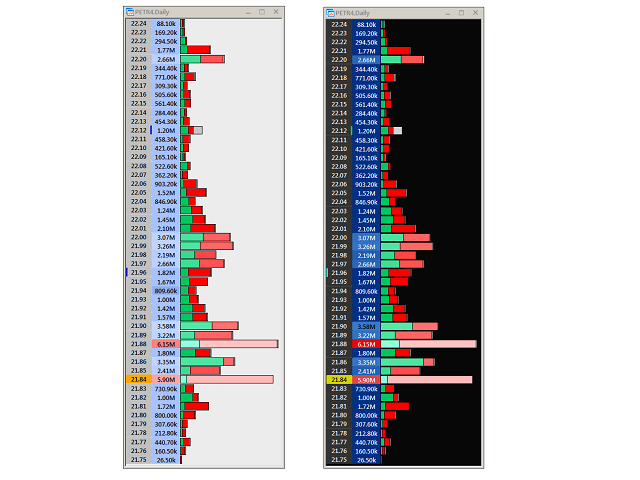
- bars also show the cumulative agression of either Buyers or Sellers, using different colors (green for buyers; red for sellers; light gray for direct deals).
Important: The Volume at Price indicator only works if the broker provides all tick information for the symbol. As long as the broker provides this information, the indicator works both in exchange or futures market. You can check your terminal (Times and Sales) in order to find out whether your broker provides this information for the trading instrument. Also important to note is that the indicator should be installed in a plain chart, without any other indicator or EA.
| Parameter | Description |
|---|---|
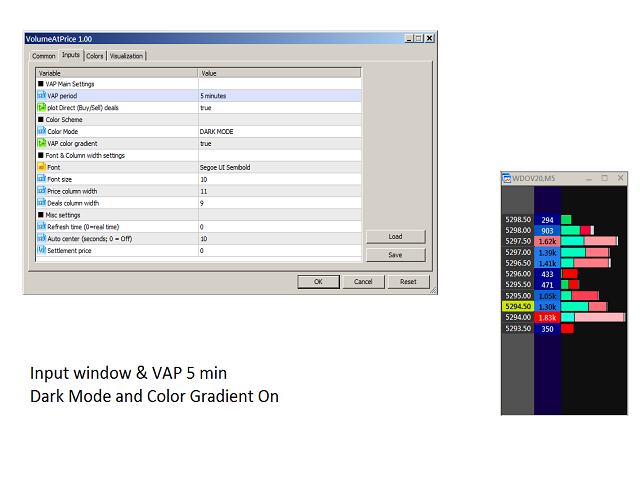
| VAP Period | Sets the period (time window) in which the indicator will work. Choices are Daily, 60 min, 30 min, 15 min, 10 min, 5 min and 1 min |
| Plot Direct Deals | Values can be True or False. If set to TRUE, Direct Deals will be plotted and their volumes added in VAP calculations Direct Deals are those deals one cannot identify their trading direction; they appear in Times and Sales window as either type N/A or type BUY/SELL. |
| Color Mode | Values are: Dark Mode or Light Mode Dark mode is based on black background while Light mode is based on Metatrader default color |
| VAP Color Gradient | Values: True or False. If set to true, indicator will plot Vap levels using a gradient color, lighting up the color as the volume grows. It will be applied to volume label as well, using the same rules (bigger volumes = lighter colors). Also, shades of red will be used to paint (highlight) volume labels with the biggest accumulations. |
| Font | Font name |
| Font size | Font size |
| Price label size | size of Price label column (in characters) * |
| Deals label size | size of Deals label column (in characters) * |
| Refresh time (0=real time) | Time interval (in seconds) for the updating of the indicator. Used to save system resources, if needed. A value of 0 (zero) means the indicator will update data in real time (the default setting). |
| Auto center | Time (in seconds) to automatically center the indicator on the screen |
| Settlement Price | Settlement Price for the trading session If set, the indicator will plot a yellow mark at this price, to help identify this important trade point ** |
(*) - label size is automatically calculated based on Font and Font Size; user is able to increase/decrease this size by adjusting the values in these fields.
(**) - the VAP indicator will plot a mark at price levels for the Volume-Weighted Average Price (VWAP) and Session Open Price as well
Keyboard Shortcut & mouse:
| Keys / Mouse action | Description |
|---|---|
| C | Center indicator in the screen (center by last price) |
| R | Reset VAP calculation for the selected period |
| Z | Clear VAP and resume calculation starting at next tick When using this feature, VAP does not reset calculations but keeps adding deals until a reset is performed through keyboard shortcut R |
| Mouse Scroll | Scrolls screen up or down Ctrl+Mouse Scroll scrolls the screen in bigger steps (4 levels at a time). When you scroll the indicator up or down, auto center is turned off. To turn it on again, use keyboard shortcut C. |
| Mouse Click & Drag | Drags indicator up or down. Auto center does not turn off |
L'utente non ha lasciato alcun commento sulla valutazione.