Flat Flag Patterns MT4

  • Indicatori
  • Keijinro Mizutani
    Keijinro Mizutani
    Hello, I’m kotoha, a system designer focused on research-driven, rule-based trading tools for the MT5 platform.
    My work centers on market structure analysis, swing dynamics, and Fibonacci-based logic.
  • Versione: 1.2
  • Attivazioni: 5

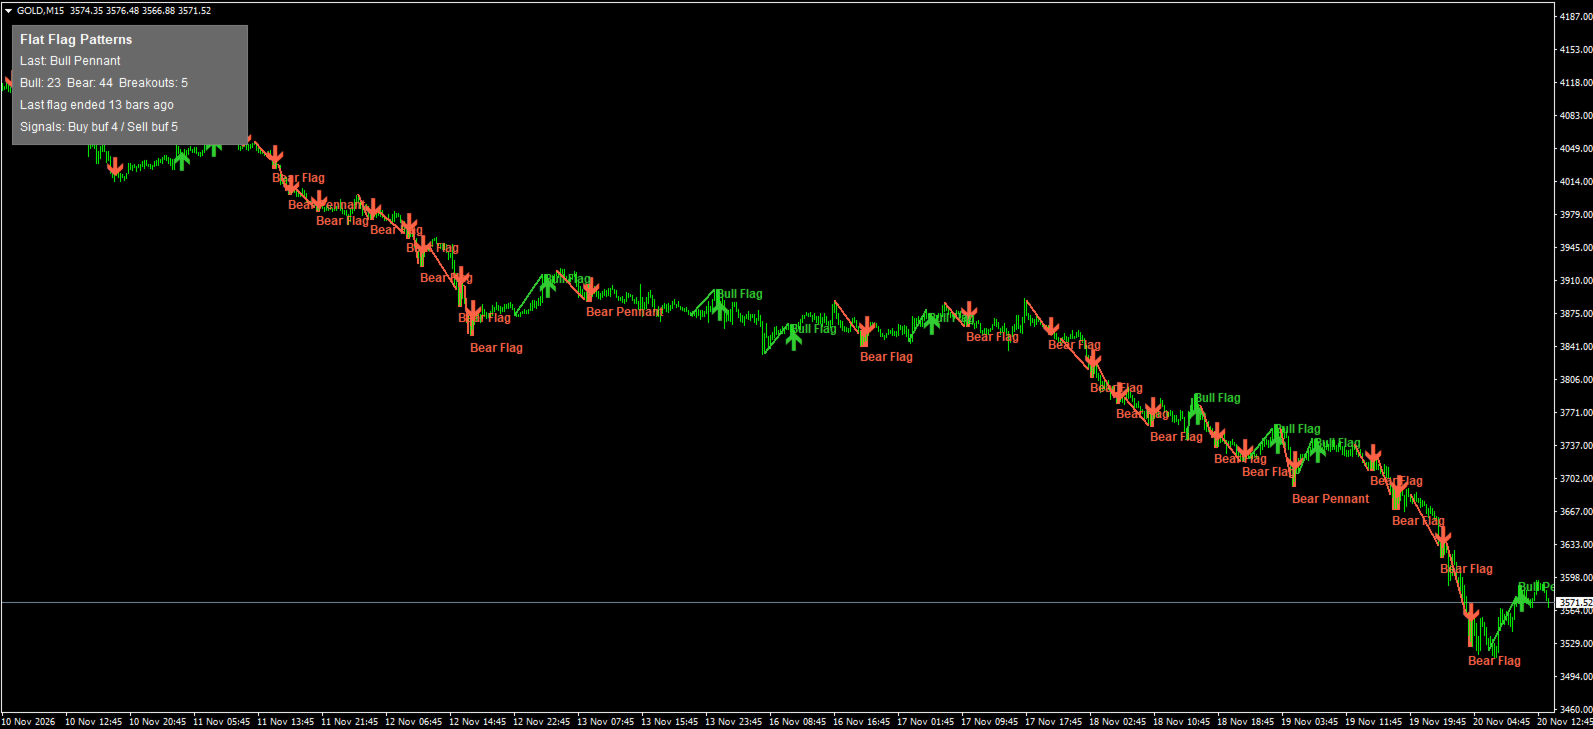
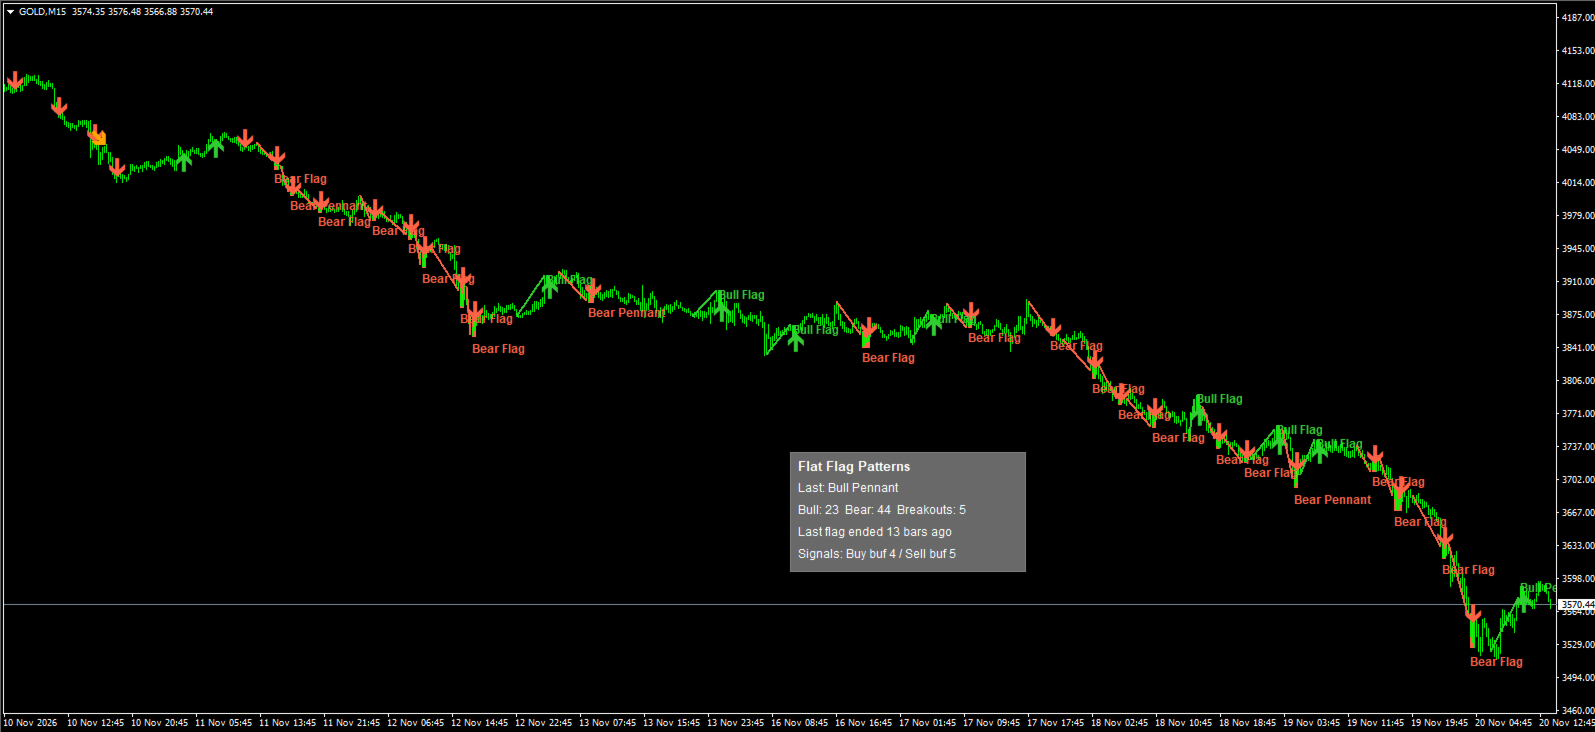
Flat Flag Patterns automatically detects and draws flag and pennant continuation patterns on your MT4 chart. It looks for a strong one-way move (the pole) followed by a small consolidation (the flag), and draws the pole line, the flag zone, a label and arrows directly on the chart.

Detection is normalised by volatility (ATR), so the same yardstick applies across symbols and timeframes. For the pole it also checks that the move was clean and one-directional — choppy two-way action does not count as a pole. For the flag it looks at the retracement depth against the pole and the width of the consolidation (the detailed combination of conditions is described in the included manual).

Patterns drawn:

  • Bull Flag / Bear Flag: a consolidation after an up pole or a down pole
  • Bull Pennant / Bear Pennant: when the range narrows into the later part of the consolidation, it is labelled as a pennant
  • Breakout: a bar that closes outside the flag range is marked with a separate arrow

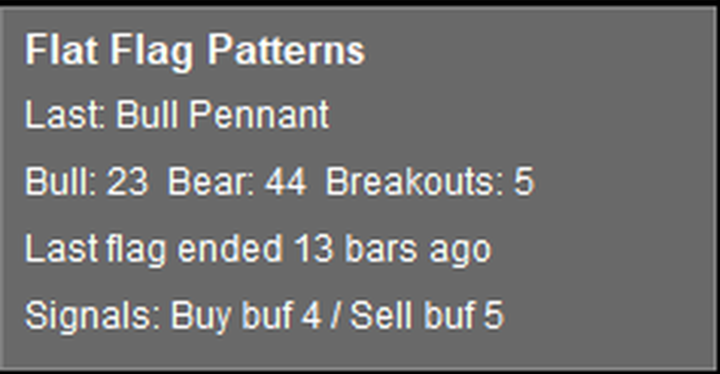
The panel (top-left by default) shows the latest pattern type, the counts of bull / bear patterns and breakouts within the scan range, and how many bars have passed since the latest flag. The panel can be dragged anywhere; its position is remembered per chart.

Buffers: 0 = Bull Flag, 1 = Bear Flag, 2 = Bull Breakout, 3 = Bear Breakout (display arrows). Buffers 4 = Buy and 5 = Sell are signal outputs: a value of 1.0 is written only on the bar where a breakout is confirmed (edge type), and other MT4 tools or EAs can read the signal at shift 1.

Specifications: MetaTrader 4 (PC) only; works on any symbol and timeframe. Detection scans the most recent history bars (default 1,500) and draws up to the latest 30 patterns; both are adjustable. Detection results vary by symbol, timeframe and broker data. This indicator does not place orders.

Disclaimer: This product is a pattern-detection and display tool based on historical and current price data. It is not investment advice, not a prediction, and does not guarantee any future result or profit. Trading involves risk; decisions are your own responsibility.
Prodotti consigliati
Wave Wolf MT4
Andrei Salanevich
L'indicatore Forex Wave wold MT4 è progettato per cercare le onde di Woolf e visualizzarle nella finestra corrente del terminale di trading. Un ottimo indicatore per i trader che utilizzano le onde di Wolfe nel trading. La sua applicazione nelle strategie di trading aumenterà notevolmente la loro efficienza e redditività. INFORMAZIONI SULL'INDICATORE A differenza di altri indicatori onda Wold, indicatore Forex onda wold MT4 ha una serie di caratteristiche che aumentano notevolmente la sua effi
Alpha Trend sign has been a very popular trading tool in our company for a long time. It can verify our trading system and clearly indicate trading signals, and the signals will not drift. Main functions: Based on the market display of active areas, indicators can be used to intuitively determine whether the current market trend belongs to a trend market or a volatile market. And enter the market according to the indicator arrows, with green arrows indicating buy and red arrows indicating se
VR Cub
Vladimir Pastushak
VR Cub è un indicatore per ottenere punti di ingresso di alta qualità. L'indicatore è stato sviluppato per facilitare i calcoli matematici e semplificare la ricerca dei punti di ingresso in una posizione. La strategia di trading per la quale è stato scritto l'indicatore ha dimostrato la sua efficacia per molti anni. La semplicità della strategia di trading è il suo grande vantaggio, che consente anche ai trader alle prime armi di commerciare con successo con essa. VR Cub calcola i punti di apert
Magic Balance
Daniil Evstratenko
The indicator shows which trading pairs, strategies, robots and signals that you use are profitable and which are not. The statistic of trades and balance graph are displayed in the account currency and pips - to switch simply click on the graph. button "$"(top left) - minimize/expand and move the indicator panel button ">"(bottom right) - stretching and resetting to the original size Statistic of trades 1 line - account balance, current profit and lot of open trades; 2 line - the number of all
Indicatore Crypto_Forex Pattern PINBAR per MT4, senza ridisegnare, senza ritardi. - L'indicatore "PINBAR Pattern" è un indicatore molto potente per il trading basato sull'azione dei prezzi. - L'indicatore rileva le PinBar sul grafico: - PinBar rialzista - Segnale a freccia blu sul grafico (vedi immagini). - PinBar ribassista - Segnale a freccia rossa sul grafico (vedi immagini). - Con avvisi su PC, dispositivi mobili ed e-mail. - L'indicatore "PINBAR Pattern" è eccellente da combinare con i liv
Noize Absorption Index MT4
Ekaterina Saltykova
5 (1)
Noize Absorption Index - is the manual trading system that measures the difference of pressure between bears forces and bulls forces. Green line - is a noize free index that showing curent situation. Zero value of index shows totally choppy/flat market.Values above zero level shows how powerfull bullish wave is and values below zero measures bearish forces.Up arrow appears on bearish market when it's ready to reverse, dn arrow appears on weak bullish market, as a result of reverse expectation. S
The indicator displays the data of the Stochastic oscillator from a higher timeframe on the chart. The main and signal lines are displayed in a separate window. The stepped response is not smoothed. The indicator is useful for practicing "manual" forex trading strategies, which use the data from several screens with different timeframes of a single symbol. The indicator uses the settings that are identical to the standard ones, and a drop-down list for selecting the timeframe. Indicator Paramet
Trendiness Index
Libertas LLC
5 (3)
"The trend is your friend" is one of the best known sayings in investing, because capturing large trendy price movements can be extremely profitable. However, trading with the trend is often easier said than done, because many indicators are based on price reversals not trends. These aren't very effective at identifying trendy periods, or predicting whether trends will continue. We developed the Trendiness Index to help address this problem by indicating the strength and direction of price trend
Lo Scanner Multivaluta dell'Indice Direzionale Medio (ADX) MT4 è un indicatore di trading avanzato progettato per analizzare simultaneamente più coppie di valute. Beneficia i trader che cercano di migliorare il loro processo decisionale fornendo segnali in tempo reale basati sull'Indice Direzionale Medio, consentendo un'analisi efficiente delle tendenze di mercato. Questo strumento semplifica l'esperienza di trading semplificando l'identificazione della forza della tendenza e del movimento direz
Diamond Pattern
Ugur Oezcan
5 (1)
The diamond top and bottom are reversal patterns. It represents a rally to a new high with a drop to a support level followed by a rally to make a new high and a quick decline, breaking the support level to make a higher low. The bounce from the higher low is then followed by a rally, but making a lower high instead. Once this behavior is identified, prices then break the trend line connecting the first and second lows and start to decline further. You can find MT5 version hier Indicator shows
The indicator detects and displays Shark harmonic pattern (see the screenshot). The pattern is plotted by the extreme values of the ZigZag indicator (included in the resources, no need to install). After detecting the pattern, the indicator notifies of that by a pop-up window, a mobile notification and an email. The indicator highlights the process of the pattern formation and not just the complete pattern. In the former case, it is displayed in the contour triangles. After the pattern is comple
Auto Fibo Pro m
DMITRII GRIDASOV
Indicatore "Auto FIBO Pro" Crypto_Forex: è un ottimo strumento ausiliario nel trading! - L'indicatore calcola e posiziona automaticamente sul grafico i livelli di Fibo e le linee di tendenza locali (colore rosso). - I livelli di Fibonacci indicano le aree chiave in cui il prezzo può invertirsi. - I livelli più importanti sono 23,6%, 38,2%, 50% e 61,8%. - Puoi usarlo per lo scalping di inversione o per il trading di zone grid. - Ci sono molte opportunità per migliorare il tuo sistema attuale usa
Trend Oscillator - è un indicatore Crypto_Forex personalizzato avanzato, uno strumento di trading efficiente! - Viene utilizzato un nuovo metodo di calcolo avanzato - 20 opzioni per il parametro "Prezzo per calcolo". - L'oscillatore più fluido mai sviluppato. - Colore verde per i trend al rialzo, colore rosso per i trend al ribasso. - Valori di ipervenduto: inferiori a 5, valori di ipercomprato: superiori a 95. - Ci sono molte opportunità per aggiornare anche le strategie standard con questo in
Price Magnet — Price Density and Attraction Levels Indicator Price Magnet is a professional analytical tool designed to identify key support and resistance levels based on statistical Price Density. The indicator analyzes a specified historical period and detects price levels where the market spent the most time. These zones act as “magnets,” attracting price action or forming a structural base for potential reversals. Unlike traditional Volume Profile tools, Price Magnet focuses on price-time d
Trend Ray
Andriy Sydoruk
The indicator shows the potential trend direction by cyclical-wave dependence. Thus, all the rays of the intersection will be optimal rays, in the direction of which the price is expected to move, taking into account the indicator period. Rays can be used as a direction for potential market movement. But we must not forget that the approach must be comprehensive, the indicator signals require additional information to enter the market.
What are Fibonacci Numbers and Lines? Fibonacci numbers are used to create technical indicators using a mathematical sequence developed by the Italian mathematician, commonly referred to as "Fibonacci," in the 13th century. The sequence of numbers, starting with zero and one, is created by adding the previous two numbers. For example, the early part of the sequence is 0, 1, 1, 2, 3, 5, 8, 13, 21, 34, 55, 89,144, 233, 377, and so on. The Fibonacci sequence is significant because of the so-calle
Trade with Gann on your side!! MASTER CIRCLE 360 CIRCLE CHART, originally created by Gann admitted that this is “The Mother of all charts”. It is one of the last studies that this great trader left for us. The numeric tab le is apparently quite simple like all the tables and is based on square numbers, the SQUARE OF 12 and is by evolution, one of the most important square numbers. Here we can find CYCLE, PRICE AND TIME thanks to angles and grades, to show past and future support and resistance.
Infinity Trend Pro
Yaroslav Varankin
1 (1)
This is a trend indicator without redrawing Developed instead of the binary options strategy (by the color of the Martingale candlestick) Also works well in forex trading When to open trades (binary options) A signal will appear in the place with a candle signaling the current candle It is recommended to open a deal for one candle of the current timeframe M1 and M5 When a blue dot appears, open a deal up When a red dot appears, open a trade down. How to open trades on Forex. When a signal is rec
PABT Pattern Indicator - it's classical system one of the signal patterns. Indicator logic - the Hi & Lo of the bar is fully within the range of the preceding bar, look to trade them as pullback in trend. In the way if indicator found PABT pattern it's drawing two lines and arrow what showing trend way.  - First line - it's entry point and drawing at: 1. On the high of signal bar or on middle of the signal bar (depending from indicator mode) for buy; 2. On the low of signal bar or on middle of t
AlphaWave4
Simon Draxler
AlphaWave – Indicatore di trend senza repaint con segnali di acquisto/vendita e avvisi per MT5 AlphaWave è un indicatore di trend per MetaTrader 5 che ti mostra la direzione del trend a colpo d'occhio e ti dà un segnale chiaro di BUY o SELL quando il trend cambia. Trasforma il prezzo in un'unica onda fluida: ciano quando il trend è rialzista, corallo quando è ribassista. Vedi subito da quale lato del mercato dovresti stare, su qualsiasi simbolo e qualsiasi timeframe. AlphaWave è pensato per lo s
We present you the indicator "Candle closing counter", which will become your indispensable assistant in the world of trading. That’s why knowing when the candle will close can help: If you like to trade using candle patterns, you will know when the candle will be closed. This indicator will allow you to check if a known pattern has formed and if there is a possibility of trading. The indicator will help you to prepare for market opening and market closure. You can set a timer to create a pre
Color Stochastic Enhanced Stochastic Oscillator with Cross Detection and Visual Signal Support Overview Color Stochastic is a customized version of the classic Stochastic Oscillator designed for momentum analysis and crossover visualization. The indicator provides color-based signal marking and configurable crossover detection at user-defined overbought and oversold levels. It can be used as part of: Momentum analysis Mean reversion workflows DCA-based strategies Multi-indicator confirmation sys
Simple to read and powerful, no fancy lines and drawings to clutter your chart or distract you. The trend probability oscillator estimates how likely a trend will continue in a certain period. The cummulator period controls how many bars in the past to use and is a proxy for the timescale the trend probability should hold. The use of a Max Line improves this further by indicating when a trend is likely to reverse. In most cases a trend must lose momentum before reversing. Hence, a trend probabil
The indicator detects and displays 3 Drives harmonic pattern (see the screenshot). The pattern is plotted by the extreme values of the ZigZag indicator (included in the resources, no need to install). After detecting the pattern, the indicator notifies of that by a pop-up window, a mobile notification and an email. The indicator highlights the process of the pattern formation and not just the complete pattern. In the former case, it is displayed in the contour triangles. After the pattern is com
Laser Trend
Nicolas Zouein
The trend is your friend! This is what this indicator is all about. Follow this famous saying and be safe. Characteristics: Buy/Sell signals fixed on the close of a bar. Works on all symbols and all timeframes. Clear visual market trend laser line, Buy/Sell signal arrows, market strength meter, TP1 & TP2 boxes. Visual signals when to enter, when to exit the market. No repainting. Compatible with Flexible EA for trading automation. (Ask for a free set file optimized to perform 2010-2018) Parame
Bermaui Bands
Muhammad Elbermawi
4.97 (68)
Bermaui Bands (BB) è uno strumento di analisi tecnica che aiuta a filtrare tra i movimenti di prezzo di range e trend. L'idea alla base di questo indicatore può essere spiegata nei passaggi successivi: Calcola la deviazione standard come un oscillatore che si muove tra 0 e 100. Lo chiamerò Bermaui Deviation percent (BD %). Se "BD%" è vicino allo zero, la volatilità è al suo estremo. Inoltre, se "BD%" è vicino a 100, la volatilità è molto bassa. Alta volatilità significa una grande probabilità pe
[ZhiBiCCI] indicators are suitable for all cycle use, and are also suitable for all market varieties. [ZhiBiCCI] Green solid line is a reversal of bullish divergence. The green dotted line is a classic bullish divergence. [ZhiBiCCI] The solid line to the red is a reverse bearish divergence. The red dotted line is a classical bearish divergence. [ZhiBiCCI] can be set in the parameters (Alert, Send mail, Send notification), set to (true) to send instant signals to the alarm window, email, insta
LordChannel
Igor Pereira Calil
LordChannel is an indicator for META TRADER 4 for all forex pairs and financial market metals. The indicator is used to make detections of high/low channels, implementing a technical analysis on possible breakouts and making correct order entries. LordChannel sends signals such as buy and sell in the graphical analysis, it is important to emphasize that the importance of these signals are safe in TIME FRAMES M30, H1, H4. The indicator was created for using bullish/downtrend channels to compl
QuantumEdge Trader
Hossam Ali Ahmed Ali
QuantumEdge Trader v1.0 AI-Powered Precision Signals for Serious Traders QuantumEdge Trader is a smart and reliable indicator that delivers accurate BUY and SELL signals using advanced market analysis and trend detection. Designed for M1 to M60 timeframes, it's ideal for scalping and intraday strategies. --- Key Features: No Repaint – Signals never change after appearing Smart trend filters to reduce noise Adjustable sensitivity and alerts Perfect for XAUUSD, EURUSD, and m
Super Reversal Pattern
Parfait Mujinga Ndalika
Super Reversal Pattern Indicator Unlock the power of advanced pattern recognition with our Super Reversal Pattern Indicator. Designed for traders seeking precision and reliability, this indicator identifies one of the most effective reversal patterns in technical analysis, offering a significant edge in your trading strategy. Key Features: Non-Repainting Accuracy: Enjoy the confidence of non-repainting technology. Once a Super Reversal Pattern is detected, it remains static, providing consiste
Gli utenti di questo prodotto hanno anche acquistato
Currency Strength Wizard è un indicatore molto potente che ti fornisce una soluzione all-in-one per un trading di successo. L'indicatore calcola la potenza di questa o quella coppia forex utilizzando i dati di tutte le valute su più intervalli di tempo. Questi dati sono rappresentati in una forma di indice di valuta facile da usare e linee elettriche di valuta che puoi utilizzare per vedere il potere di questa o quella valuta. Tutto ciò di cui hai bisogno è collegare l'indicatore al grafico che
Trend SniperX MT4
Sarvarbek Abduvoxobov
5 (6)
Trend Sniper X è un indicatore di trend-following multi-timeframe per MetaTrader 5 che aiuta i trader a identificare la direzione del trend e i potenziali punti di inversione con chiarezza e precisione. Per MT5: https://www.mql5.com/en/market/product/181101 Informazioni sul prezzo: Il prezzo attuale è promozionale ed è soggetto a modifiche con il rilascio dei prossimi aggiornamenti e nuove funzionalità. Canale Code2Profit Domina il mercato con l'analisi multi-timeframe! Come massimizzare il tuo
M1 Sniper
Oleg Rodin
4.97 (30)
M1 SNIPER è un sistema di indicatori di trading facile da usare. Si tratta di un indicatore a freccia progettato per l'intervallo temporale M1. L'indicatore può essere utilizzato come sistema autonomo per lo scalping sull'intervallo temporale M1 e come parte del tuo sistema di trading esistente. Sebbene questo sistema di trading sia stato progettato specificamente per il trading sull'intervallo temporale M1, può comunque essere utilizzato anche con altri intervalli temporali. Inizialmente ho pro
Smart Trend Trading System è un indicatore per MetaTrader 4 che riunisce informazioni sul trend, segnali di entrata e uscita e livelli di prezzo in un unico grafico. Combina più di 10 strumenti di trading in un unico sistema, inclusi rilevamento del trend, zone di inversione, Smart Cloud, logica di trailing stop, supporto e resistenza, colorazione delle candele, avvisi e analisi multi-timeframe. Il sistema è progettato per aiutarti a operare in diverse condizioni di mercato: Mercati in trend: I
SIO Oscillator: oscillatore auto-ottimizzante dello squilibrio di semivarianza Acquista l’indicatore e ricevi GRATIS l’Expert Advisor (EA) basato su di esso. La maggior parte degli oscillatori tratta ogni movimento di prezzo allo stesso modo. SIO separa la pressione rialzista da quella ribassista e misura lo squilibrio tra le due, mostrando quale parte controlla davvero il mercato: compratori o venditori. Quando lo squilibrio raggiunge un estremo, SIO genera un segnale chiaro con livelli di ingr
Liquidity Scalper System: un sistema di trading basato sulla liquidità in formato indicatore. La maggior parte degli indicatori mostra solo una freccia, poi è il trader a decidere dove mettere lo stop, dove si trova il target e se fidarsi del segnale. Liquidity Scalper System copre l'intero ciclo del trade: trova i pool di liquidità, dà un segnale alla loro rottura, calcola subito Entry, Stop Loss e tre target, e mostra sul pannello le statistiche e i risultati della verifica su dati nuovi. Il
Gann Made Easy
Oleg Rodin
4.84 (174)
Gann Made Easy è un sistema di trading Forex professionale e facile da usare che si basa sui migliori principi del trading utilizzando la teoria di mr. WD Gann. L'indicatore fornisce segnali ACQUISTA e VENDI accurati, inclusi i livelli di Stop Loss e Take Profit. Puoi fare trading anche in movimento utilizzando le notifiche PUSH. CONTATTAMI DOPO L'ACQUISTO PER RICEVERE GRATUITAMENTE LE ISTRUZIONI DI TRADING E OTTIMI INDICATORI EXTRA! Probabilmente hai già sentito parlare molte volte dei metodi d
Advanced Supply Demand
Bernhard Schweigert
4.91 (302)
Speciale Trading- SCONTO DEL 30% La soluzione migliore per qualsiasi trader principiante o esperto! Questo indicatore è uno strumento di trading unico, di alta qualità e conveniente, perché abbiamo incorporato una serie di funzionalità proprietarie e una nuova formula. Con questo aggiornamento, potrai visualizzare doppie zone di timeframe. Non solo potrai visualizzare un TF più alto, ma anche entrambi, il TF del grafico e il TF più alto: MOSTRA ZONE ANNIDATE. Tutti i trader che operano con Of
Questo indicatore è un indicatore per l'analisi automatica delle onde perfetto per il trading pratico! Caso... Nota:   non sono abituato a usare nomi occidentali per la classificazione delle onde a causa dell'influenza della convenzione di denominazione di Tang Lun (Tang Zhong Shuo Zen), ho chiamato l'onda base come   penna   e la banda dell'onda secondaria come   segmento   At allo stesso tempo, il segmento ha la direzione del trend. La denominazione   è principalmente segmento di trend   (que
Attualmente 30% di sconto! La soluzione migliore per ogni principiante o trader esperto! Questo software per cruscotti funziona su 28 coppie di valute. Si basa su 2 dei nostri indicatori principali (Advanced Currency Strength 28 e Advanced Currency Impulse). Offre un'ottima panoramica dell'intero mercato Forex. Mostra i valori di forza delle valute avanzate, la velocità di movimento delle valute e i segnali per 28 coppie Forex in tutti i (9) timeframe. Immaginate come migliorerà il vostro tra
Non repaint MT4
Yan Zhen Du
5 (2)
This is a professional chart indicator designed for traders focused on stability and clear price action. It helps filter market noise and provides clear visual entry and exit zones for your trading decisions. Price Information: The current price is promotional and is subject to change as upcoming updates and new features are released. MQL5 public channel:  CLICK HERE for MT5:  Non-repainting MT5 version Core Features: Strictly Non-Repainting: The system is built with strict non-repaint logic. W
Scalper Vault
Oleg Rodin
4.9 (41)
Scalper Vault è un sistema di trading potente e completo, progettato per i trader che desiderano ottenere risultati costanti nel trading intraday. Questo indicatore ad alta precisione funge da sistema di trading autonomo, offrendo analisi di livello istituzionale sia per il mercato Forex che per le Opzioni Binarie. CONTATTAMI DOPO L'ACQUISTO PER RICEVERE I MIEI CONSIGLI DI TRADING E UN FANTASTICO BONUS! Eliminando le congetture e le complesse analisi manuali, Scalper Vault ti permette di concen
Vi presentiamo ON Trade Waves Patterns Harmonic Elliot Wolfe, un indicatore avanzato progettato per rilevare vari tipi di pattern sul mercato utilizzando metodi sia manuali che automatici. Ecco come funziona: Pattern Armonici: Questo indicatore è in grado di individuare pattern armonici che appaiono sul vostro grafico. Questi pattern sono fondamentali per i trader che praticano la teoria del trading armonico, come descritta nel libro di Scott Carney "Harmonic Trading vol 1 & 2". Che li disegniat
RFI levels PRO
Roman Podpora
5 (2)
L'indicatore mostra accuratamente i punti di inversione e le zone di ritorno dei prezzi in cui il       Principali attori   . Vedi dove si formano le nuove tendenze e prendi decisioni con la massima precisione, mantenendo il controllo su ogni operazione. VERSION MT5     -     Rivela il suo massimo potenziale se combinato con l'indicatore   TREND LINES PRO Cosa mostra l'indicatore: Strutture di inversione e livelli di inversione con attivazione all'inizio di un nuovo trend. Visualizzazione dei l
Zoryk Gold mt4
Reda El Koutbane
5 (4)
ZORYK — Sistema avanzato di segnali e pianificazione per XAUUSD su MetaTrader 4 Conosci sicuramente questa situazione. Analizzi l’oro, aspetti l’ingresso e finalmente apri la posizione. Il prezzo si muove immediatamente contro di te. Chiudi troppo presto, sposti lo Stop Loss oppure esiti per alcuni secondi. Poco dopo, il mercato raggiunge esattamente la direzione e l’obiettivo che avevi previsto, ma senza di te. Il problema non era sempre la direzione. Il vero problema era l’incertezza. No
ShapeRadar - indicatore dei pattern grafici classici ShapeRadar individua automaticamente sul grafico i pattern classici dell’analisi tecnica: doppi e tripli massimi e minimi, Testa e Spalle e la sua versione inversa, cunei ascendenti e discendenti, rettangoli, triangoli, bandiere e pennant. Quando il prezzo chiude oltre il limite di una figura, l’indicatore disegna il pattern, il punto di ingresso, il livello di stop loss e l’obiettivo, mentre un pannello informativo riassume tutti i pattern ri
PRO Renko System
Oleg Rodin
5 (31)
PRO Renko System è un sistema di trading altamente accurato appositamente progettato per il trading di grafici RENKO. Questo è un sistema universale che può essere applicato a vari strumenti di trading. Il sistema neutralizza efficacemente il cosiddetto rumore di mercato che consente di accedere a segnali di inversione accurati. L'indicatore è molto facile da usare e ha un solo parametro responsabile della generazione del segnale. Puoi facilmente adattare lo strumento a qualsiasi strumento di
SR Liquidity
Oleg Rodin
5 (3)
SR Liquidity è un indicatore di trading progettato per individuare le zone nascoste in cui si concentra la liquidità di mercato e dove il prezzo reagisce con maggiore intensità. Queste aree di liquidità agiscono come potenti livelli di supporto e resistenza, offrendo una mappa chiara dei punti in cui è più probabile che il mercato inverta la propria direzione. Invece di tracciare le classiche linee di supporto e resistenza, SR Liquidity analizza l'effettivo comportamento dei prezzi per individua
Auto Optimized SpeedAngle è un sistema di vettorizzazione del momento di livello istituzionale che elimina l'overfitting ( curve-fitting ) attraverso l'ottimizzazione continua Walk-Forward (WFO). Invece di affidarsi a input statici che si degradano quando i regimi di mercato cambiano, l'indicatore recalibra dinamicamente i suoi parametri utilizzando la validazione Out-of-Sample (OOS), assicurando che i segnali visualizzati rappresentino reali vantaggi statistici anziché anomalie storiche. Quadro
Professional Volume Profile An indicator for MetaTrader 4 that builds a horizontal Volume Profile directly on the price chart. It shows the levels where traders executed the most trades, helping to identify support/resistance zones and assess the balance of power in the market. What the Indicator Displays POC (Point of Control) — the level with the maximum trading volume (red line). VAH / VAL (Value Area High / Low) — the upper and lower boundaries of the value area, where 70% of the volume was
Italo Volume Indicator
Italo Santana Gomes
4.92 (79)
BUY INDICATOR AND GET EA FOR FREE AS A BONUS + SOME OTHER GIFTS! ITALO VOLUME INDICATOR  is the best volume indicator ever created, and why is that? The Indicator works on all time-frames and assets, indicator built after 7 years of experience on forex and many other markets. You know many volume indicators around the internet are not complete, does not help, and it's difficult to trade, but the Italo Volume Indicator is different , the Italo Volume Indicator shows the wave volume, when market
Stima il movimento di prezzo più probabile nel breve termine sulla base di calcoli matematici avanzati. Caratteristiche Stima del movimento immediato del prezzo sul timeframe del grafico e su tutti quelli superiori; Calcolo del trend reale del mercato; Calcolo dei livelli di supporto e resistenza più importanti; Avvisi per zone di congestione, attraversamenti di livelli e cambi di trend; Leggero sulle risorse di sistema: linee e pannello vengono aggiornati solo quando un valore cambia; Autorego
Atomic Analyst
Issam Kassas
5 (14)
Atomic Analyst — MetaTrader 4 Per domande sul prodotto, indicazioni sulla configurazione o supporto tecnico, scrivimi direttamente qui su MQL5. L’indicatore trasforma calcoli complessi del mercato in semplici segnali visivi, candele colorate, letture del trend, livelli di stop-loss e diverse zone di take-profit che i trader possono capire rapidamente e usare in condizioni reali di mercato. Principali utilizzi di trading: Scalping e trading intraday: Progettato per decisioni rapide, frecce chiar
Scalping Entry Points - è un sistema di trading manuale che può adattarsi ai movimenti dei prezzi e dare segnali per aprire le negoziazioni senza ridisegnare. L'indicatore determina la direzione del trend dal livello centrale di supporto e resistenza. L'indicatore a punto fornisce segnali per entrate e uscite. Adatto per trading intraday manuale, scalping e opzioni binarie. Funziona su tutti i tempi e strumenti di trading. L'indicatore fornisce diversi tipi di avvisi. Come utilizzare il prodott
All in One package includes the  Oscillator Predictor ,  MACD Predictor ,  Thrust Scanner  and  Advanced Fibonacci  indicators which are mandatory for applying  Dinapoli  trade plans.  Please visit below links for detailed explanations of indicators. Advanced Fibonacci Indicator =>  https://www.mql5.com/en/market/product/52834 Thrust Scanner Indicator => https://www.mql5.com/en/market/product/52830 Overbought /Oversold Predictor indicator => https://www.mql5.com/en/market/product/52621 Macd P
True Direction Oscillator
Muhammad Elbermawi
4.85 (364)
Oppure (TDO) che è un indice che misura il tasso di variazione del prezzo utilizzando il principio del " Pure Momentum ". Quando il prezzo di un titolo avanza da 10 a 15, il tasso di variazione del prezzo è del 150%, ma quando scende da 15 a 10, il tasso di variazione del prezzo è solo del 33,3%. Ecco perché gli indicatori di analisi tecnica come "Price Rate of Change" (ROC) o "Momentum" forniscono letture più elevate per i movimenti di prezzo ascendente rispetto a quelli dati a quelli discenden
Quantum Imbalance Profiles   è un indicatore delle fasi di equilibrio e squilibrio. Mostra a quali prezzi il mercato ha scambiato volume, quale parte ha dominato all'interno di quella zona e attraverso quali livelli il prezzo si è poi espanso con un impulso. Un profilo di volume classico risponde a una sola domanda: dove sono avvenuti gli scambi. Non mostra quale parte ha dominato a ogni prezzo, come si è conclusa la fase laterale né in quale direzione il mercato ne è uscito. Quantum Imbalance P
Indicatore per il trading manuale e l'analisi tecnica per il Forex. È costituito da un indicatore di tendenza con il livello di apertura del giorno di negoziazione e da un indicatore a freccia per determinare i punti di ingresso. L'indicatore non si ricolora; funziona quando la candela si chiude. Contiene diversi tipi di avvisi per le frecce di segnalazione. Può essere configurato per funzionare su qualsiasi grafico, strumento di trading o intervallo di tempo. La strategia di lavoro si basa su
Currency Strength Matrix
Raymond Gilmour
4.5 (26)
THE ONLY CURRENCY STRENGTH INDICATOR BUILT ON PRICE ACTION Most currency strength meters average an oscillator, or measure how far price has travelled. But these are not accurate measures of trend, Currency Strength Matrix measures trend strength, not just if a currency price has gone up or down. Currency Strength Matrix reads market structure . For each of the 28 major pairs it finds the confirmed cycle highs and lows, and decides whether that pair is in an uptrend, a downtrend, or neither. A
Dark Support Resistance  is an Indicator for intraday trading. This Indicator is programmed to identify  Support and Resistance Lines , providing a high level of accuracy and reliability. Key benefits Easily visible lines Only the most important levels will be displayed Automated adjustment for each timeframe and instrument Easy to use even for beginners Never repaints, never backpaints, Not Lag 100% compatible with Expert Advisor development All types of alerts available: Pop-up, Email, Push

Altri dall’autore
Flat Session Statistics is a statistics panel for MetaTrader 4. It does not generate buy or sell signals. It aggregates the past bars of the symbol it is attached to and shows how often a defined event was followed by a defined outcome — as a conditional frequency with its sample size (N) and a Wilson 95% confidence interval on every line. Statistics (14 items, closed sessions only): - Baseline green rate (sessions closing above their open) - Gap fill rate (all / up / down) and gap-and-go hold r
Flat SMC Structure Map is a Smart Money Concepts structure indicator for MetaTrader 4. It draws the market structure on one chart: BOS / CHoCH, order blocks, FVGs, liquidity lines (EQH / EQL) and sweeps, and premium / discount positioning — all judged on closed bars only, so confirmed drawings never repaint. Structure: two layers — major swings (default left/right 5) for the main flow and internal swings (default 2) for the short-term flow, each labelled HH / HL / LH / LL. A close break in the t
Horizon Quad-Compass MT4 — 4 indicators x 3 timeframes x up to 12 symbols on one dashboard Horizon Quad-Compass is a multi-timeframe, multi-symbol monitoring indicator for MetaTrader 4. It reads four widely used indicators — MA, Stochastic, MACD and ADX — on three timeframes for up to 12 symbols at once, and shows each symbol's direction as dots on a single dashboard, so you can see which symbols are aligned and which timeframe is breaking down without switching between charts. Direction at a gl
Overview FlatStochasticCycle is a signal indicator for MetaTrader 4 that reads three Stochastics with different periods as overlapping "cycles". A cross of the short Stochastic is the trigger, and the mid and long Stochastics (position against level 50) filter the situation. OsMA checks momentum and ADX checks trend strength; each filter can be switched ON/OFF individually. All judgements are made on closed bars, so signals do not repaint. This indicator does not place orders by itself. Main fea
Overview Flat10-Trend Bias Panel is a multi-symbol bias monitor for MetaTrader 5. It watches 9 symbols (EURUSD, GBPUSD, USDJPY, AUDUSD, NZDUSD, USDCAD, USDCHF, EURJPY and GOLD) and judges the trend bias of each symbol from four technical votes: moving average alignment, ADX, MACD and RSI. When all four votes agree, the symbol is treated as having a strong bias. The panel also draws entry-timing arrows for the chart symbol. This indicator does not place orders by itself. Main features Each watche
Overview FlatAutoFibonacci is an automatic Fibonacci indicator for MetaTrader 5. It detects swing highs and lows and draws Fibonacci retracement levels automatically, and in addition it watches for reversal bars near the levels and draws counter-trend entry signals. A second Fibonacci projection provides take-profit and stop-loss reference lines, and a statistics panel shows a win-rate simulation of the signals. This indicator does not place orders by itself. Main features Fibonacci retracement
Overview FlatFibonacciWave is a two-stage Fibonacci indicator for MetaTrader 5. It detects the latest swing and draws two-stage Fibonacci levels automatically, with a price table and a movable dashboard. In addition to the level display, it provides linkage event buffers and alerts when price reaches a level. This indicator does not place orders by itself. Main features Two-stage Fibonacci levels are drawn automatically from the detected swing Linkage event buffers for external tools (buffer 2 =
Overview FlatFibonacciCluster is a multi-timeframe Fibonacci overlap map for MetaTrader 5. It draws Fibonacci retracement levels from six timeframes (M15, M30, H1, H4, D1 and W1) on one chart, and highlights the price bands where levels from different timeframes overlap within a tolerance. The more levels overlap in a band, the more timeframes share a level near that price. This indicator does not place orders by itself. Main features Levels are drawn as bands, and each band's end label shows it
Overview FlatStochasticCycle is a signal indicator for MetaTrader 5 that reads three Stochastics with different periods as overlapping "cycles". A cross of the short Stochastic is the trigger, and the mid and long Stochastics (position against level 50) filter the situation. OsMA checks momentum and ADX checks trend strength; each filter can be switched ON/OFF individually. All judgements are made on closed bars, so signals do not repaint. This indicator does not place orders by itself. Main fea
Horizon Trend Matrix is a matrix-style dashboard indicator for MetaTrader 5. It judges the trend of one symbol across three timeframes (H1, M15, M5) using a single selectable moving average method, and shows the result as a compact matrix together with signal arrows on the chart. Main features 12 moving average types to choose from, including SMA, EMA, RMA and ALMA Each dashboard cell shows the deviation rate (%) of the price from the moving average, color-coded by direction Signal arrows appear
Overview Horizon MACD Radar is a radar-style dashboard indicator for MetaTrader 5. It monitors MACD-based signals across multiple symbols and timeframes at a glance, and shows signal arrows on the chart so you can spot where momentum is turning without opening many charts. Main features Signal mode can be switched from the parameters: MACD cross mode or OsMA mode The selected mode is saved per chart and shown on the dashboard All signals are evaluated on closed bars only, so displayed signals do
Overview Horizon Quad-Compass is a compass-style dashboard indicator for MetaTrader 5. For each symbol, it lays out four oscillators (moving average, stochastic, MACD and ADX) against three timeframes (H1, M15 and M5) as a grid of dots in a subwindow, so trend and momentum conditions can be compared at a glance. Main features Dashboard in a subwindow: rows are the four oscillators (MA, Stochastic, MACD, ADX) and columns are the timeframes (H1, M15, M5) Clicking a timeframe header button opens th
Overview Horizon Pulse is a multi-symbol matrix dashboard indicator for MetaTrader 5. It watches up to 40 symbols across 4 timeframes in a single matrix, and also ranks the strength of the 8 major currencies numerically, so you can grasp the whole market's direction from one panel. Main features Matrix view of up to 40 symbols x 4 timeframes Currency strength ranking for the 8 major currencies, shown as numeric values Signal Mode can be selected from the parameters: MA Order or MACD Cross All ev
Overview Horizon Prime Consensus is a consensus-style dashboard indicator for MetaTrader 5. It combines the judgments of multiple technical indicators into one consensus view for each symbol across three timeframes (M5, M15 and H1), and draws signal arrows on the main price chart when the consensus points to an entry direction. Main features Consensus view across three timeframes: M5, M15 and H1 Signal arrows are drawn on the main price chart, not only inside the panel Signal mode can be selecte
Overview Horizon Expanded Signal is an entry signal indicator for MetaTrader 5. It checks whether five technical indicators (SMA, ADX, CCI, Parabolic SAR and Momentum) are aligned in the same direction, and only when the completed higher-timeframe trend agrees, it draws an entry signal together with suggested stop-loss and take-profit levels on the chart. It is designed and verified primarily for GOLD on the 15-minute timeframe. This indicator does not place orders by itself. Main features Align
Overview Horizon Combo Signal is an entry signal indicator for MetaTrader 5. It watches whether multiple technical conditions are aligned in the same direction, and when a new alignment is completed it draws an entry signal on the chart together with stop-loss and take-profit reference lines. The recommended setting is GOLD on the 1-hour timeframe. This indicator does not place orders by itself. Main features Entry arrows appear only when the alignment is newly completed, evaluated on closed bar
Four indicators. One agreement. One signal. Horizon Trend Combo Signal is a trend signal indicator built exclusively for GOLD (XAUUSD) on the H3 (180-minute) chart. It fires an entry signal only when all four of its components point in the same direction: Supertrend (factor 3.0, ATR 10) - trend direction Ichimoku Kinko Hyo (9, 26, 52) - price vs. cloud plus Tenkan/Kijun OsMA - MACD (12, 26, 9) histogram sign Aroon (14) - strength of the most recent high/low When the last component joins the othe
Horizon Agent Brief MT5 is a standalone indicator that briefs AI agents about the chart - and shows the same briefing to you on a movable panel. On every closed bar it writes a structured JSON packet to files (MQL5\Files\Horizon_Agent_Brief by default): the candle anatomy (body, wicks, close position, pattern), the last 5 candles, regime, momentum, volume, swing structure, previous-day levels and VWAP, the score breakdown and the tracked trade state. AI agents and external tools can read the pac
Flat Session Statistics is a statistics panel for MetaTrader 5. It does not generate buy or sell signals. It aggregates the past bars of the symbol it is attached to and shows how often a defined event was followed by a defined outcome — as a conditional frequency with its sample size (N) and a Wilson 95% confidence interval on every line. Statistics (14 items, closed sessions only): Baseline green rate (sessions closing above their open) Gap fill rate (all / up / down) and gap-and-go hold rate
Version 1.102 update: Added a fractal model (C2 / CISD / protected swings), Reclaim Strength (RS) with RS-band survival statistics in the panel, ICT killzones (5 sessions) with previous day/week/month pivots, and ADR/CDR. Each module can be switched on or off individually. The confluence signal (buffer 0 = Buy, 1 = Sell) and its readability from external tools such as Flat Manual Trader are unchanged. Flat SMC Structure Map is a Smart Money Concepts structure indicator for MetaTrader 5. It draws
Flat Volume Profile draws a volume profile on your MT5 chart from tick volume. For each period it builds a price-by-price volume histogram and shows: POC (Point of Control): the price with the highest volume Value Area (VAH / VAL): the range containing 70% of the period volume (adjustable) VWAP for the period, with optional +/-1SD and +/-2SD bands (latest profile) Period modes: Daily, Weekly, Rolling (last N bars) and Anchored (from any start time). Past profiles can be shown as well (default: 5
The signal, the sizing and the exit — in one EA. Horizon Trend Combo EA is a standalone expert advisor for MetaTrader 5, built exclusively for GOLD (XAUUSD) on the H3 (180-minute) chart. The Horizon Trend Combo signal is built into the EA itself: no separate indicator and no other product is required. How it trades The EA watches for the moment when four trend components agree in the same direction: - Supertrend (factor 3.0, ATR 10) — trend direction - Ichimoku Kinko Hyo (9, 26, 52) — price vs.
A standalone MT5 expert advisor for GOLD (XAUUSD) on M5. A regression-slope trend signal filtered by the higher-timeframe trend, long-only, with a 24-hour maximum hold and risk-% lot sizing. Verified on 100% real ticks over 2024-2026. One trend signal, one higher-timeframe check — nothing else. Horizon Gold Trend EA is a standalone expert advisor for MetaTrader 5, built exclusively for GOLD (XAUUSD) on the M5 chart. The signal, the filter, the exits and the lot sizing are all built into the EA i
Flat Reversion Radar is a mean-reversion screener for MetaTrader 5. For up to 12 watch symbols it measures how far each price has stretched away from its own mean, using a least-squares regression centre, residual standard-deviation bands and a z-score, and lists the symbols in a panel sorted by the size of the deviation. For the chart symbol it draws the regression channel: the centre line, the +/-1 sigma bands and the +/-2 sigma bands. The z-score puts every symbol on the same scale, so a curr
Flat Flag Patterns automatically detects and draws flag and pennant continuation patterns on your MT5 chart. It looks for a strong one-way move (the pole) followed by a small consolidation (the flag), and draws the pole line, the flag zone, a label and arrows directly on the chart. Detection is normalised by volatility (ATR), so the same yardstick applies across symbols and timeframes. For the pole it also checks that the move was clean and one-directional — choppy two-way action does not count
Overview Horizon Combo EA is a fully automated Expert Advisor for MetaTrader 5. It watches whether multiple technical conditions are aligned in the same direction, and when a new alignment is completed it opens a position with a stop loss derived from the ATR at that moment and a take profit placed by a risk-reward ratio (default 3.0). The recommended setting is GOLD on the 1-hour timeframe, using the built-in "GOLD 1H Recommended" preset. Position size is calculated from the risk percentage of
Horizon Confluence EA is a fully automated trend-following Expert Advisor for MetaTrader 5. It watches swing direction across several timeframes at once and enters only when the directions come together (confluence). It does not use grid, martingale or averaging-down techniques: every position is opened with a stop loss, and the exit is handled by an ATR-based trailing stop, with an optional partial close. The default settings are tuned for XAUUSD (GOLD) on the M15 chart. The EA trades the symbo
Horizon SMC Suite MT5 — the all-in-one SMC / ICT dashboard One indicator that draws the full Smart Money Concepts map on a single chart: market structure, order blocks, fair value gaps, liquidity, a full volume profile, sessions and killzones — and grades every zone by how many profile elements overlap it. Modules - Market structure: major / internal BOS and CHoCH, HH / HL / LH / LL swing labels, premium / discount bands with equilibrium - Order blocks and fair value gaps (with CE line), includi
What it is Horizon Currency Strength MT5 is a currency strength meter for MetaTrader 5. It computes the relative strength of the 8 major currencies (USD, EUR, GBP, JPY, AUD, NZD, CAD, CHF) from all 28 related pairs and shows them as a 0-100 ranking on a panel in the chart window. It is a display-only indicator: it does not place trades. How the score is calculated For each of the 28 pairs, the indicator measures the price change over a lookback period, normalized by ATR so that pairs with differ
Filtro:
Nessuna recensione
Rispondi alla recensione