Pro MACD Signal Line Zero Level Multi Filter Cross

Pro MACD Signal Line Zero Level Multi Filter Cross

Overview

MACD Zero Cross Histogram Multi Filter is a technical analysis indicator for MetaTrader 4 designed to identify momentum shifts, signal-line crossovers, and zero-level transitions using a four-color dynamic MACD histogram paired with a modular 15-filter validation framework. Built for discretionary and rule-based traders across Forex, commodities, indices, and CFDs, this indicator separates raw momentum signals from filtered setups by evaluating every candidate crossover against user-selected trend, volatility, oscillator, and market-structure conditions. When a valid setup occurs on a closed candle, the indicator plots directional signal arrows on the main chart, projects dynamic ATR-based Entry, Stop Loss, and three Risk-to-Reward Take Profit levels (1R, 2R, and 3R) for the most recent active signal, and dispatches alerts across terminal pop-ups, audio files, mobile push notifications, and email.
Operating Principle and Signal Logic
The indicator operates through a sequential four-stage analytical pipeline executed on completed price bars:
- Core MACD Momentum Calculation: Computes the standard MACD main line (difference between Fast EMA and Slow EMA), the Signal line (SMA of the MACD main line), and the MACD histogram (difference between the MACD main line and Signal line) using the user-defined price source.
- Three Selectable Trigger Modes: Users can choose between three distinct crossover mechanisms via the EntryMethod parameter:
  * Mode 0 (ENTRY_MACD_CROSS_SIGNAL): Generates a Buy trigger when the MACD main line crosses above the Signal line on a closed bar, and a Sell trigger when the MACD main line crosses below the Signal line.
  * Mode 1 (ENTRY_MACD_CROSS_ZERO): Generates a Buy trigger when the MACD main line crosses from negative territory above the zero baseline, and a Sell trigger when the MACD main line crosses from positive territory below the zero baseline.
  * Mode 2 (ENTRY_MACD_CROSS_SIGNAL_ZERO): Combines both conditions by requiring a bullish MACD-above-Signal crossover to occur strictly while the MACD main line is at or above the zero level for Buy setups, and a bearish MACD-below-Signal crossover to occur strictly while the MACD main line is at or below the zero level for Sell setups.
- Modular 15-Filter Validation Gate: Every raw MACD trigger is passed through an optional multi-filter suite where only enabled filters are evaluated. A signal is confirmed only when all active filters agree with the trade direction:
  * Filter 1 (RSI Cross Filter): Confirms momentum recovery from oversold territory for Buy triggers and exhaustion from overbought territory for Sell triggers.
  * Filter 2 (ADX Filter): Verifies that underlying trend strength meets or exceeds the minimum ADX threshold before allowing a signal.
  * Filter 3 (Single MA Filter): Enforces directional price alignment above a baseline Moving Average for Buy signals and below it for Sell signals.
  * Filter 4 (Ichimoku Senkou Span B Filter): Uses the long-term Ichimoku cloud boundary as a macro trend bias filter, requiring closing price alignment above or below Senkou Span B.
  * Filter 5 (RSI 75 Filter): Applies a long-period RSI regime filter around the neutral midpoint to separate bullish and bearish macro momentum phases.
  * Filter 6 (Double MA Filter): Evaluates the directional relationship between a faster Moving Average and a slower Moving Average to confirm broader trend structure.
  * Filter 7 (Awesome Oscillator Filter): Supports configurable momentum magnitude thresholds, bar-to-bar color slope direction, and zero-line polarity alignment.
  * Filter 8 (Parabolic SAR Filter): Requires price to trade above the Parabolic SAR dots for Buy setups and below the dots for Sell setups.
  * Filter 9 (Heiken Ashi Filter): Smooths price noise through synthetic Heiken Ashi candles, permitting Buy signals only on bullish smoothed bodies and Sell signals only on bearish smoothed bodies.
  * Filter 10 (CCI Trend Filter): Uses a medium-term Commodity Channel Index relative to its zero baseline to confirm directional bias.
  * Filter 11 (CCI OB and OS Filter): Validates directional momentum breakouts beyond configured upper and lower CCI threshold levels.
  * Filter 12 (RVI Filters): Incorporates both a long-period Relative Vigor Index baseline check and a shorter-period RVI main-versus-signal line alignment check.
  * Filter 13 (MACD Filters): Provides an independent secondary MACD histogram polarity and zero-level confirmation layer with separate period settings.
  * Filter 14 (SR and Fibonacci Filters): Evaluates price proximity to dynamic swing Support/Resistance zones and swing-derived Fibonacci retracement bands before confirming entries.
  * Filter 15 (Supertrend Filter): Computes an ATR-based trend band direction and filters out signals that oppose the active Supertrend regime.
- Signal Validity and Non-Repainting Behavior: All crossover triggers and confirmation filters are evaluated exclusively on closed historical bars (bar index 1 and higher). Signals are never generated on the unclosed forming bar (bar index 0). Once a candle closes and a Buy or Sell arrow is plotted on the chart, that signal remains permanently fixed and does not repaint, recalculate, or disappear on subsequent ticks. Real-time alerts are dispatched once per newly closed candle (bar index 1).
- ATR-Based Target Level Projection: Upon confirming the most recent valid signal, the indicator measures market volatility using the Average True Range (ATR) on that signal bar and plots five horizontal reference lines extending to the right of the current candle: Entry price, Stop Loss (Entry +/- ATR multiplied by ATR_Multiplier), TP1 at 1:1 Risk-to-Reward (1R), TP2 at 2:1 Risk-to-Reward (2R), and TP3 at 3:1 Risk-to-Reward (3R). Only the latest active signal displays target lines to keep the chart clean and readable.
Key Technical Features
- Dynamic Four-Color Histogram: Distinguishes expanding and contracting bullish and bearish momentum phases directly inside the separate indicator sub-window.
- Three Built-In Entry Modes: Switch seamlessly between Signal Line Crossover, Zero Level Crossover, and Zero-Filtered Signal Crossover without changing indicators.
- 15 Independent Confirmation Filters: Every filter can be toggled on or off individually, allowing traders to run a pure MACD setup or combine multiple trend, momentum, and structure filters.
- Automated ATR Risk-to-Reward Levels: Calculates and draws Entry, SL, TP1 (1R), TP2 (2R), and TP3 (3R) lines with customizable colors, line styles, widths, right-edge extension, and price labels.
- Customizable Chart Arrows: Plots clean Wingdings directional arrows at an adjustable point offset from candle highs and lows.
- Multi-Channel Alert System: Supports MetaTrader pop-up alerts, custom WAV sound alerts, mobile push notifications, and email alerts containing symbol, direction, Entry, SL, TP1, TP2, and TP3 values.
- Automatic Object Cleanup: Removes all indicator-generated arrows, target lines, and price labels cleanly when the indicator is detached or timeframe settings are changed.
Graphical User Interface and Visual Legend
The indicator renders visual elements across both its dedicated sub-window and the primary price chart:
- Sub-Window Histogram Buffer 0 (Default: LimeGreen): Bullish momentum above zero where current histogram value is greater than the previous bar (expanding bullish momentum).
- Sub-Window Histogram Buffer 1 (Default: DarkGreen): Bullish momentum above zero where current histogram value is less than or equal to the previous bar (contracting bullish momentum).
- Sub-Window Histogram Buffer 2 (Default: Red): Bearish momentum below zero where current histogram value is lower than the previous bar (expanding bearish momentum).
- Sub-Window Histogram Buffer 3 (Default: Maroon): Bearish momentum below zero where current histogram value is higher than or equal to the previous bar (contracting bearish momentum).
- Sub-Window Buffer 4 (Default: DodgerBlue): MACD main line.
- Sub-Window Buffer 5 (Default: Magenta): MACD Signal line.
- Main Chart Buy Arrow (Default: Aqua): Upward Wingdings arrow (code 233) placed below the signal candle low.
- Main Chart Sell Arrow (Default: Red): Downward Wingdings arrow (code 234) placed above the signal candle high.
- Main Chart Target Lines: Solid Gold line for Entry level, dashed Red line for Stop Loss (SL), dashed LimeGreen line for TP1 (1R), dashed MediumSeaGreen line for TP2 (2R), and dashed DodgerBlue line for TP3 (3R), each accompanied by a right-aligned price label.
Operation Recommendations and Terminal Performance
- Recommended Instruments: Suitable for major and minor Forex currency pairs (such as EURUSD, GBPUSD, USDJPY, AUDUSD, USDCAD, EURJPY), precious metals (XAUUSD), and liquid index CFDs. When trading instruments with wider spreads or variable tick sizes, adjust ArrowDistance and SR_Zone_Points accordingly.
- Supported Timeframes: Operates across all standard MetaTrader 4 timeframes. For intraday scalping, M5 and M15 are recommended; for day trading, M30 and H1 provide balanced signal frequency; for swing trading, H4 and D1 offer broader structural signals.
- Account and Execution Environment: Compatible with all standard MT4 account types (Hedging and Netting). An ECN or raw-spread broker environment is recommended when applying the indicator on lower timeframes (M5 to M15) so that ATR-based TP1 and SL distances remain proportional to transaction costs.
- CPU and Memory Efficiency: During initial loading, the indicator processes historical bars in a single chronological pass and subsequently updates only newly formed bars on each tick. Only enabled filters execute calculations during live operation. To maintain optimal terminal responsiveness on workstations with limited hardware resources, avoid attaching multiple instances with all 15 filters enabled simultaneously across dozens of open charts.
- Alert Configuration Notes: Ensure that terminal audio is enabled in MetaTrader 4 (Tools -> Options -> Events) for sound alerts, a valid MetaQuotes ID is configured under the Notifications tab for mobile push alerts, and valid SMTP server credentials are configured under the Email tab for email dispatches.
Input Parameters
Below is the complete list of all input parameters available in the MetaTrader 4 Inputs tab, organized by functional group:
Section 1: Entry Logic and Core Parameters
- InpSection1 (Default: "=== [LOGIC] Entry Method Selection ===") - Visual separator header for the entry mode group in the Inputs tab.
- EntryMethod (Default: ENTRY_MACD_CROSS_SIGNAL) - Selects the primary signal trigger logic: ENTRY_MACD_CROSS_SIGNAL (0 = MACD crosses Signal line), ENTRY_MACD_CROSS_ZERO (1 = MACD crosses zero level), or ENTRY_MACD_CROSS_SIGNAL_ZERO (2 = MACD crosses Signal line filtered by zero-level position).
- InpSection2 (Default: "=== [LOGIC] MACD Core Settings ===") - Visual separator header for core MACD period settings.
- FastEMA (Default: 12) - Period in bars for the fast Exponential Moving Average used in the core MACD calculation.
- SlowEMA (Default: 26) - Period in bars for the slow Exponential Moving Average used in the core MACD calculation.
- SignalSMA (Default: 9) - Period in bars for the Simple Moving Average applied to the MACD main line to form the Signal line.
- AppliedPrice (Default: PRICE_CLOSE) - Price constant (Close, Open, High, Low, Median, Typical, or Weighted) used for the core MACD calculation.
- InpSection3 (Default: "=== [LOGIC] Signal & Arrow Settings ===") - Visual separator header for chart arrow display settings.
- ArrowDistance (Default: 30) - Vertical offset distance in points between the signal candle High/Low and the plotted Buy/Sell arrow.
- ArrowSize (Default: 2) - Width/size scale (integer from 1 to 5) for Buy and Sell signal arrows on the chart.
- BuyArrowColor (Default: clrAqua) - Color applied to bullish Buy signal arrows.
- SellArrowColor (Default: clrRed) - Color applied to bearish Sell signal arrows.
- ShowArrows (Default: true) - Enables (true) or disables (false) drawing Buy and Sell arrows on the main price chart.
Section 2: ATR and Target Levels (SL/TP)
- InpSection4 (Default: "=== [TARGET] ATR & Target Levels (SL/TP) ===") - Visual separator header for ATR-based target lines.
- ShowTargetLines (Default: true) - Enables (true) or disables (false) drawing Entry, Stop Loss, and Take Profit lines for the latest confirmed signal.
- ATR_Period (Default: 7) - Lookback period in bars used to compute the Average True Range (ATR) volatility value on the signal candle.
- ATR_Multiplier (Default: 1.5) - Multiplier applied to the ATR value to define the initial risk distance (1R) between Entry and Stop Loss.
- LineExtendBars (Default: 1) - Number of chart bars to extend the horizontal target lines and labels to the right of the current bar (bar 0).
- LabelFontSize (Default: 8) - Font size in points for the price text labels displayed beside Entry, SL, TP1, TP2, and TP3 lines.
- EntryLineColor (Default: clrGold) - Color of the horizontal Entry price line and label.
- SLLineColor (Default: clrRed) - Color of the horizontal Stop Loss line and label.
- TP1LineColor (Default: clrLimeGreen) - Color of the horizontal first Take Profit line (1R) and label.
- TP2LineColor (Default: clrMediumSeaGreen) - Color of the horizontal second Take Profit line (2R) and label.
- TP3LineColor (Default: clrDodgerBlue) - Color of the horizontal third Take Profit line (3R) and label.
- TargetLineStyle (Default: STYLE_DASH) - Line style (Solid, Dash, Dot, DashDot, or DashDotDot) applied to SL, TP1, TP2, and TP3 lines.
- TargetLineWidth (Default: 1) - Line thickness in pixels for SL and TP target lines (Entry line renders at TargetLineWidth + 1).
Section 3: Alerts and Notifications
- InpSection5 (Default: "=== [LOGIC] Alerts & Notifications ===") - Visual separator header for alert settings.
- EnableAlert (Default: true) - Enables (true) or disables (false) native MetaTrader 4 pop-up alert windows when a signal closes.
- EnableSound (Default: true) - Enables (true) or disables (false) audio playback upon signal confirmation.
- AlertSoundFile (Default: "alert.wav") - Filename of the WAV audio file located inside the MetaTrader 4 Sounds directory.
- EnablePush (Default: false) - Enables (true) or disables (false) push notifications to the MetaTrader mobile app via MetaQuotes ID.
- EnableEmail (Default: false) - Enables (true) or disables (false) email notifications sent via the terminal SMTP configuration.
Section 4: 15-Filter Framework Parameters
- InpFilter1 (Default: "=== 1. RSI CROSS FILTER ===") - Header label for Filter 1 (RSI Cross).
- Use_RSI_Cross_Filter (Default: false) - Enables (true) or disables (false) the RSI threshold crossover confirmation filter.
- RSI_Length (Default: 14) - Lookback period in bars for the RSI Cross filter calculation.
- RSI_Price_Source (Default: PRICE_CLOSE) - Applied price type used to calculate RSI values.
- RSI_Oversold (Default: 30.0) - Lower RSI threshold level used to validate bullish recovery crossovers.
- RSI_Overbought (Default: 70.0) - Upper RSI threshold level used to validate bearish reversal crossovers.
- InpFilter2 (Default: "=== 2. ADX FILTER ===") - Header label for Filter 2 (ADX Trend Strength).
- Use_ADX_Filter (Default: false) - Enables (true) or disables (false) the Average Directional Index minimum trend strength filter.
- ADX_Period (Default: 10) - Lookback period in bars for the ADX main line calculation.
- ADX_Min_Level (Default: 20.0) - Minimum ADX value required to permit Buy or Sell signals.
- InpFilter3 (Default: "=== 3. SINGLE MA FILTER ===") - Header label for Filter 3 (Single Moving Average).
- Use_MA_Filter (Default: false) - Enables (true) or disables (false) price-versus-Moving-Average trend alignment filtering.
- MA_Period (Default: 50) - Averaging period in bars for the single Moving Average filter.
- MA_Method (Default: MODE_SMA) - Smoothing method (SMA, EMA, SMMA, or LWMA) for the single Moving Average filter.
- MA_Shift (Default: 0) - Horizontal shift in bars for the single Moving Average filter.
- InpFilter4 (Default: "=== 4. ICHIMOKU SENKOU SPAN B FILTER ===") - Header label for Filter 4 (Ichimoku Senkou Span B).
- Use_Ichimoku_Filter (Default: false) - Enables (true) or disables (false) closing price alignment relative to Ichimoku Senkou Span B.
- Ichimoku_Tenkan (Default: 9) - Tenkan-sen period in bars for the Ichimoku calculation.
- Ichimoku_Kijun (Default: 26) - Kijun-sen period in bars for the Ichimoku calculation.
- Ichimoku_SenkouB (Default: 52) - Senkou Span B period in bars used as the macro trend boundary.
- InpFilter5 (Default: "=== 5. RSI 75 FILTER ===") - Header label for Filter 5 (Long-Period RSI).
- Use_RSI75_Filter (Default: false) - Enables (true) or disables (false) the long-period RSI 50-level midline regime filter.
- RSI_Filter_Period (Default: 75) - Lookback period in bars for the long-period RSI regime filter.
- InpFilter6 (Default: "=== 6. DOUBLE MA FILTER ===") - Header label for Filter 6 (Double Moving Average).
- Use_DoubleMA_Filter (Default: false) - Enables (true) or disables (false) dual Moving Average directional alignment (MA A vs MA B).
- MA_A_Period (Default: 30) - Period in bars for the fast Moving Average (MA A).
- MA_A_Method (Default: MODE_EMA) - Smoothing method for MA A.
- MA_A_Applied (Default: PRICE_CLOSE) - Applied price constant for MA A.
- MA_A_Shift (Default: 0) - Horizontal bar shift for MA A.
- MA_B_Period (Default: 140) - Period in bars for the slow Moving Average (MA B).
- MA_B_Method (Default: MODE_EMA) - Smoothing method for MA B.
- MA_B_Applied (Default: PRICE_CLOSE) - Applied price constant for MA B.
- MA_B_Shift (Default: 0) - Horizontal bar shift for MA B.
- InpFilter7 (Default: "=== 7. AWESOME OSCILLATOR FILTER ===") - Header label for Filter 7 (Awesome Oscillator).
- Use_AO_Filter (Default: false) - Master toggle to enable (true) or disable (false) Awesome Oscillator sub-filters.
- Use_AO_Volume_Filter (Default: false) - Enables (true) or disables (false) minimum AO amplitude threshold checks.
- AO_Buy_Min (Default: 4.0) - Minimum positive AO threshold required when Use_AO_Volume_Filter is active for Buy signals.
- AO_Sell_Max (Default: -4.0) - Maximum negative AO threshold required when Use_AO_Volume_Filter is active for Sell signals.
- Use_AO_Color_Filter (Default: false) - Enables (true) or disables (false) bar-to-bar AO slope direction filtering (rising for Buy, falling for Sell).
- Use_AO_Zero_Filter (Default: false) - Enables (true) or disables (false) combined AO zero-line polarity and slope confirmation.
- InpFilter8 (Default: "=== 8. PARABOLIC SAR FILTER ===") - Header label for Filter 8 (Parabolic SAR).
- Use_SAR_Filter (Default: false) - Enables (true) or disables (false) Parabolic SAR directional price position filtering.
- SAR_Step (Default: 0.02) - Acceleration factor step increment for the Parabolic SAR calculation.
- SAR_Maximum (Default: 0.2) - Maximum acceleration factor cap for the Parabolic SAR calculation.
- InpFilter9 (Default: "=== 9. HEIKEN ASHI FILTER ===") - Header label for Filter 9 (Heiken Ashi).
- Use_HeikenAshi_Filter (Default: false) - Enables (true) or disables (false) smoothed Heiken Ashi candle body polarity filtering.
- InpFilter10 (Default: "=== 10. CCI TREND FILTER ===") - Header label for Filter 10 (CCI Trend).
- Use_CCI_Filter (Default: false) - Enables (true) or disables (false) zero-line Commodity Channel Index trend filtering.
- CCI_Period (Default: 50) - Lookback period in bars for the CCI Trend filter.
- CCI_Applied (Default: PRICE_CLOSE) - Applied price constant for the CCI Trend filter.
- InpFilter11 (Default: "=== 11. CCI OB & OS FILTER ===") - Header label for Filter 11 (CCI Overbought/Oversold).
- Use_CCI_OBOS_Filter (Default: false) - Enables (true) or disables (false) CCI extreme threshold momentum filtering.
- CCI_OBOS_Period (Default: 14) - Lookback period in bars for the CCI OB/OS filter.
- CCI_OBOS_Applied (Default: PRICE_CLOSE) - Applied price constant for the CCI OB/OS filter.
- CCI_Overbought (Default: 100.0) - Upper CCI threshold level for bullish momentum breakout confirmation.
- CCI_Oversold (Default: -100.0) - Lower CCI threshold level for bearish momentum breakdown confirmation.
- InpFilter12 (Default: "=== 12. RVI FILTERS ===") - Header label for Filter 12 (Relative Vigor Index).
- Use_RVI_Filter (Default: false) - Enables (true) or disables (false) long-period RVI zero-line polarity filtering.
- RVI_Period (Default: 75) - Lookback period in bars for the RVI baseline trend filter.
- Use_RVI_Signal_Filter (Default: false) - Enables (true) or disables (false) RVI main-line versus signal-line crossover alignment.
- RVI_Signal_Period (Default: 20) - Lookback period in bars for the RVI main-versus-signal filter.
- InpFilter13 (Default: "=== 13. MACD FILTERS ===") - Header label for Filter 13 (Secondary MACD Filter).
- Use_MACD_Filter (Default: false) - Enables (true) or disables (false) secondary MACD histogram polarity filtering.
- MACD_FastEMA (Default: 12) - Fast EMA period in bars for the secondary MACD filter.
- MACD_SlowEMA (Default: 26) - Slow EMA period in bars for the secondary MACD filter.
- MACD_SignalSMA (Default: 9) - Signal SMA period in bars for the secondary MACD filter.
- MACD_Applied (Default: PRICE_CLOSE) - Applied price constant for the secondary MACD filter.
- Use_MACD_Zero_Filter (Default: false) - Enables (true) or disables (false) secondary MACD main-line zero-level alignment.
- InpFilter14 (Default: "=== 14. SR & FIBONACCI FILTERS ===") - Header label for Filter 14 (Support/Resistance and Fibonacci).
- Use_SR_Filter (Default: false) - Enables (true) or disables (false) swing Support and Resistance zone proximity filtering.
- SR_Period (Default: 50) - Lookback window in bars used to identify recent swing highs and lows for Support and Resistance.
- SR_Zone_Points (Default: 80) - Tolerance zone width in points around Support and Resistance levels.
- Use_Fib_Filter (Default: false) - Enables (true) or disables (false) swing-based Fibonacci retracement zone filtering.
- Fib_Level_1 (Default: 0.382) - First Fibonacci retracement ratio boundary (default 38.2%).
- Fib_Level_2 (Default: 0.618) - Second Fibonacci retracement ratio boundary (default 61.8%).
- ZigZag_Depth (Default: 12) - Minimum bar depth parameter used to detect swing pivots for the Fibonacci filter.
- ZigZag_Deviation (Default: 5) - Minimum price deviation in points required between consecutive swing pivots.
- ZigZag_Backstep (Default: 3) - Minimum bar separation between alternating swing highs and swing lows.
- InpFilter15 (Default: "=== 15. SUPERTREND FILTER ===") - Header label for Filter 15 (Supertrend).
- Use_Supertrend_Filter (Default: false) - Enables (true) or disables (false) ATR-based Supertrend directional regime filtering.
- ST_AtrPeriod (Default: 10) - ATR lookback period in bars for the Supertrend filter calculation.
- ST_Factor (Default: 3.0) - Volatility band multiplier factor applied to the ATR in the Supertrend filter.
Risk Disclaimer
Trading foreign exchange, commodities, indices, and other leveraged financial instruments carries a high level of risk and may not be suitable for all investors. Past performance and historical signal behavior do not guarantee future results. This indicator is an analytical software tool designed solely to assist traders with technical chart analysis and risk-to-reward visualization; it does not execute trades automatically and does not constitute financial or investment advice. Always test the indicator thoroughly on a demo account to understand its behavior across different market conditions before applying it to live trading decisions.
Prodotti consigliati
Con questo strumento di trading puoi scansionare 15 mercati contemporaneamente. Presentazione del nuovo indicatore di trading 2024: ️ Dashboard Stocastico multi valuta e multi time frame. Ci sono almeno due ragioni per cui ho creato questo strumento di trading: Innanzitutto, sono stanco di osservare solo un mercato. In secondo luogo, non voglio perdere il momento di ingresso in un altro mercato. Ecco perché voglio conoscere contemporaneamente altre condizioni di mercato. Per questo motiv
HTF Candle Plus Timer Migliora la tua esperienza di trading con HTF Candle Plus Timer, un indicatore intelligente che mostra le candele dei timeframe superiori direttamente sul tuo grafico attuale. Ti permette di rimanere allineato con il quadro generale del mercato concentrandoti sul tuo timeframe preferito. Caratteristiche Principali: Candele di timeframe superiori: Disegna candele personalizzate di timeframe superiori (HTF) come H1, H4, D1, W1 o MN direttamente sui grafici di timeframe inferi
CHF Portal
Ngo Yung Lau
CHF Portal is designed for Trading USDCHF specifically. Trading Concept The operation concept of CHF Portal is based on an algorithm which tries to determine the Trend. To be more specific, CHF Portal works with its own calculation logic according to historical volatility and price movement. It is trying to find out the Top or Bottom in a Trend, and open the Short or Long Position accordingly. Don't expect CHF Portal can be able to open the trade on the highest or lowest level, because CHF Port
Liquidity Sentinel Pro – Dashboard Multi-TF & Avvisi di Rifiuto delle Candele Descrizione: Liquidity Sentinel Pro è un potente indicatore MT4 “tutto-in-uno”, progettato per offrire ai trader una visione completa della dinamica del mercato combinando l’analisi delle tendenze multi-timeframe, la forza di domanda/offerta e avvisi precisi di rifiuto delle candele. Questo strumento fornisce informazioni operative su quali coppie di valute o asset sono in trend, evidenzia punti di inversione ad alta p
Smart Trend Forecasting Slope-Based Trend Analysis Indicator with Alert Support Overview Smart Trend Forecasting is a slope-based trend analysis indicator derived from a classic moving average trend model originally developed by Wizard Serg and referenced in Forex Magazine #104. The indicator is designed to monitor: Trend direction Momentum shifts Trend transition conditions Moving average slope behavior It includes visual markers and configurable alert notifications for trend state changes. Ma
Trade Stats
Johannes Schoeman
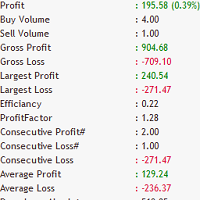
Does your trading consist of Multiple EA's, Multiple time frames an no clear indication of how each individual strategy or time frame is performing, then this indicator will help. Assign the EA Magic number to this indicator and track it's performance on the chart by selecting on chart the period, today, week, month year or all history to view. Easy visual colour changing header to display the performance of the EA for the respective periods.    Minimize the panel to reduce chart clutter. Add yo
L'indicatore a quadrante "cool volumes" è stato creato sulla base dei volumi in teak su MT4. L'indicatore stesso tiene traccia in un determinato periodo di tempo (selezione del periodo di tempo) del numero di volumi per l'acquisto o la vendita. E quando c'è un eccesso anomalo dei volumi di venditori o acquirenti, emette un segnale per vendere o acquistare. Nella finestra in basso vengono disegnati grafici a barre colorati, in cui il colore verde mostra la predominanza degli acquirenti al mome
Volume Istituzionale [tambangEA] Problema La maggior parte dei trader utilizza troppi strumenti separati per interpretare il mercato. Un indicatore per il volume, un altro per il VWAP, un altro per i livelli di supporto e resistenza, un altro per il momentum e un altro per il contesto di trading. Il risultato è solitamente lo stesso: un grafico affollato, segnali contrastanti, processi decisionali lenti e ingressi tardivi. Gli strumenti standard per l'analisi del volume presentano anche un'im
DIVERGENCE CORE PRO MT4 - VERSION 8.40 Institutional RSI Hidden Divergence & Multi-Timeframe Portfolio Engine for MetaTrader 4 Developed by: Stable Growth Finance (SGFinance) Divergence Core Pro MT4 (Version 8.40) is an institutional-grade, fully automated trading system engineered to capture high-probability trend continuation cycles using RSI Hidden Divergence By identifying structural market swings and correlating them with momentum shifts, the system enters pullbacks at optimal price levels
Institutional Fusion Levels (Livelli di Fusione Istituzionale) Institutional Fusion Levels è un indicatore professionale di supporto e resistenza multi–timeframe, progettato per identificare zone di reazione del prezzo ad alta probabilità istituzionale utilizzando i livelli di struttura di mercato del giorno precedente, della settimana precedente e del mese precedente. L’indicatore traccia automaticamente sul grafico aree chiave di supporto e resistenza basate sulla liquidità e mette in evidenza
MTF Phase Engine Mini Dashboard MTF Phase Engine Mini Dashboard   is a compact multi-timeframe market condition panel designed for traders who want to read trend phase, RSI pressure, moving average structure, and momentum strength quickly across multiple timeframes. Instead of loading several indicators or switching between charts, this dashboard displays the key condition data for M1, M5, M15, M30, H1, H4, D1, W1, and MN in one clean on-chart panel. The indicator combines 5/13 moving average
Order Block Intelligence Engine v1.02 Detects order block zones using confirmed swing structure, break-of-structure with displacement, and a multi-factor quality score. Tracks each zone through a five-state lifecycle and optionally projects a next target level. OVERVIEW The indicator identifies order block zones on the current chart timeframe. Each zone is defined by the origin candle (or base of consecutive candles) that preceded a break of structure, and by the swing point whose break confirme
Descrizione Triangle Breakout Retest Dashboard Pro Multi Symbol è un indicatore di trading multi-strumento in stile istituzionale progettato per operazioni basate su breakout e retest della struttura di mercato. Scansiona automaticamente più coppie di valute, identifica pattern di consolidamento a triangolo, determina la direzione del breakout e attende un retest confermato prima di generare segnali di ingresso. Questo strumento è progettato per aiutare i trader a evitare falsi breakout, concent
Fibo Shadow MT4
Robby Suhendrawan
Fibo Shadow (FISH) – The Precision Entry & Zero Floating Indicator for MT4 Padroneggia l'arte del trading di precisione con Fibo Shadow. Sei stanco di indovinare dove entrare a mercato? Hai difficoltà con Stop Loss ampi e perdi l'ingresso "perfetto"? Incontra Fibo Shadow (FISH) , un indicatore di livello professionale progettato per automatizzare il processo di individuazione degli ingressi di ritracciamento di Fibonacci ad alta probabilità. Fibo Shadow non è solo un altro strumento di Fibonacci
The UNIVERSAL DASHBOARD indicator will eliminate the need of using dozens of indicators on dozens of charts. From one place you can monitor all the pairs and all the timeframes for each of the following indicators: MACD STOCHASTIC WPR RSI CCI You can also use any Custom indicator in the dashboard as long as it has a readable buffer. With a single click you can quickly navigate between charts, pairs and timeframes. Alerts will provide clear indication about what happens for your favorite pairs on
FREE
Top Gun Oscillators
Safwan Rushdi Khalil Arekat
5 (2)
Note : New in 1.6: the indicator now exports the trade signal (but not displayed). Go long with light blue. Go short with red. Exit otherwise. Signal to be imported to your EA using iCustom. This indicator provides Best of the Best linear filter momentum oscillators that I am aware of (Low Pass Differentiators, LPD's) . All of them are  recent developments by this developer, or other researchers. The oscillator line is the first buffer of the indicator, and can be called  in other indicators or
FREE
Rira Renko
Vitor Palmeira Abbehusen
RENKO on Time Chart This indicator is an enhanced Renko, so you can watch the Renko bricks on the chart to understand price movement more clearly the other improvement is automated box size according to ATR (Average True Range) period you can set the ATR number as you want and the box size of Renko changes automatically based on price movement Inputs Mode: Box size is the input to specify the size of the Renko box you want to print on the chart. This input lets you choose the fixed box siz
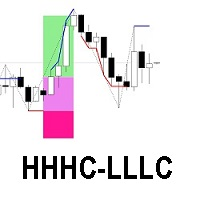
The HHHC-LLLC indicator uses candle by candle analysis, based on the principle of trend confirmation from Higher High, Higher Close candles (bullish) and Lower Low, Lower Close candles (bearish). There is no lag, no re-painting, and averaging is not used. HHHC-LLLC helps confirm: market structure and levels - look left to see them line up trends, pullbacks & reversals Bull moves (blue), Bear moves (red) Structure Zig Zags (black dotted lines), for summarizing market moves exhaustion and stalling
Oscillator helps determine the direction of the market Shows the direction of the price movement and is painted in the appropriate color. Allows you to conduct trend and counter trend trading It works on all timeframes, on any currency pairs, metals and cryptocurrency Can be used when working with binary options Distinctive features Does not redraw; Simple and clear settings; It works on all timeframes and on all symbols; Suitable for trading currencies, metals, options and cryptocurrency (Bitco
Colored candles
Alexander Nikolaev
Some candles have a strong tendency to continue the movement or to revert it. With the help of the Colored candles indicator such movements are clearly visible. This indicator calculates the parameters of each candle, as well as its volume, and after that it paints the candles depending on its strength and direction. Bullish candles are colored green and bearish candles - red. The greater the power of the bulls or the bears, the brighter the color. You can change the colors if you want. The indi
Mongol Indicator2
Sumiyabazar Buyanjargal
It's a variation of mid of HH and LL since it compares the higher of HH or LL against a period and twice the number of bars back to avoid whipsaws. I used to display this against lines on a chart, but made a histogram out of it and it looks interesting. It looks good at gauging trend strength and general turns (see image below). The name of the indicator is BAM, which is an acronym for "Below and Above Mid". Ways to use it: 1. To see general trend on longer TFs (more than 30 bars back).
Description A colored multicurrency/multisymbol oscillator of the market mood. The oscillator is designed for detecting the continuation or change of the market mood prior to its occurrence. An excellent example is the screenshots that show all the features of the oscillator. The oscillator may be used with any broker, irrespective of the name of the financial instrument since it is necessary to manually enter the name as an input parameter. If you enter a non-existent or incorrect name of a fin
Jerk Indicator
Safwan Rushdi Khalil Arekat
5 (2)
In physics, "Jerk" is the third time-derivative of position, with acceleration being the second derivative and velocity the first derivative. In technical analysis, the first derivative of price is the price momentum, with the second derivative,acceleration, being seldom used and the third derivative virtually unknown. The magnitude frequency response of a digital differentiator is a positive-slope straight line passing through zero frequency. Therefore, every instance of a digital signal differ
FREE
Multi-Timeframe EMA Momentum Filter — Version 1.0 This indicator is designed to help traders evaluate short-term EMA crossovers in the context of higher timeframe momentum. Its purpose is to reduce noise and highlight setups that align with the broader market trend. How it works: On the main chart, arrows appear when a fast EMA crosses a slow EMA on the current timeframe, provided that higher timeframe momentum confirms the direction. In the subwindow, a histogram displays the difference betwee
FREE
SMC Smart Zones MT4
Muhammad Karman Kadir
Smart Zones is a comprehensive, institutional-grade price action indicator designed specifically for MetaTrader 4 (MT4) traders utilizing Smart Money Concepts (SMC) . Whether you trade Forex, Gold (XAUUSD), or indices, Smart Zones automates your technical analysis by mapping out institutional order flow directly on your MT4 charts—saving you hours of manual charting and eliminating emotional bias. Key Features & Capabilities: Dual Market Structure (Swing & Internal): Automatically detects an
Heiken Ashi Smoothed Strategy is a very simple but powerful system to get forex market trend direction. This indicator is actually 2 indicators in 1 pack, Heiken Ashi and Heiken Ashi Smoothed Moving Average both included. Because HA (Heiken Ashi) and HAS (Heiken Ashi Smoothed) are calculated in the same one system event with necessary buffers and loop only, so it is the FAST, OPTIMIZED and EFFICIENT HA having the combined indicator of MetaTrader 4. You can choose to display HA and HAS in the sam
Fibo Reversals is an indicator which has carefully been put together to attempt to indicate a time period in which an ongoing trend is most probably exhausted and a new trend (actually a reversal trend) inadvertently begins. At this, it should be okay for the manual trader to be on the look out for good trading opportunities. Input Settings Father Fibo  – This Input Determines The Highest Price For The Chosen Input Period. Son Fibo  - This Input Determines The Lowest Price For The Chosen Input
Crystal CopyCat Ultimate MT4
Muhammad Jawad Shabir
5 (1)
Crystal CopyCat Ultimate Ultra-Fast Master–Slave Copier with Zero-Delay Execution and Cross-Platform MT5 Compatibility Architecture: MT4 → MT4 and MT4 → MT5 Full Compatibility MT4 Pro :- https://www.mql5.com/en/market/product/165057 MT5  Free Version: https://www.mql5.com/en/market/product/144569 Complete User Setup Guide:-  https://www.mql5.com/en/blogs/post/764222   1. Overview Crystal CopyCat Ultimate 5.0 is a next-generation trade copy engine engineered for professional traders, portfo
FREE
Femade Indie
Opengates Success International
Femade Indie Vs 1.0 is a simple but multi-currency monitoring Indicator created to instantly notify the trader when an attached currency pair is ready to buy, sell or give signal when such currency pair is getting ready for a big move either up or down. It does this by visual aids on the screen charts, sound and pop-up alerts. If it shows " Medium ", this means that the so called currency signal is almost gone but can still be traded provided the trader will not need a lot of pips which can be b
Volatility Pullback Radar è un indicatore grafico che mostra la tendenza generale corrente e misura la profondità del ritracciamento rispetto alla volatilità attuale del mercato. Funziona sul simbolo e sul timeframe del grafico a cui viene applicato. L'indicatore non apre, chiude o gestisce operazioni. Fornisce informazioni sulla direzione del trend, sulla profondità del ritracciamento e sullo stato corrente del ritracciamento. Come funziona L'indicatore utilizza una media mobile esponenziale di
FREE
Gli utenti di questo prodotto hanno anche acquistato
Currency Strength Wizard è un indicatore molto potente che ti fornisce una soluzione all-in-one per un trading di successo. L'indicatore calcola la potenza di questa o quella coppia forex utilizzando i dati di tutte le valute su più intervalli di tempo. Questi dati sono rappresentati in una forma di indice di valuta facile da usare e linee elettriche di valuta che puoi utilizzare per vedere il potere di questa o quella valuta. Tutto ciò di cui hai bisogno è collegare l'indicatore al grafico che
Trend SniperX MT4
Sarvarbek Abduvoxobov
5 (6)
Trend Sniper X è un indicatore di trend-following multi-timeframe per MetaTrader 5 che aiuta i trader a identificare la direzione del trend e i potenziali punti di inversione con chiarezza e precisione. Per MT5: https://www.mql5.com/en/market/product/181101 Informazioni sul prezzo: Il prezzo attuale è promozionale ed è soggetto a modifiche con il rilascio dei prossimi aggiornamenti e nuove funzionalità. Canale Code2Profit Domina il mercato con l'analisi multi-timeframe! Come massimizzare il tuo
M1 Sniper
Oleg Rodin
4.97 (30)
M1 SNIPER è un sistema di indicatori di trading facile da usare. Si tratta di un indicatore a freccia progettato per l'intervallo temporale M1. L'indicatore può essere utilizzato come sistema autonomo per lo scalping sull'intervallo temporale M1 e come parte del tuo sistema di trading esistente. Sebbene questo sistema di trading sia stato progettato specificamente per il trading sull'intervallo temporale M1, può comunque essere utilizzato anche con altri intervalli temporali. Inizialmente ho pro
Smart Trend Trading System è un indicatore per MetaTrader 4 che riunisce informazioni sul trend, segnali di entrata e uscita e livelli di prezzo in un unico grafico. Combina più di 10 strumenti di trading in un unico sistema, inclusi rilevamento del trend, zone di inversione, Smart Cloud, logica di trailing stop, supporto e resistenza, colorazione delle candele, avvisi e analisi multi-timeframe. Il sistema è progettato per aiutarti a operare in diverse condizioni di mercato: Mercati in trend: I
SIO Oscillator: oscillatore auto-ottimizzante dello squilibrio di semivarianza Acquista l’indicatore e ricevi GRATIS l’Expert Advisor (EA) basato su di esso. La maggior parte degli oscillatori tratta ogni movimento di prezzo allo stesso modo. SIO separa la pressione rialzista da quella ribassista e misura lo squilibrio tra le due, mostrando quale parte controlla davvero il mercato: compratori o venditori. Quando lo squilibrio raggiunge un estremo, SIO genera un segnale chiaro con livelli di ingr
Advanced Supply Demand
Bernhard Schweigert
4.91 (302)
Speciale Trading- SCONTO DEL 30% La soluzione migliore per qualsiasi trader principiante o esperto! Questo indicatore è uno strumento di trading unico, di alta qualità e conveniente, perché abbiamo incorporato una serie di funzionalità proprietarie e una nuova formula. Con questo aggiornamento, potrai visualizzare doppie zone di timeframe. Non solo potrai visualizzare un TF più alto, ma anche entrambi, il TF del grafico e il TF più alto: MOSTRA ZONE ANNIDATE. Tutti i trader che operano con Of
Non repaint MT4
Yan Zhen Du
5 (2)
This is a professional chart indicator designed for traders focused on stability and clear price action. It helps filter market noise and provides clear visual entry and exit zones for your trading decisions. Price Information: The current price is promotional and is subject to change as upcoming updates and new features are released. MQL5 public channel:  CLICK HERE for MT5:  Non-repainting MT5 version Core Features: Strictly Non-Repainting: The system is built with strict non-repaint logic. W
Gann Made Easy
Oleg Rodin
4.84 (174)
Gann Made Easy è un sistema di trading Forex professionale e facile da usare che si basa sui migliori principi del trading utilizzando la teoria di mr. WD Gann. L'indicatore fornisce segnali ACQUISTA e VENDI accurati, inclusi i livelli di Stop Loss e Take Profit. Puoi fare trading anche in movimento utilizzando le notifiche PUSH. CONTATTAMI DOPO L'ACQUISTO PER RICEVERE GRATUITAMENTE LE ISTRUZIONI DI TRADING E OTTIMI INDICATORI EXTRA! Probabilmente hai già sentito parlare molte volte dei metodi d
Questo indicatore è un indicatore per l'analisi automatica delle onde perfetto per il trading pratico! Caso... Nota:   non sono abituato a usare nomi occidentali per la classificazione delle onde a causa dell'influenza della convenzione di denominazione di Tang Lun (Tang Zhong Shuo Zen), ho chiamato l'onda base come   penna   e la banda dell'onda secondaria come   segmento   At allo stesso tempo, il segmento ha la direzione del trend. La denominazione   è principalmente segmento di trend   (que
Attualmente 30% di sconto! La soluzione migliore per ogni principiante o trader esperto! Questo software per cruscotti funziona su 28 coppie di valute. Si basa su 2 dei nostri indicatori principali (Advanced Currency Strength 28 e Advanced Currency Impulse). Offre un'ottima panoramica dell'intero mercato Forex. Mostra i valori di forza delle valute avanzate, la velocità di movimento delle valute e i segnali per 28 coppie Forex in tutti i (9) timeframe. Immaginate come migliorerà il vostro tra
Liquidity Scalper System: un sistema di trading basato sulla liquidità in formato indicatore. La maggior parte degli indicatori mostra solo una freccia, poi è il trader a decidere dove mettere lo stop, dove si trova il target e se fidarsi del segnale. Liquidity Scalper System copre l'intero ciclo del trade: trova i pool di liquidità, dà un segnale alla loro rottura, calcola subito Entry, Stop Loss e tre target, e mostra sul pannello le statistiche e i risultati della verifica su dati nuovi. Il
Scalper Vault
Oleg Rodin
4.9 (41)
Scalper Vault è un sistema di trading potente e completo, progettato per i trader che desiderano ottenere risultati costanti nel trading intraday. Questo indicatore ad alta precisione funge da sistema di trading autonomo, offrendo analisi di livello istituzionale sia per il mercato Forex che per le Opzioni Binarie. CONTATTAMI DOPO L'ACQUISTO PER RICEVERE I MIEI CONSIGLI DI TRADING E UN FANTASTICO BONUS! Eliminando le congetture e le complesse analisi manuali, Scalper Vault ti permette di concen
Vi presentiamo ON Trade Waves Patterns Harmonic Elliot Wolfe, un indicatore avanzato progettato per rilevare vari tipi di pattern sul mercato utilizzando metodi sia manuali che automatici. Ecco come funziona: Pattern Armonici: Questo indicatore è in grado di individuare pattern armonici che appaiono sul vostro grafico. Questi pattern sono fondamentali per i trader che praticano la teoria del trading armonico, come descritta nel libro di Scott Carney "Harmonic Trading vol 1 & 2". Che li disegniat
Zoryk Gold mt4
Reda El Koutbane
5 (4)
ZORYK — Sistema avanzato di segnali e pianificazione per XAUUSD su MetaTrader 4 Conosci sicuramente questa situazione. Analizzi l’oro, aspetti l’ingresso e finalmente apri la posizione. Il prezzo si muove immediatamente contro di te. Chiudi troppo presto, sposti lo Stop Loss oppure esiti per alcuni secondi. Poco dopo, il mercato raggiunge esattamente la direzione e l’obiettivo che avevi previsto, ma senza di te. Il problema non era sempre la direzione. Il vero problema era l’incertezza. No
RFI levels PRO
Roman Podpora
5 (2)
L'indicatore mostra accuratamente i punti di inversione e le zone di ritorno dei prezzi in cui il       Principali attori   . Vedi dove si formano le nuove tendenze e prendi decisioni con la massima precisione, mantenendo il controllo su ogni operazione. VERSION MT5     -     Rivela il suo massimo potenziale se combinato con l'indicatore   TREND LINES PRO Cosa mostra l'indicatore: Strutture di inversione e livelli di inversione con attivazione all'inizio di un nuovo trend. Visualizzazione dei l
Atomic Analyst
Issam Kassas
5 (14)
Atomic Analyst — MetaTrader 4 Per domande sul prodotto, indicazioni sulla configurazione o supporto tecnico, scrivimi direttamente qui su MQL5. L’indicatore trasforma calcoli complessi del mercato in semplici segnali visivi, candele colorate, letture del trend, livelli di stop-loss e diverse zone di take-profit che i trader possono capire rapidamente e usare in condizioni reali di mercato. Principali utilizzi di trading: Scalping e trading intraday: Progettato per decisioni rapide, frecce chiar
ShapeRadar - indicatore dei pattern grafici classici ShapeRadar individua automaticamente sul grafico i pattern classici dell’analisi tecnica: doppi e tripli massimi e minimi, Testa e Spalle e la sua versione inversa, cunei ascendenti e discendenti, rettangoli, triangoli, bandiere e pennant. Quando il prezzo chiude oltre il limite di una figura, l’indicatore disegna il pattern, il punto di ingresso, il livello di stop loss e l’obiettivo, mentre un pannello informativo riassume tutti i pattern ri
PRO Renko System
Oleg Rodin
5 (31)
PRO Renko System è un sistema di trading altamente accurato appositamente progettato per il trading di grafici RENKO. Questo è un sistema universale che può essere applicato a vari strumenti di trading. Il sistema neutralizza efficacemente il cosiddetto rumore di mercato che consente di accedere a segnali di inversione accurati. L'indicatore è molto facile da usare e ha un solo parametro responsabile della generazione del segnale. Puoi facilmente adattare lo strumento a qualsiasi strumento di
SR Liquidity
Oleg Rodin
5 (3)
SR Liquidity è un indicatore di trading progettato per individuare le zone nascoste in cui si concentra la liquidità di mercato e dove il prezzo reagisce con maggiore intensità. Queste aree di liquidità agiscono come potenti livelli di supporto e resistenza, offrendo una mappa chiara dei punti in cui è più probabile che il mercato inverta la propria direzione. Invece di tracciare le classiche linee di supporto e resistenza, SR Liquidity analizza l'effettivo comportamento dei prezzi per individua
Auto Optimized SpeedAngle è un sistema di vettorizzazione del momento di livello istituzionale che elimina l'overfitting ( curve-fitting ) attraverso l'ottimizzazione continua Walk-Forward (WFO). Invece di affidarsi a input statici che si degradano quando i regimi di mercato cambiano, l'indicatore recalibra dinamicamente i suoi parametri utilizzando la validazione Out-of-Sample (OOS), assicurando che i segnali visualizzati rappresentino reali vantaggi statistici anziché anomalie storiche. Quadro
Italo Volume Indicator
Italo Santana Gomes
4.92 (79)
BUY INDICATOR AND GET EA FOR FREE AS A BONUS + SOME OTHER GIFTS! ITALO VOLUME INDICATOR  is the best volume indicator ever created, and why is that? The Indicator works on all time-frames and assets, indicator built after 7 years of experience on forex and many other markets. You know many volume indicators around the internet are not complete, does not help, and it's difficult to trade, but the Italo Volume Indicator is different , the Italo Volume Indicator shows the wave volume, when market
Stima il movimento di prezzo più probabile nel breve termine sulla base di calcoli matematici avanzati. Caratteristiche Stima del movimento immediato del prezzo sul timeframe del grafico e su tutti quelli superiori; Calcolo del trend reale del mercato; Calcolo dei livelli di supporto e resistenza più importanti; Avvisi per zone di congestione, attraversamenti di livelli e cambi di trend; Leggero sulle risorse di sistema: linee e pannello vengono aggiornati solo quando un valore cambia; Autorego
Route Lines Prices
Vitalyi Belyh
3 (1)
Route Lines Prices - è un indicatore progettato per individuare le direzioni di prezzo. La sua interfaccia semplice contiene diversi algoritmi per il calcolo del comportamento dei prezzi e della direzione futura. Questi algoritmi includono il calcolo della volatilità e lo smussamento dei prezzi in base ai timeframe utilizzati. L'indicatore ha un singolo parametro per modificare il valore di " Calculating price values ". Il valore predefinito di 1 fornisce un calcolo automatico bilanciato, che p
All in One package includes the  Oscillator Predictor ,  MACD Predictor ,  Thrust Scanner  and  Advanced Fibonacci  indicators which are mandatory for applying  Dinapoli  trade plans.  Please visit below links for detailed explanations of indicators. Advanced Fibonacci Indicator =>  https://www.mql5.com/en/market/product/52834 Thrust Scanner Indicator => https://www.mql5.com/en/market/product/52830 Overbought /Oversold Predictor indicator => https://www.mql5.com/en/market/product/52621 Macd P
True Direction Oscillator
Muhammad Elbermawi
4.85 (364)
Oppure (TDO) che è un indice che misura il tasso di variazione del prezzo utilizzando il principio del " Pure Momentum ". Quando il prezzo di un titolo avanza da 10 a 15, il tasso di variazione del prezzo è del 150%, ma quando scende da 15 a 10, il tasso di variazione del prezzo è solo del 33,3%. Ecco perché gli indicatori di analisi tecnica come "Price Rate of Change" (ROC) o "Momentum" forniscono letture più elevate per i movimenti di prezzo ascendente rispetto a quelli dati a quelli discenden
Quantum Imbalance Profiles   è un indicatore delle fasi di equilibrio e squilibrio. Mostra a quali prezzi il mercato ha scambiato volume, quale parte ha dominato all'interno di quella zona e attraverso quali livelli il prezzo si è poi espanso con un impulso. Un profilo di volume classico risponde a una sola domanda: dove sono avvenuti gli scambi. Non mostra quale parte ha dominato a ogni prezzo, come si è conclusa la fase laterale né in quale direzione il mercato ne è uscito. Quantum Imbalance P
Indicatore per il trading manuale e l'analisi tecnica per il Forex. È costituito da un indicatore di tendenza con il livello di apertura del giorno di negoziazione e da un indicatore a freccia per determinare i punti di ingresso. L'indicatore non si ricolora; funziona quando la candela si chiude. Contiene diversi tipi di avvisi per le frecce di segnalazione. Può essere configurato per funzionare su qualsiasi grafico, strumento di trading o intervallo di tempo. La strategia di lavoro si basa su
Dark Support Resistance  is an Indicator for intraday trading. This Indicator is programmed to identify  Support and Resistance Lines , providing a high level of accuracy and reliability. Key benefits Easily visible lines Only the most important levels will be displayed Automated adjustment for each timeframe and instrument Easy to use even for beginners Never repaints, never backpaints, Not Lag 100% compatible with Expert Advisor development All types of alerts available: Pop-up, Email, Push
ATTUALMENTE SCONTATO DEL 40%! La soluzione migliore per ogni principiante o trader esperto! Questo indicatore è uno strumento di trading unico, di alta qualità e conveniente perché abbiamo incorporato una serie di caratteristiche proprietarie e una formula segreta. Con un solo grafico fornisce avvisi per tutte le 28 coppie di valute. Immaginate come migliorerà il vostro trading perché sarete in grado di individuare l'esatto punto di innesco di una nuova tendenza o opportunità di scalping! Co
M1 Arrow Scalping - shows signals on the M1 period, does not redraw entry points and can work on all major currency pairs + metals (gold/silver). The indicator analyzes the market using algorithms for determining price patterns and shows the trader the price reversal points on the chart. The red dot shows that the price will turn down and the blue dot shows that the price will turn up. The indicator also sends signals to the phone in the form of PUSH notifications. Therefore, you do not need to

Altri dall’autore
Overview MACD Signal with Multi Filters is an advanced technical analysis indicator engineered for MetaTrader 5 (MT5). The software combines the classic Moving Average Convergence Divergence (MACD) oscillator architecture with a modular 14-filter confirmation engine (MultiFilterSuite). It is developed to assist manual traders, quantitative analysts, and algorithmic system developers in identifying momentum shifts, trend continuations, and structural turning points while filtering out sideways ma
Parabolic SAR Multi-Filter System MT5: Algorithmic Trend Reversal Engine 1. PRODUCT OVERVIEW & OPERATIONAL ARCHITECTURE Parabolic SAR Multi-Filter System MT5 is a professional multi-component technical analysis indicator engineered for the MetaTrader 5 terminal. The indicator combines J. Welles Wilder's classic Parabolic Time/Price System with an advanced modular filtering architecture comprising 17 distinct secondary validation engines. The primary objective of this software is to eliminate f
Hull Trend Arrows MT5 with Multi-Filter Suite - Technical Documentation 1. Overview and Analytical Purpose Hull Trend Arrows MT5 with Multi-Filter Suite is an algorithmic technical indicator for MetaTrader 5. It integrates the low-lag calculation engine of the Hull Moving Average (HMA) with fourteen modular confirmation filters to identify directional momentum transitions, calculate inflection points, and display non-repainting entry signals on the chart. Standard moving averages introduce sign
FREE
HA Signal MultiFilter MT5 - Technical Operational Manual & Architecture Guide 1. SYSTEM OVERVIEW & ARCHITECTURAL FOUNDATION HA Signal MultiFilter MT5 is a specialized analytical indicator developed for MetaTrader 5 terminal to identify directional momentum expansions and structural trend continuations[cite: 2]. By synthesizing smoothed Heiken Ashi candlestick price discovery with a modular 15-layer secondary confirmation filter suite, the system extracts high-probability market shifts while fil
FREE
Product Overview: Relative Vigor Index Multi-Filter Technical System The Relative Vigor Index (RVI) Multi-Filter Indicator is a comprehensive technical analysis engine developed for the MetaTrader 5 terminal. Designed to identify cyclical momentum shifts, trend continuations, and structural market turning points, this analytical system couples the classic Relative Vigor Index formula with an advanced multi-layered confirmation matrix consisting of 17 distinct technical filters. Rather than rely
FREE
1. OVERVIEW Harmonic Dashboard is a specialized multi-symbol and multi-timeframe analytical indicator designed for MetaTrader 5 (MT5). The software systematically scans financial instruments across multiple timeframes to identify six classical harmonic chart patterns: Gartley, Bat, Butterfly, Crab, Cypher, and Shark. The application consolidates multi-asset scanner results, trend filter validation metrics, price level projections, and interactive chart navigation controls into a single graphic
Overview The MA Cross Scanner Pro is an advanced, highly optimized multi-symbol and multi-timeframe analytical dashboard engineered specifically for the MetaTrader 5 terminal. Designed for technical analysts, systemic traders, and quantitative researchers, this utility serves as a comprehensive market surveillance engine. Its primary objective is to continuously monitor a customized array of financial instruments across numerous timeframes simultaneously, detecting precise moving average crosso
CCI MultiFilter Overbought Oversold Signal Pro MT5 Technical Specification & Operational Manual  1. Overview and System Identity CCI MultiFilter Overbought Oversold Signal Pro MT5 is an institutional-grade technical analysis indicator engineered natively for MetaTrader 5. Developed for quantitative analysts, systematic manual traders, and multi-asset operators, the system provides an objective algorithmic framework to identify cyclical market extremes, momentum shifts, and structural trend cont
WPR Williams Percent Range All Pair Timeframe Scanner Dashboard Overview WPR Scanner Dashboard Pro is a multi-symbol, multi-timeframe market scanning indicator and visual chart overlay utility built for MetaTrader 4 (MT4). The tool monitors Williams Percent Range (WPR) momentum exhaustion and threshold breakouts across multiple currency pairs, metals, indices, and CFDs simultaneously from a single chart window. In addition to its core WPR detection engine, the indicator incorporates an optiona
WAE Waddah Attar Explosion Multi Pair TimeFrame Scanner 1. Overview - WAE Scanner Dashboard is a technical analysis indicator and multi-symbol, multi-timeframe market scanner built for MetaTrader 4 (MT4). - It automates multi-chart monitoring by scanning volatility-driven momentum breakouts based on the Waddah Attar Explosion (WAE) methodology across multiple currency pairs, crosses, indices, or metals simultaneously. - Candidate signals are processed through a modular 15-filter technical conf
UT Bot Trend Multi Pair Timeframe Scan Dashboard Overview UT Bot Scanner Dashboard is a multi-pair and multi-timeframe technical indicator and market scanner developed natively for MetaTrader 4 (MT4). It continuously monitors selected Forex pairs, precious metals, indices, or active Market Watch symbols across multiple timeframes simultaneously to detect dynamic Average True Range (ATR) volatility trailing stop crossovers. Instead of manually cycling through dozens of individual charts to monit
TDI Traders Dynamic Index RSI Scanner All Pair TF Overview TDI & RSI Dynamic Line Dashboard Scanner is a multi-symbol and multi-timeframe analytical indicator designed for MetaTrader 4. The tool monitors multiple currency pairs, commodities, or indices across selected chart timeframes simultaneously to detect crossover events derived from the Traders Dynamic Index (TDI) and dual Relative Strength Index (RSI) Dynamic Lines. Every detected signal is evaluated against an optional 15-module technica
Stochastic Scanner Dashboard for MetaTrader 4 Stochastic Overbought Oversold Scanner Dashboard All Pair Time frame Overview - Stochastic Scanner Dashboard is a multi-symbol and multi-timeframe technical analysis indicator and market scanner built for MetaTrader 4 (MT4). - The tool continuously monitors user-defined currency pairs, metals, or Market Watch symbols across multiple timeframes from one chart. - It detects momentum shifts using configurable Stochastic Oscillator strategies and valida
SSL Channel Trend Scanner Dashboard Multi Pair Multi TimeFrame Overview SSL Channel Multi-Filter Dashboard is a technical analysis indicator and multi-symbol, multi-timeframe market scanner built for MetaTrader 4. It continuously monitors multiple currency pairs, commodities, or other broker instruments across user-selected timeframes to detect directional channel crossovers confirmed by an optional 15-module technical filter suite. Validated signals are organized in an interactive on-chart dash
Relative Vigor Index RVI All Pair and Timeframe Scanner Dashboard Overview RVI Scanner Dashboard is a multi-pair and multi-timeframe technical indicator and interactive scanner panel for MetaTrader 4 (MT4). Built around the Relative Vigor Index (RVI) oscillator, it continuously monitors multiple currency pairs, commodities, or indices across selected timeframes from one chart window. The tool detects directional momentum crossovers, validates setups through an optional 15-module technical conf
RSI Parabolic Overbought Oversold Multi pair Timeframe Scanner 1. Overview - RSI Parabolic Scanner Dashboard is a multi-symbol, multi-timeframe technical analysis indicator and real-time market scanner engineered for MetaTrader 4 (MT4). - It continuously monitors user-defined currency pairs, metals, or visible Market Watch instruments across multiple chart timeframes to identify momentum reversals and overbought or oversold market conditions. - The indicator combines two selectable RSI-based si
RSI Divergence Multi Pair Timeframe Scan Dashboard Overview - Product Type: Multi-symbol, multi-timeframe technical analysis indicator and interactive market dashboard scanner for MetaTrader 4 (MT4). - Core Purpose: Continuously monitors configured currency pairs, precious metals, indices, or active Market Watch symbols across multiple chart timeframes simultaneously to identify Regular and Hidden Relative Strength Index (RSI) divergence setups in one unified terminal window. - Structured Trade
Overview - Product Identity: Pola MultiCandle Scanner Dashboard is a multi-pair and multi-timeframe technical analysis indicator and market scanner developed for MetaTrader 4 (MT4). - Core Purpose: Continuously monitors user-defined currency pairs, precious metals, or Market Watch instruments across multiple timeframes to detect structured multi-candle price action formations, validate setups through a modular 15-indicator confluence suite, calculate volatility-adjusted Stop Loss (SL) and dual
MACD Signal Trend Cross Scanner All Pair Dashboard Overview MACD Scanner Dashboard is a technical analysis utility and multi-symbol, multi-timeframe dashboard indicator designed for MetaTrader 4[cite: 1]. Its primary objective is to monitor MACD crossover events across multiple currency pairs and chart timeframes simultaneously from a single active chart window[cite: 1]. Instead of manually switching between dozens of charts, traders can observe real-time market momentum, directional bias, calc
MA Moving Average Cross Scanner All Pair Timeframe Dashboard Overview MA Cross Scanner is an analytical multi-symbol and multi-timeframe technical indicator equipped with an interactive on-chart dashboard panel for MetaTrader 4[cite: 1]. The tool is engineered to monitor Moving Average (MA) crossover events across multiple currency pairs and timeframes simultaneously, consolidating signal detection, modular trend/momentum filtering, and Average True Range (ATR) risk-reward level calculations in
Ichimoku Tenkan Kijun Cross Scanner All Pair TimeFrame Overview TK Cross Scanner Dashboard is a technical analysis indicator and multi-asset market scanner engineered for the MetaTrader 4 platform. The utility monitors multiple currency pairs, commodities, and timeframes simultaneously to detect Ichimoku Tenkan-sen and Kijun-sen crossovers (TK Cross). In addition to automated signal scanning, the software calculates dynamic Stop Loss (SL) and dual Take Profit (TP1 and TP2) reference levels usin
Ichimoku Senkou Span B Scanner All Pair Timeframe Overview Senkou Span B Scanner Dashboard MT4 is a technical analysis indicator and multi-asset market scanner designed for MetaTrader 4. The tool monitors multiple currency pairs, commodities, and timeframes simultaneously from a single chart window to detect price interactions with the Ichimoku Kinko Hyo Senkou Span B boundary. In addition to scanning for signal candidates, the indicator integrates a 15-module secondary confirmation suite, calc
Heiken Ashi Multi Currency Pair Time Frame Scan Dashboard Overview Heiken Ashi Multi Timeframe Scanner Dashboard is a technical analysis utility and multi-symbol, multi-timeframe market scanner developed for the MetaTrader 4 platform. The tool is designed to monitor multiple currency pairs, commodities, or indices simultaneously from a single chart window. Instead of manually switching between dozens of charts and timeframes to inspect Heiken Ashi candle formations, traders can view active dire
Pro Harmonic Pattern Scanner All Pair Time Frame Dashboard Harmonic Pattern Scanner Dashboard MT4 is an analytical multi-symbol and multi-timeframe technical indicator designed for MetaTrader 4. It automatically scans price action across selected currency pairs, metals, or Market Watch instruments to identify classic XABCD harmonic structures, calculate Fibonacci-based entry, Stop Loss, and Take Profit zones, and validate setups through an integrated modular trend and momentum filter suite. Op
Fractal Breakout Scanner Multi Pair Timeframe Dashboard Overview Fractal Breakout Scanner Dashboard is a technical analysis indicator and multi-symbol, multi-timeframe scanning utility designed for MetaTrader 4. The tool monitors multiple currency pairs, commodities, and indices simultaneously to detect price breakouts beyond confirmed Bill Williams Fractal swing highs and swing lows. Rather than requiring manual chart switching across dozens of instruments, the indicator aggregates real-time b
Institutional Candle Price Engulfing Scan All Pair Timeframe Engulfing Scanner Dashboard is a technical analysis utility and multi-symbol, multi-timeframe candlestick pattern scanner for MetaTrader 4. It detects Bullish Engulfing and Bearish Engulfing setups across multiple currency pairs and timeframes simultaneously, displaying active signals in an interactive on-chart table alongside ATR-based Stop Loss and Take Profit reference levels. 1. Overview and Technical Purpose - Product Category:
Pinbar Marubozu Rejection Candlestick Scanner All Pair Timeframe Overview Candle Pattern Scanner Dashboard is a technical analysis utility and multi-pair, multi-timeframe scanner indicator designed for MetaTrader 4. The indicator continuously monitors multiple currency pairs, commodities, or indices across selected timeframes to detect specific Japanese candlestick price action formations—namely Candle Rejection, Full-Body Marubozu, and Classic Pin Bar structures. When a valid candlestick forma
Chaikin Oscillator Scanner All Pair Timeframe Dashboard Overview Chaikin Oscillator Scanner Dashboard is a technical analysis utility and multi-symbol, multi-timeframe market scanner designed for MetaTrader 4 (MT4)[cite: 1]. The indicator monitors multiple currency pairs, commodities, or indices simultaneously across selected chart timeframes to identify Chaikin Oscillator zero-line crossover events[cite: 1]. Detected setups are presented in an interactive on-chart table complete with automated
CCI Signal Trend Overbought Oversold Scanner All Pair TimeFrame Dashboard CCI Multi Timeframe Scanner Dashboard is a technical analysis utility and multi-symbol market scanner developed for MetaTrader 4. The indicator monitors multiple currency pairs and timeframes simultaneously using Commodity Channel Index (CCI) calculations combined with an optional multi-indicator confirmation suite and Average True Range (ATR) volatility projections. 1. Operating Principle and Signal Validity - Core Cal
BB Bollinger Bands Breakout Scanner All Pair Time Frame Bollinger Bands Breakout Scanner Dashboard is a technical analysis utility and multi-symbol, multi-timeframe market scanner engineered for MetaTrader 4 (MT4). The software continuously monitors multiple currency pairs, commodities, or indices across user-defined timeframes to detect confirmed Bollinger Bands breakout setups. Every detected signal is evaluated through an optional modular confirmation suite and automatically paired with vola
Filtro:
Nessuna recensione
Rispondi alla recensione