Wave Master Oscilloscope PRO

WaveMaster Oscilloscope PRO

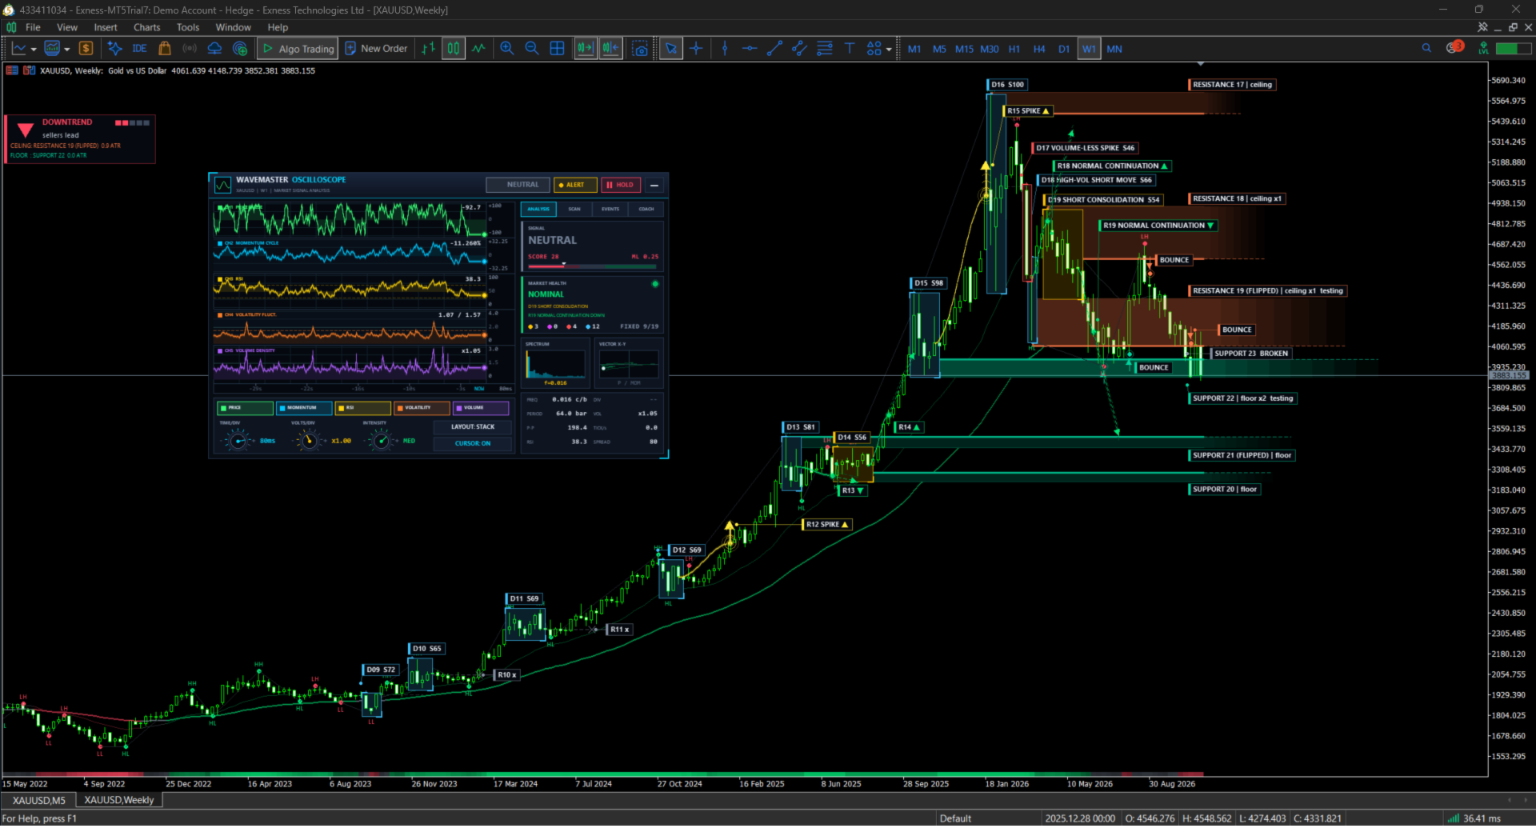
turns raw price action into an oscilloscope-style dashboard and a clear, self-explaining chart overlay: it finds where price was damaged, shows when it repaired, and marks the support and resistance zones that grow out of that repair.

Most indicators give you a line or an arrow and leave you to guess why. WaveMaster Oscilloscope PRO shows the reasoning. It watches for abnormal price behavior, names each event on the chart (D01, D02...), follows it until the market recovers (R01, R02...), and then draws the rebound zone where price is likely to react again.

Everything is drawn on a professional Canvas dashboard that you can drag, minimize and scale, plus a clean overlay on the candles. Labels are placed so they stay readable without covering the candles. Beginners get plain-language trend and coaching hints; experienced traders get a full signal engine, EA-ready buffers, alerts and a multi-symbol scanner.

WaveMaster Oscilloscope is an analysis tool. It does not open, modify or close trades.

Key features
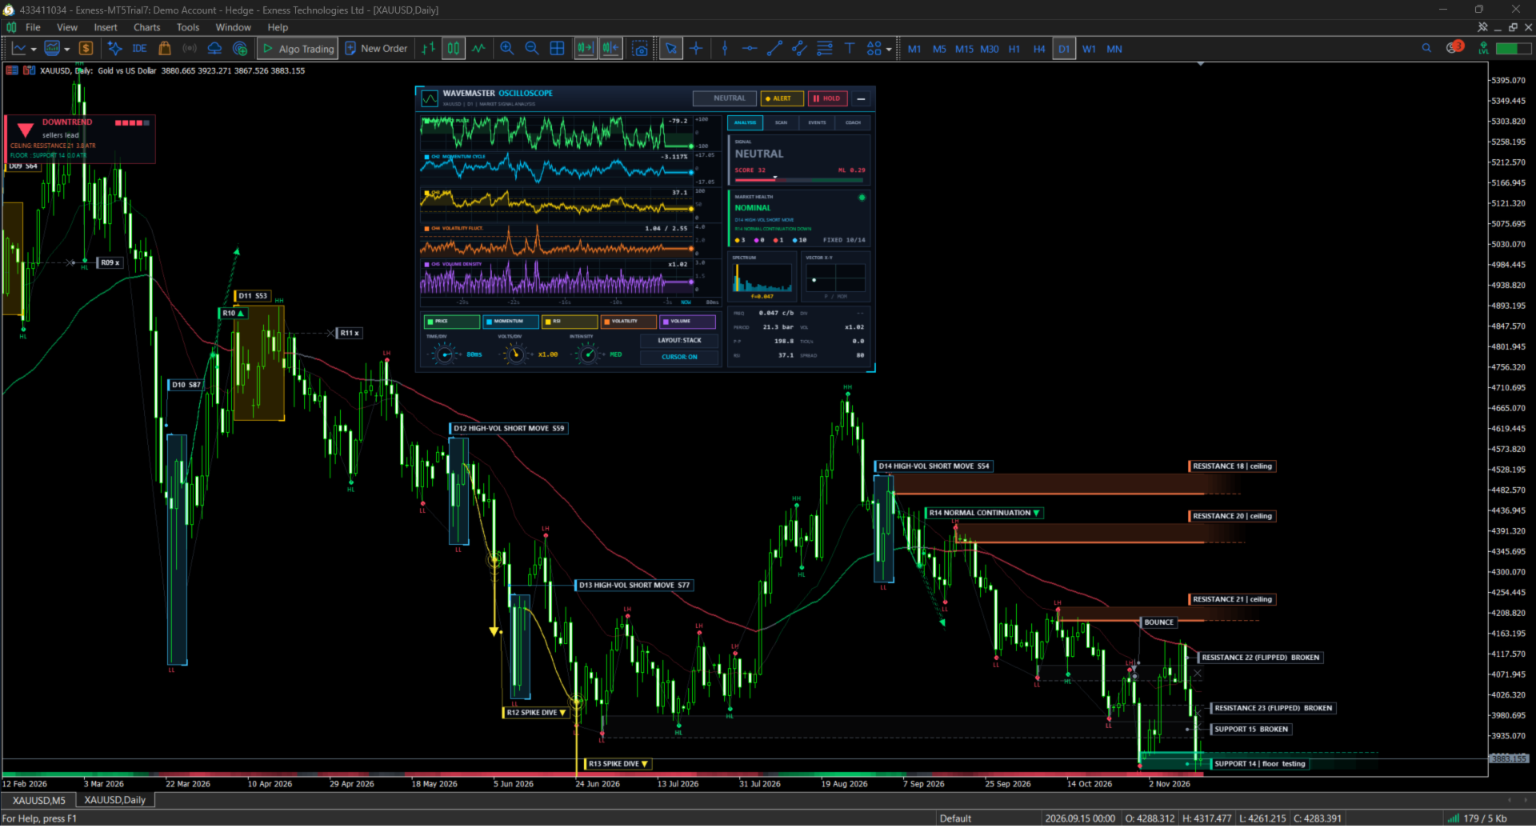
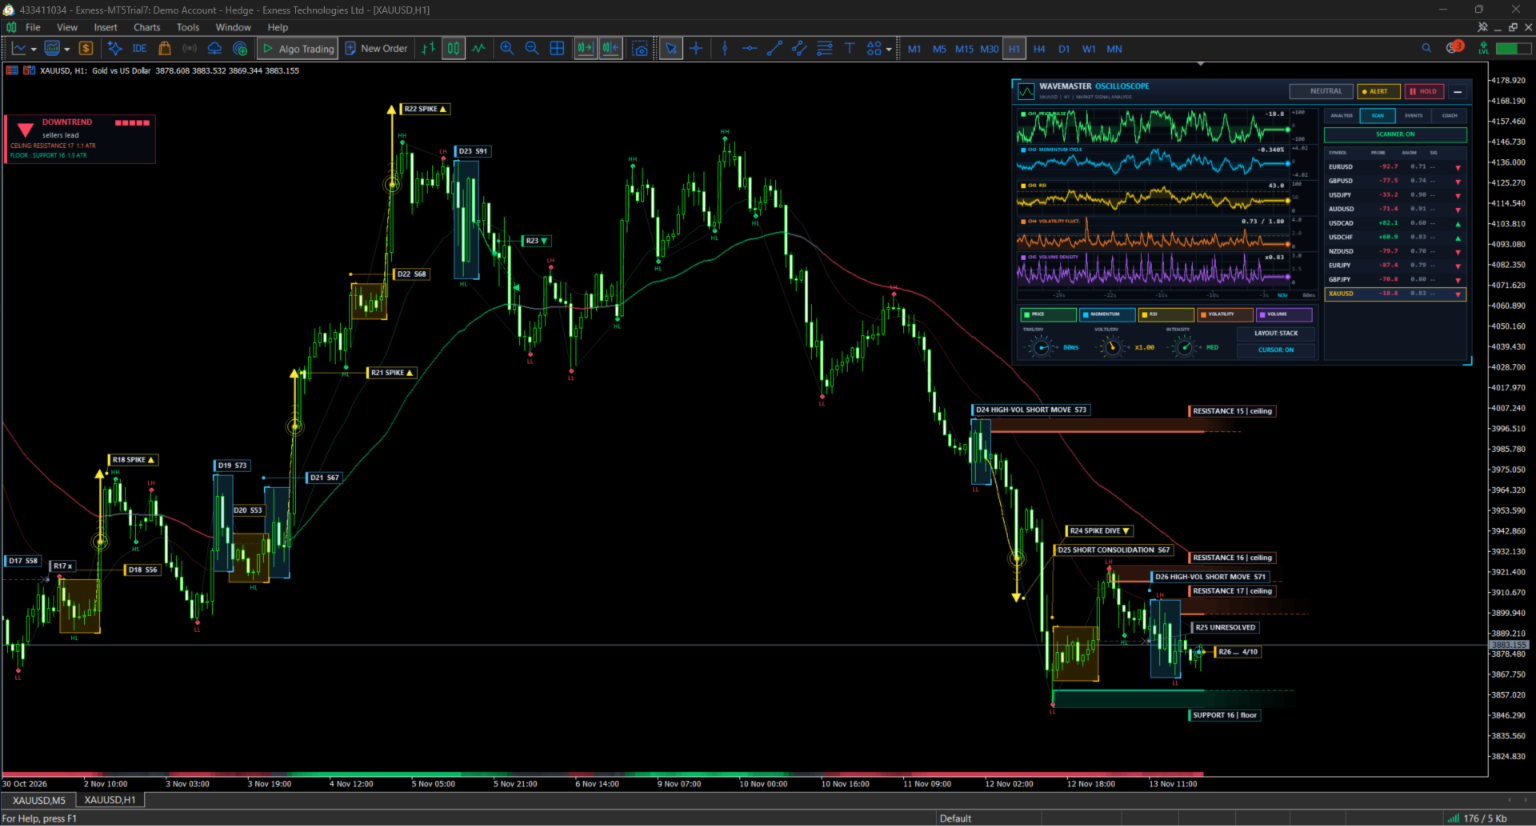
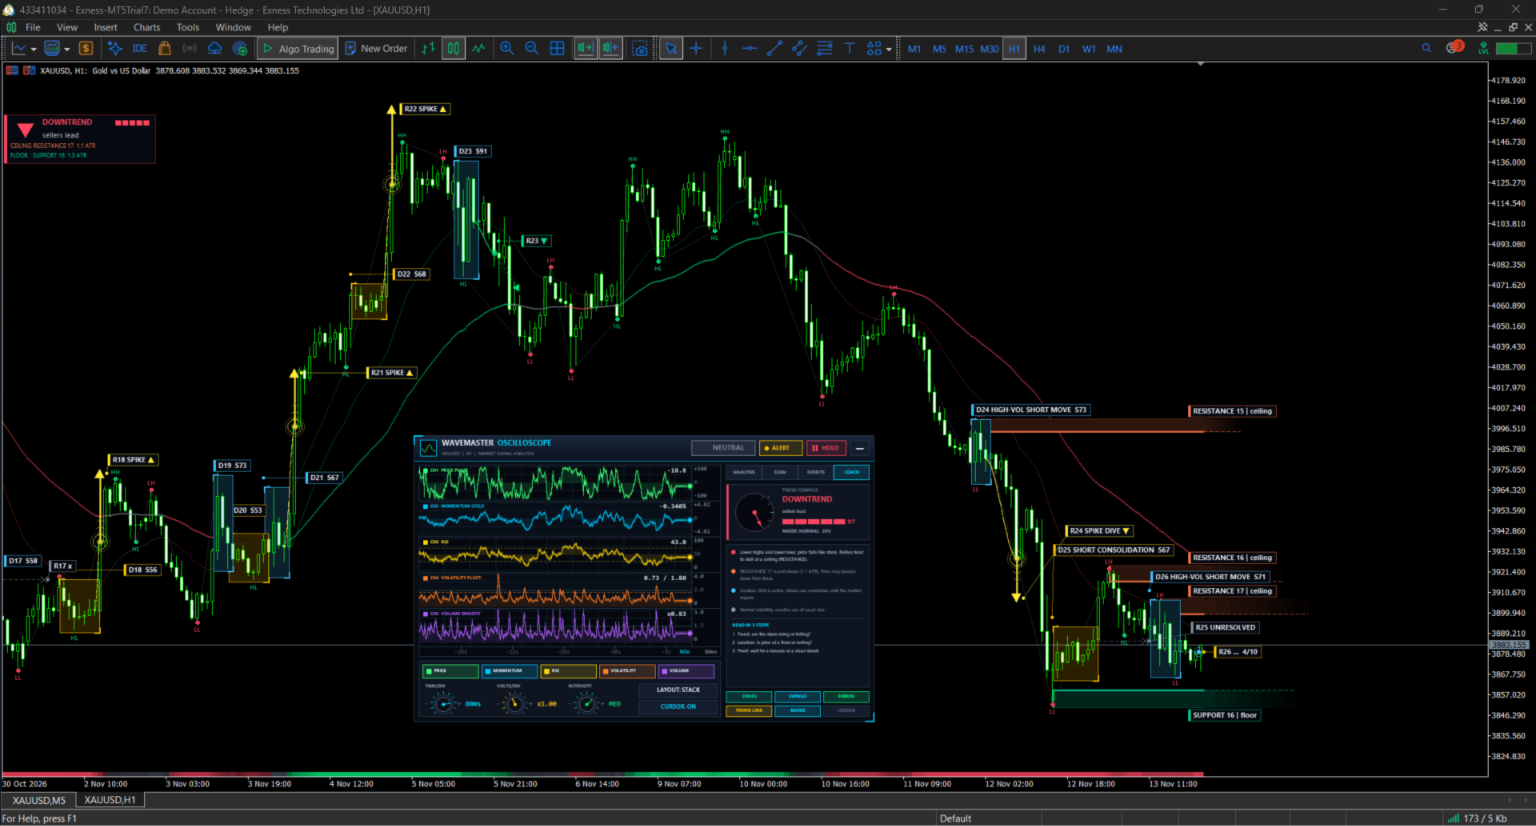
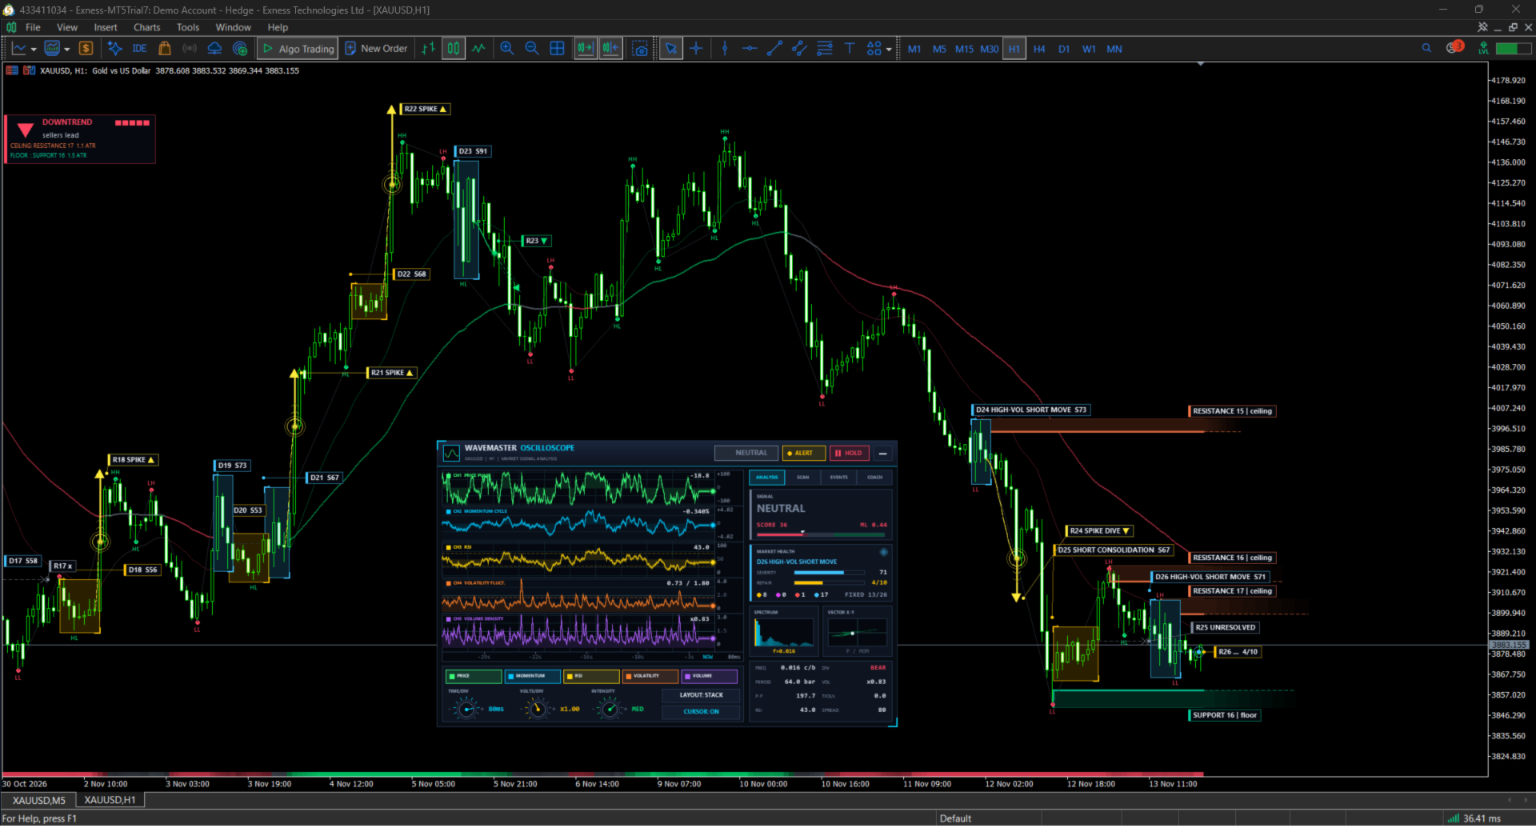
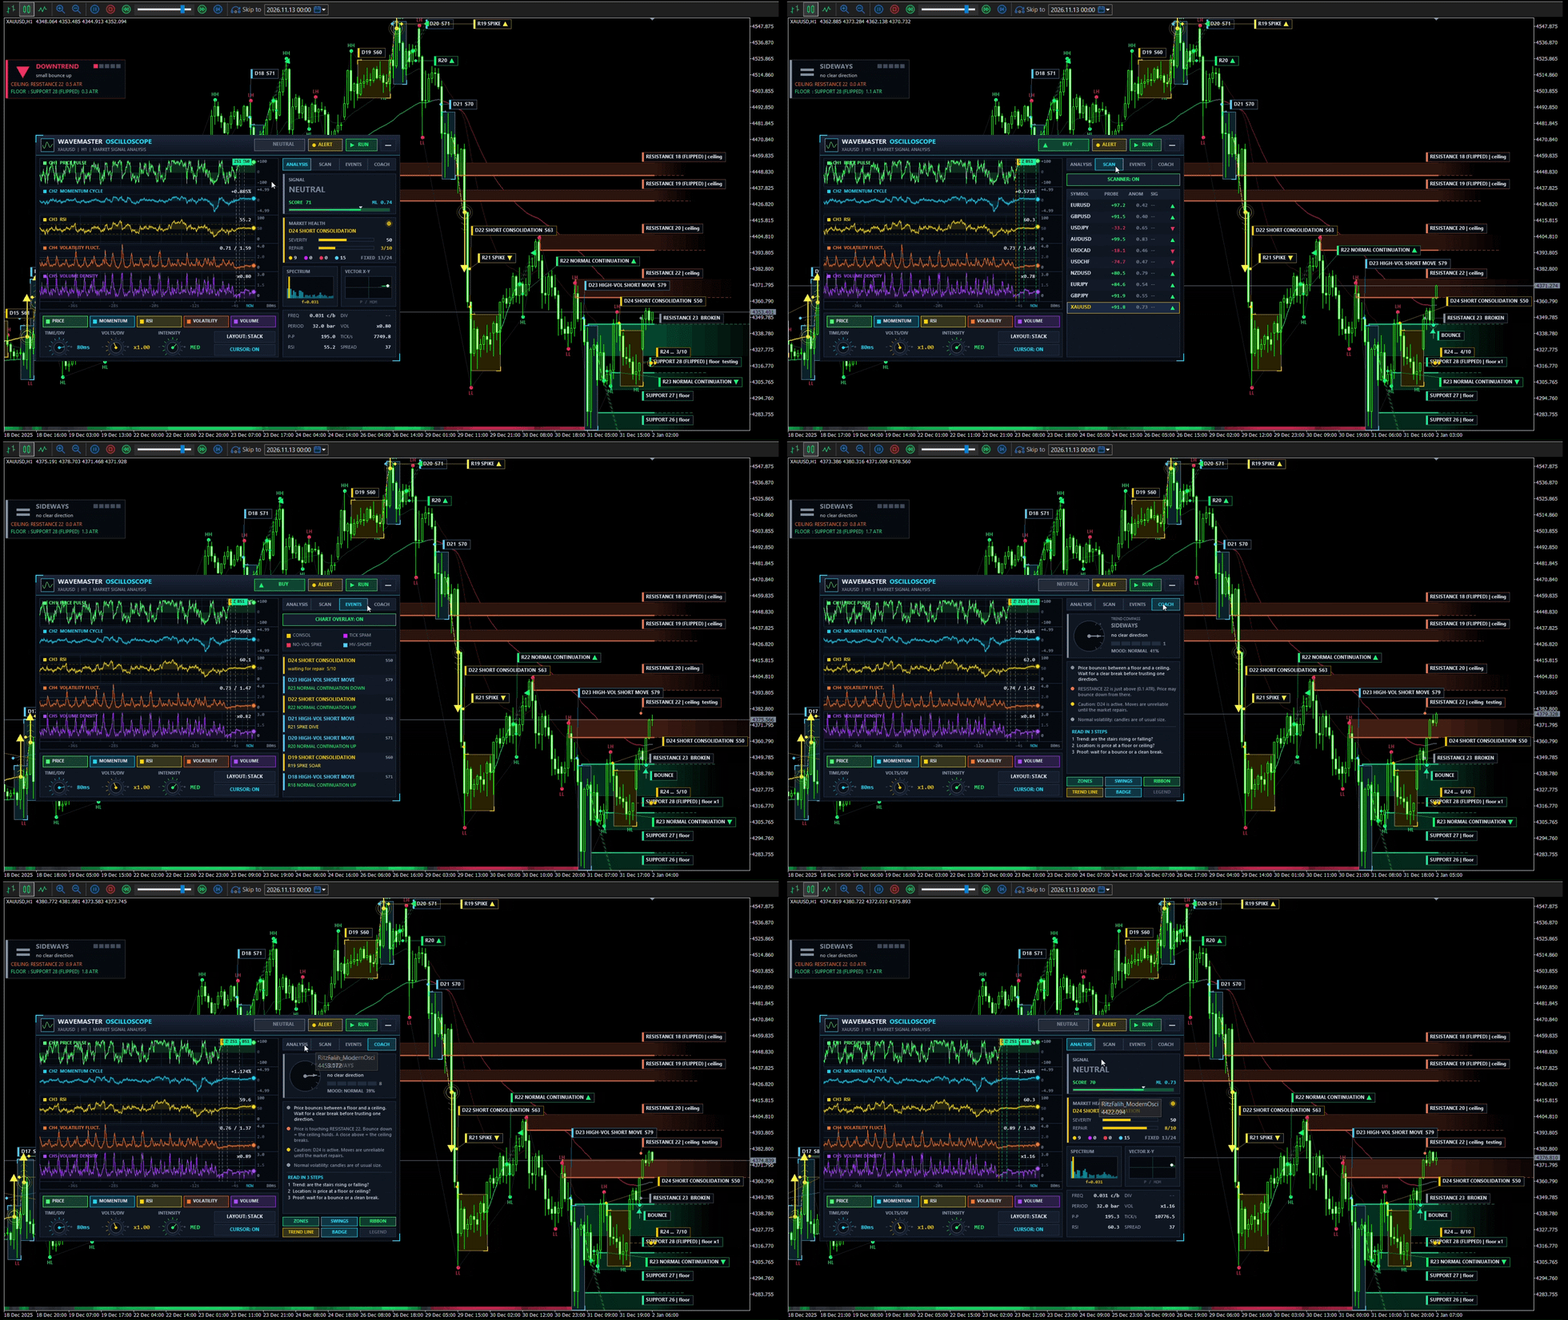
  • Oscilloscope dashboard (Canvas). A movable, minimizable panel with rotary controls (time/div, volts/div, intensity), a phosphor-style waveform, spectrum analyzer, XY vector scope and a market-health card. Four tabs: ANALYSIS, SCANNER, EVENTS and COACH.
  • Price damage detector. Finds four kinds of abnormal price behavior: short consolidation, tick-volume spam, volume-less spike and high-volatility short move. Each event gets a name (D01, D02...) and a severity score from 0 to 100.
  • Repair tracking. After a damage, the indicator waits for the market to recover and labels the outcome on the chart: normal continuation (up or down), spike soar or dive, unresolved, or chained to a new damage.
  • Rebound zones. Support and resistance zones are created from repaired damage and from strong swing pivots. Overlapping zones merge. A broken zone can flip its role (support becomes resistance and the reverse). Zones that price has left for too long expire and are no longer drawn.
  • Bounce and break alerts. Each zone is tracked as ACTIVE, TESTING, BROKEN or EXPIRED, with notifications for a new zone, a bounce and a break.
  • Trend and structure tools. Trend EMA line colored by direction, trend ribbon along the bottom of the chart, a trend badge, and HH / HL / LH / LL swing labels.
  • Beginner coach. A plain-language COACH tab and chart hints explain what the market is doing now and what the colors and labels mean.
  • Signal engine. Combines close position in the bar range, momentum, RSI limit, repair confirmation and zone-bounce confirmation. Optional filters: machine learning agreement, signal score, trend filter and a damage gate that mutes signals while a damage is unrepaired.
  • Extra analytics. Anomaly detection with an adaptive threshold, divergence detection, FFT spectrum, an onboard machine-learning model that can save and reload its weights, and a weighted signal score.
  • Multi-symbol scanner. Scans the symbols you list (ten major pairs and gold by default) and can resolve broker-specific symbol names automatically.
  • Smart label placement. Labels search for free space so they do not cover candles, use leader lines when needed, and shorten older events to a compact tag.
  • Display options. English and Indonesian labels, automatic DPI detection with manual scale, adjustable text size, and two scope layouts (stacked lanes or overlay).

How to read the chart

The overlay is built so a beginner can learn from it and an experienced trader can scan it in seconds.

On the chart

What it means

D01, D02... (labeled box or bar)

A price damage: the market behaved abnormally here. The name shows the type and a severity score (S).

R01, R02... with an up or down arrow

The repair: price recovered from damage D01, D02... and the arrow shows the direction it continued.

SPIKE tag

The repair came as a sharp impulse instead of a calm continuation.

Green band labeled SUPPORT

A rebound zone below price where buyers reacted before. Price may bounce here again.

Orange or red band labeled RESISTANCE

A rebound zone above price where sellers reacted before.

BOUNCE tag

Price reacted from a zone and moved away from it.

Zone marked testing or x2

Price is touching the zone now, or the zone has already been confirmed twice.

HH, HL, LH, LL

Higher high, higher low, lower high, lower low. Rising HH and HL mean an uptrend; falling LH and LL mean a downtrend.

Trend line, ribbon and badge

The trend direction and strength, colored so you can read it at a glance.

Compass and COACH tab

A short plain-language explanation of what the market is doing and what to watch next.

A good habit for learning: when a damage appears, wait for its repair, then look at the nearest zone. Over time you start to see how the market breaks, recovers and reacts at the same levels.

Signals, alerts and EA integration

Signals are built from several layers, so you can tighten or relax them to match your style: close position inside the bar range, a momentum check, an RSI limit, repair confirmation, zone-bounce confirmation, and optional machine-learning, score and trend filters. A confirmation window keeps a repair or bounce valid for a few bars. Damage, repair and zone events are evaluated on closed bars; the live dashboard reading updates on every tick.

Alerts. Popup, sound, push notification and email, with separate switches for damage, repair and zone events (new zone, bounce, break) and for anomaly alerts.

EA-ready buffers. The indicator exports 21 data buffers. Read them from your Expert Advisor with iCustom and CopyBuffer . The most useful ones:

Buffer

Content

0

Probe: close position inside the bar range (%)

7

Machine-learning probability

9

Signal score

11

Signal: +1 BUY, -1 SELL, 0 none

13

Damage type on affected bars

14

Repair marker (sign gives the direction)

15

Signal quality (0 to 100)

16

Trend direction

17

Trend strength

18

Nearest support price

19

Nearest resistance price

20

Zone bounce marker

The indicator draws everything with Canvas, so the buffers carry data only and add no extra lines to the chart.

Settings and requirements

Every parameter has a sensible default, so the indicator works as soon as you attach it. Inputs are grouped by purpose:

Group

What it controls

Oscilloscope Logic, Adaptive Threshold

Calculation period, anomaly threshold and smoothing, history depth

Signal Engine

Probe level, momentum and RSI filters, ML and score filters, damage gate, repair and zone boosts, trend filter

Price Damage Detector, Repair Detector

Sensitivity of each of the four damage types and the rules for a valid repair

Rebound Zones

Zone sources, maximum active zones, expiry, bounce and break distances, swing depth, trend EMAs

Beginner Visuals, Damage On Chart

Show or hide zones, swing labels, ribbon, trend line, badge and event labels

Dashboard

Language (English or Indonesian), position, minimized start, layout, glow, DPI scale, text size

Machine Learning, Signal Score, Scanner

Learning rate, weights, saved model, scanner symbols and refresh rate

Alerts

Popup, sound, push and email

Requirements

  • MetaTrader 5, any symbol and any timeframe.
  • Runs in the main chart window. It uses no DLL.
  • Detection uses tick volume, which every broker provides.
  • If the machine-learning option is on, the model weights are saved to a small file in the terminal data folder.
  • A chart-tweaks option can hide the grid and native volume for a cleaner look. You can turn it off.
  • Push notifications and email require setup in the terminal options.

Quick start

  1. Attach the indicator to a chart. The dashboard appears at the top left; drag it anywhere.
  2. Open the COACH tab for a plain-language reading of the current market.
  3. Follow one cycle on the chart: a damage (D), its repair (R), then the nearest zone.
  4. Set your alerts and, if you use an EA, read the signal and zone buffers.

Risk notice. Trading involves risk. WaveMaster Oscilloscope is an analysis tool and does not guarantee any result. Test it on a demo account and on your own symbols and timeframes before using it with real money.
Altri dall’autore
Moving Average Ribbon
Syamsurizal Dimjati
5 (2)
MOVING AVERAGE RIBBON Ritz MA Ribbon Dynamics – The Next-Gen Trend Visualizer Ritz MA Ribbon Dynamics is a futuristic multi-layer Moving Average system engineered to visualize trend momentum, volatility balance, and market rhythm in one adaptive ribbon. Designed for modern traders who demand clarity, flexibility, and automation — this tool transforms the classic MA visualization into a dynamic analytical framework. Core Concept The indicator creates a multi-tier MA Ribbon that adapts to the cho
FREE
Kaufmans AMA Candle
Syamsurizal Dimjati
5 (1)
RITZ Candle Kaufman’s AMA is a precision market-flow indicator built around Kaufman’s Adaptive Moving Average (KAMA / AMA) — a dynamic smoothing algorithm that automatically adjusts to changing volatility. This enhanced version interprets AMA momentum directly into smart candle-color signals , giving traders a clean, noise-filtered view of trend strength and directional bias. Where most indicators repaint or react too slowly, RITZ Candle AMA delivers stable, non-repainting color shifts based on
FREE
Fibo Pivot Optimus
Syamsurizal Dimjati
5 (1)
Ritz Smart FIBOPIVOT Optimus Pro Advanced Multi-Timeframe Fibonacci Trading System SMART PREDICTION & ACCURATE FORECAST Revolutionary Fibonacci Pivot Technology combines traditional pivot points with advanced Fibonacci extensions, creating a powerful predictive tool for professional traders. Our algorithm intelligently detects significant price levels across multiple timeframes, delivering laser-accurate support and resistance zones before the market moves . INTELLIGENT VOLUME-VALIDATED SIGNALS
FREE
RITZ QUANTUM PULSE Next-Generation Economic Intelligence System Ritz Quantum Pulse — Next-Gen Economic Intelligence System. Experience quantum-level precision in news trading: real-time event detection, AI-powered filtering, and temporal synchronization. Anticipate volatility before it happens — not after. Where Market Intelligence meets Temporal Physics. Ritz Quantum Pulse   represents the convergence of   quantum logic ,   AI-driven analytics , and   real-time economic intelligence . This is
FREE
Smart Finder Order Block The Ritz Smart Finder Order Block is a next-generation market structure recognition tool, designed to intelligently detect and highlight institutional footprints within price action. Built on a dynamic blend of order block theory, consolidation tracking, and adaptive volatility modeling, it provides traders with a sophisticated lens to anticipate high-probability market reactions. Core Capabilities Smart Order Block Detection Identifies both Bullish and Bearish Order Blo
FREE
Manual Trading Helper
Syamsurizal Dimjati
Manual Trade Helper is an MT5 Expert Advisor designed as an automated assistant for managing manually opened trades. This EA does not open trades on its own, but instead enhances manual trading by automatically managing risk and position settings. Remote Management via VPS + Mobile Devices When deployed on a Virtual Private Server (VPS), the RitzEAneha Manual Trade Helper allows traders to seamlessly manage their trades from anywhere using just a smartphone or tablet. Since the EA runs 24/7 on t
FREE
ZIGZAG and FRACTAL CANDLE PRO ( Only candles, No RSI strength panel) " Suitable for QQE RITZ " > Check My Product is an advanced market structure visualization system built for precision trend detection, powered by dynamic fractal logic and adaptive swing validation. It seamlessly identifies Higher Highs (HH), Lower Lows (LL), and key structural shifts — allowing traders to read the true rhythm of market transitions with institutional clarity. This system combines   ZigZag precision ,   fractal
FREE
PIVOT eXtreme
Syamsurizal Dimjati
Pivot eXtreme Pivot adalah level referensi penting yang digunakan trader untuk memetakan potensi support & resistance intraday maupun jangka lebih panjang. Dalam sistem ini, level pivot dikembangkan menjadi P (Pivot Point utama) , R1–R13 (Resistance) , serta S1–S13 (Support) . Pivot Point (P) Titik pusat utama, dihitung dari rata-rata harga (High + Low + Close) / 3 . Berfungsi sebagai acuan keseimbangan harga : Jika harga di atas P → tren cenderung bullish. Jika harga di bawah P → tren cenderung
FREE
BUYER or SELLER
Syamsurizal Dimjati
BUY or SELL FlashScalp Multi-System Indicator The FlashScalp Multi-System Indicator is a next-generation trading tool engineered for precision scalpers, intraday strategists, and professional analysts who demand both speed and clarity in market visualization. It seamlessly integrates smart candle-based analytics, adaptive ATR logic, and real-time economic event awareness — giving you a fully synchronized view of market volatility and momentum. Through an elegant and optimized interface, FlashSc
Resonance Eco1
Syamsurizal Dimjati
RESONANCE SIGNAL (MULTI-FACTOR CONFIRMATION) Resonance Signal Detection is a multi-layer confirmation engine that identifies high-quality trading signals when multiple technical factors align within a short price window. This module combines: RSI overbought / oversold interaction Volume behavior relative to its moving average ATR expansion and compression analysis Wick rejection strength (price rejection power) Breakout candle validation (body ratio & ATR multiplier) Stochastic fast crossing for
Fibo Price Action
Syamsurizal Dimjati
FIBO PRICE ACTION This indicator is a Smart OHLC–based Market Analysis and Fibonacci Zone system designed to combine visual clarity, adaptive market structure analysis, and volatility-aware strength detection into a single professional trading tool. Key Features Advanced Visual Themes Supports multiple candle and UI themes (Classic, Ocean, Forest, Gold, Neon, etc.) to adapt the chart appearance to different trading styles and preferences. Smart Fibonacci Zones Fibonacci zones can be calculate
Ritz Smart Support & Resistance Zones Market Structure Based S/RT his advanced indicator detects and displays high-probability support and resistance zones based on actual market structure (swing highs and lows). Using intelligent zone merging and ATR-based fuzz buffers, it ensures the zone blocks are aligned with real price extremes without gaps. Zones are classified by strength (Proven, Verified, Untested, Turncoat, Weak) and visually rendered using colored rectangles. Ideal for traders seeki
Smart Swing HH - LL Indikator ini dirancang untuk mendeteksi Swing High (HH) dan Swing Low (LL) secara cepat dan akurat pada grafik harga. Deteksi dilakukan berdasarkan analisa range ATR adaptif, konfirmasi pola candlestick (seperti pin bar dan engulfing), serta opsi tambahan menggunakan Fractal untuk validasi. Fitur utama: Deteksi otomatis titik Swing High dan Swing Low menggunakan ATR dan price action. Penyesuaian sensitivitas deteksi berdasarkan ATR multiplier dan range bar . Notifikasi real-
Detect Trend and Consolidation :  Push Notif for Mobile Trading  Overview Push Notif for Mobile Trading: Detect Trend and Consolidation is a custom MetaTrader 5 (MT5) indicator developed by Ritz_EANEHA that intelligently detects whether the market is in a trend (bullish/bearish) or in consolidation (sideways) . It uses a proprietary comparison of Standard Deviation (StdDev) and Average True Range (ATR) to assess volatility and market structure, and sends mobile push notifications to alert trade
FREE
RITZ SMART TREND ADAPTIVE FINDER Precision Trend Intelligence. Adaptive. Insightful. Real-Time. Ritz Smart Trend Adaptive Finder is an advanced market intelligence indicator engineered to detect and adapt to evolving market structures with dynamic precision. It automatically calibrates its analytical period based on real-time volatility, price momentum, and correlation strength — delivering true adaptive trend detection rather than static or lagging signals. By combining Pearson correlation , sl
FREE
Ritz Smart Trend Adaptive Finder – Auto-Detect Dynamic Trend Channels A powerful trend detection indicator that adaptively analyzes price structure using dynamic ATR and statistical filters to discover the most significant trend channels on any timeframe and symbol. This tool automatically finds the most relevant period and slope for price movement and draws upper/lower channel zones, midline (mean), and trend support/resistance. Suitable for trend-following, breakout, and mean-reversion strateg
FREE
Dxy Vs Market
Syamsurizal Dimjati
USD STRENGHT VERSUS MARKET USD (DXY) Versus Market Panel is a professional visual indicator designed to analyze US Dollar strength and pressure against major trading symbols in real time. The indicator compares USD performance (based on DXY logic or internal strength calculation) versus selected symbols, allowing traders to quickly identify dominant currency flow, relative strength, and market bias from a single panel view. Built with a clean, lightweight, and non-intrusive panel , this tool hel
FREE
Conspiracy 16
Syamsurizal Dimjati
3 (1)
Ritz Conspiracy 16 – Multi-Layer Market Intelligence System Ritz Conspiracy 16 adalah indikator analisis pasar multi-layer yang menggabungkan 16 indikator teknikal utama ke dalam satu panel visual terpadu. Dirancang dengan konsep market intelligence , indikator ini bekerja seperti pusat komando yang membaca perilaku pasar dari berbagai sudut: trend, volatilitas, momentum, volume, hingga struktur harga. Dengan pendekatan “konspiratif”, indikator ini menghubungkan jejak kecil dari 16 algoritma unt
FREE
RUHM Reborn
Syamsurizal Dimjati
RUHM REBORN for Micro Account / Cent Account XAUUSD - GOLD (Note: The grid-based system carries high risk during long trends without retrace. Use appropriate capital and understand the risks involved.) RUHM REBORN is a Grid-based Expert Advisor (EA) with ATR Entry developed to provide consistent, stable, and adaptive trading results on the XAUUSD (Gold) pair. This EA is specifically designed for USD Cent accounts, allowing it to run with relatively affordable capital while maintaining stability
Moving Average Sentiment "Transform Raw Market Data into Clear Sentiment Vision" Moving Average Sentiment is a next-generation adaptive trend sentiment indicator that visualizes the true bias of the market — bullish, bearish, or neutral — in real time. It combines Moving Average dynamics with ATR-based volatility zones , creating a fluid, self-adjusting sentiment curve that reacts instantly to price structure and volatility shifts. This tool goes beyond a simple MA — it reads the behavior of th
FREE
MultiTimeframe Info Feed (MIF) Indicator Description: MultiTimeframe Info Feed (MIF) is a smart MQL5 indicator that displays a dynamic, real-time info panel directly on your chart, offering powerful insight into current market conditions. Key features include: Real-time display of Open, High, Low, Close, and live Tick price Tick Rate (ticks per second) for assessing market activity Auto-calculated Entry Price on new candle formation Signal direction detection (BUY / SELL) Price action pattern re
FREE
Ritz_BUYnSELL_Detection The Ritz_BUYnSELL_Detection is a custom MetaTrader 5 (MT5) indicator that detects BUY and SELL trading signals based on trend detection and ATR-based volatility filtering. It provides visual arrows , entry alerts , and mobile push notifications , making it suitable for traders using a VPS setup for 24/7 signal monitoring. How to Use the Indicator Install on MT5 : Place the .mq5 file in the MQL5/Indicators folder. Compile it in MetaEditor, then apply it to any chart. A
FREE
Push Notif for Mobile Trading (Now you can trade perfectly through notifications to your Mobile Gadget, with Signals that you can adjust to your trading style, Use VPS to activate real time trading) Description Push Notif for Mobile Trading is a custom MetaTrader 5 (MT5) indicator designed to send mobile push notifications to traders when certain price or indicator-based conditions are met. This allows traders to monitor markets remotely and act quickly, even when not at their trading terminal.
FREE
RitzEAnehaGoodWill
Syamsurizal Dimjati
READ THIS !! to the end Expert Advisor Description:   XAUUSD Reversal Pattern EA (EAneha GoodWill) Important Note: No martingale, averaging or grid Highly dependent on execution quality & low spreads XAUUSD Reversal Pattern EA  is an advanced automated trading robot developed specifically for trading  XAUUSD  (Gold vs USD) on the  M30 timeframe . It uses a robust combination of  candlestick patterns ,  volatility/volume indicators , and  oscillator filters  to identify high-probability reversal
Support & Resistance Zone Indicator This indicator dynamically identifies and draws support and resistance zones based on recent price action and fractal patterns. By analyzing ZigZag pivot points and tracking price reactions (touches, bounces, and breaks), the indicator determines the strength and validity of each zone. Key Features: Multi-Timeframe Support: Can work across different timeframes. Fractal-Based Detection: Utilizes both fast and slow fractal detection to find significant swing po
indikator Visual Panel Strengt MultiTimeframe : English Description Visual Panel Strength MultiTimeframe is a real-time trend strength indicator panel that displays the buy/sell pressure across multiple selected timeframes—such as M1, M3, and M5. The indicator utilizes ATR-based volatility analysis and a smoothed trend algorithm to calculate trend signals. Visually presented as a horizontal bar chart at the corner of your main chart, this tool helps traders instantly identify the prevailing
ScalpReactor X
Syamsurizal Dimjati
ScalpReactor X A Tactical Indicator for Precision Traders The Ritz Scalping Habbit is a powerful MT5 indicator designed to help traders execute disciplined, high-probability trades through clear visual cues and multi-strategy confirmations. Whether you’re an intraday scalper or a swing trader , this tool integrates advanced market analysis into a single, easy-to-use interface. Key Strengths: Smart Buy & Sell Arrows — Based on multi-layer signals from RSI, ATR, EMA, ADX, and price momentum. Colo
Quantum RefleX
Syamsurizal Dimjati
Quantum Reflex Kuantum Reflex is a momentum-based oscillator indicator designed to deliver fast, accurate, and adaptive market insights. Built for real-time trading environments, it enables traders to spot rapid trend reversals, identify overbought/oversold levels, and combine short-term cross signals with higher-timeframe trend confirmation. Key Features Visual Cross Detection → Detects BUY/SELL signals from %K/%D crossover with instant updates for fast reversals. Dynamic Zone Highlight → Autom
Scalping Flash X
Syamsurizal Dimjati
SCALPFLASH-X Where Fibonacci Precision Meets RSI Intelligence. Next-gen trading system combining Adaptive Fibonacci Pivots, RSI Heat Mapping, and Smart Candle Analytics. Detect market dominance, momentum shifts, and reversal zones in real time across multiple timeframes. Institutional accuracy, retail simplicity — built for speed, clarity, and precision. Advanced Multi-Timeframe Fibonacci & RSI-Driven Market Intelligence System ScalpFlash-X — A next-generation trading system combining Fibonacc
Buy Sell Smart
Syamsurizal Dimjati
BUY and SELL smart The BUY and SELL Smart Indicator is a next-generation trading tool engineered for precision scalpers, intraday strategists, and professional analysts who demand both speed and clarity in market visualization. It seamlessly integrates smart candle-based analytics, adaptive ATR logic, and real-time economic event awareness — giving you a fully synchronized view of market volatility and momentum. Through an elegant and optimized interface, FlashScalp delivers   instant signal fee
Filtro:
Nessuna recensione
Rispondi alla recensione