Wave Master Oscilloscope PRO
- インディケータ
- バージョン: 1.0
- アクティベーション: 5

WaveMaster Oscilloscope PRO
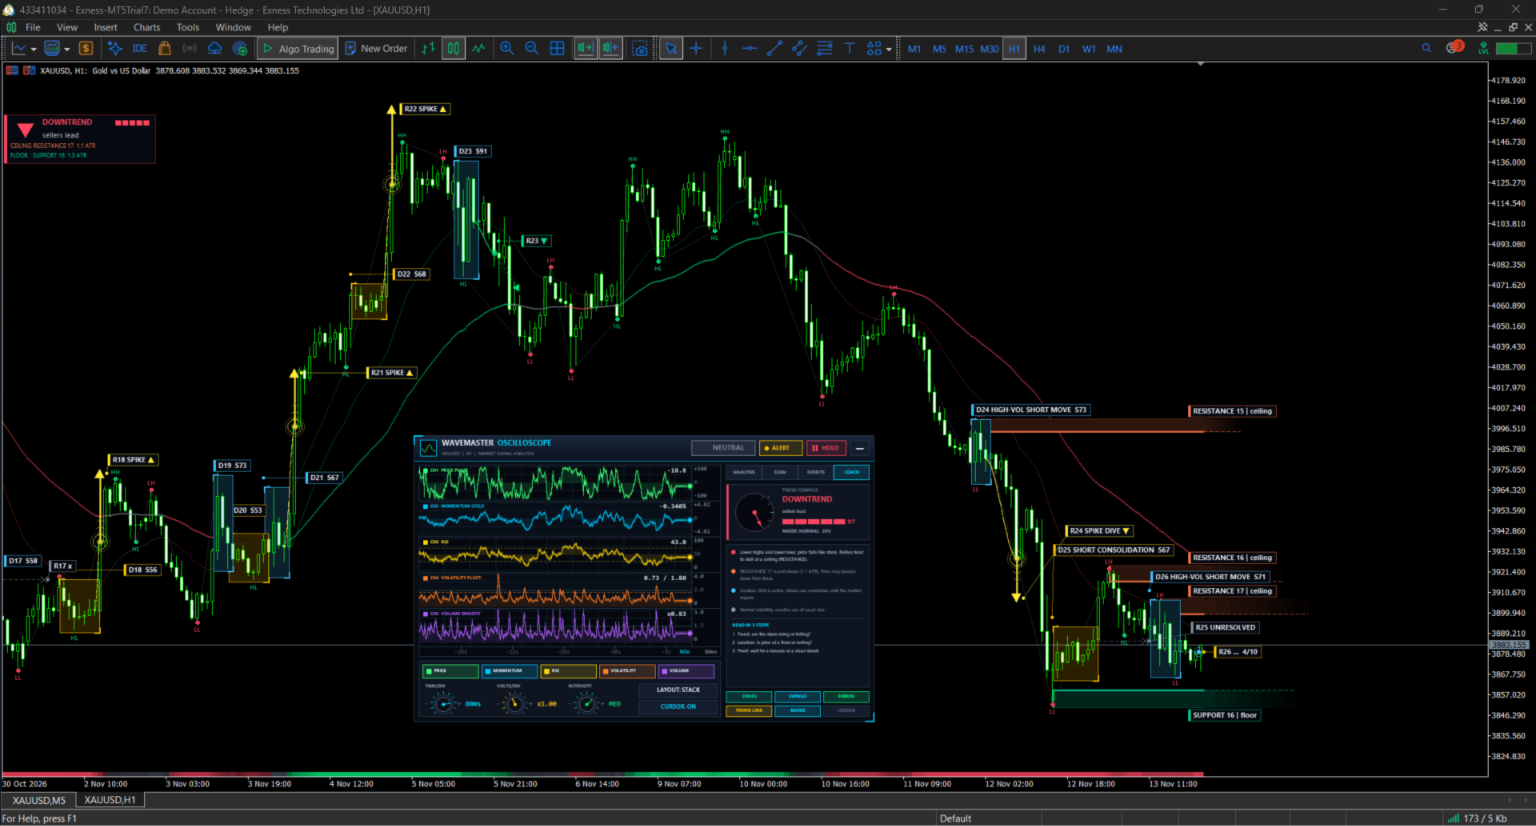
turns raw price action into an oscilloscope-style dashboard and a clear, self-explaining chart overlay: it finds where price was damaged, shows when it repaired, and marks the support and resistance zones that grow out of that repair.
Most indicators give you a line or an arrow and leave you to guess why. WaveMaster Oscilloscope PRO shows the reasoning. It watches for abnormal price behavior, names each event on the chart (D01, D02...), follows it until the market recovers (R01, R02...), and then draws the rebound zone where price is likely to react again.Everything is drawn on a professional Canvas dashboard that you can drag, minimize and scale, plus a clean overlay on the candles. Labels are placed so they stay readable without covering the candles. Beginners get plain-language trend and coaching hints; experienced traders get a full signal engine, EA-ready buffers, alerts and a multi-symbol scanner.
WaveMaster Oscilloscope is an analysis tool. It does not open, modify or close trades.
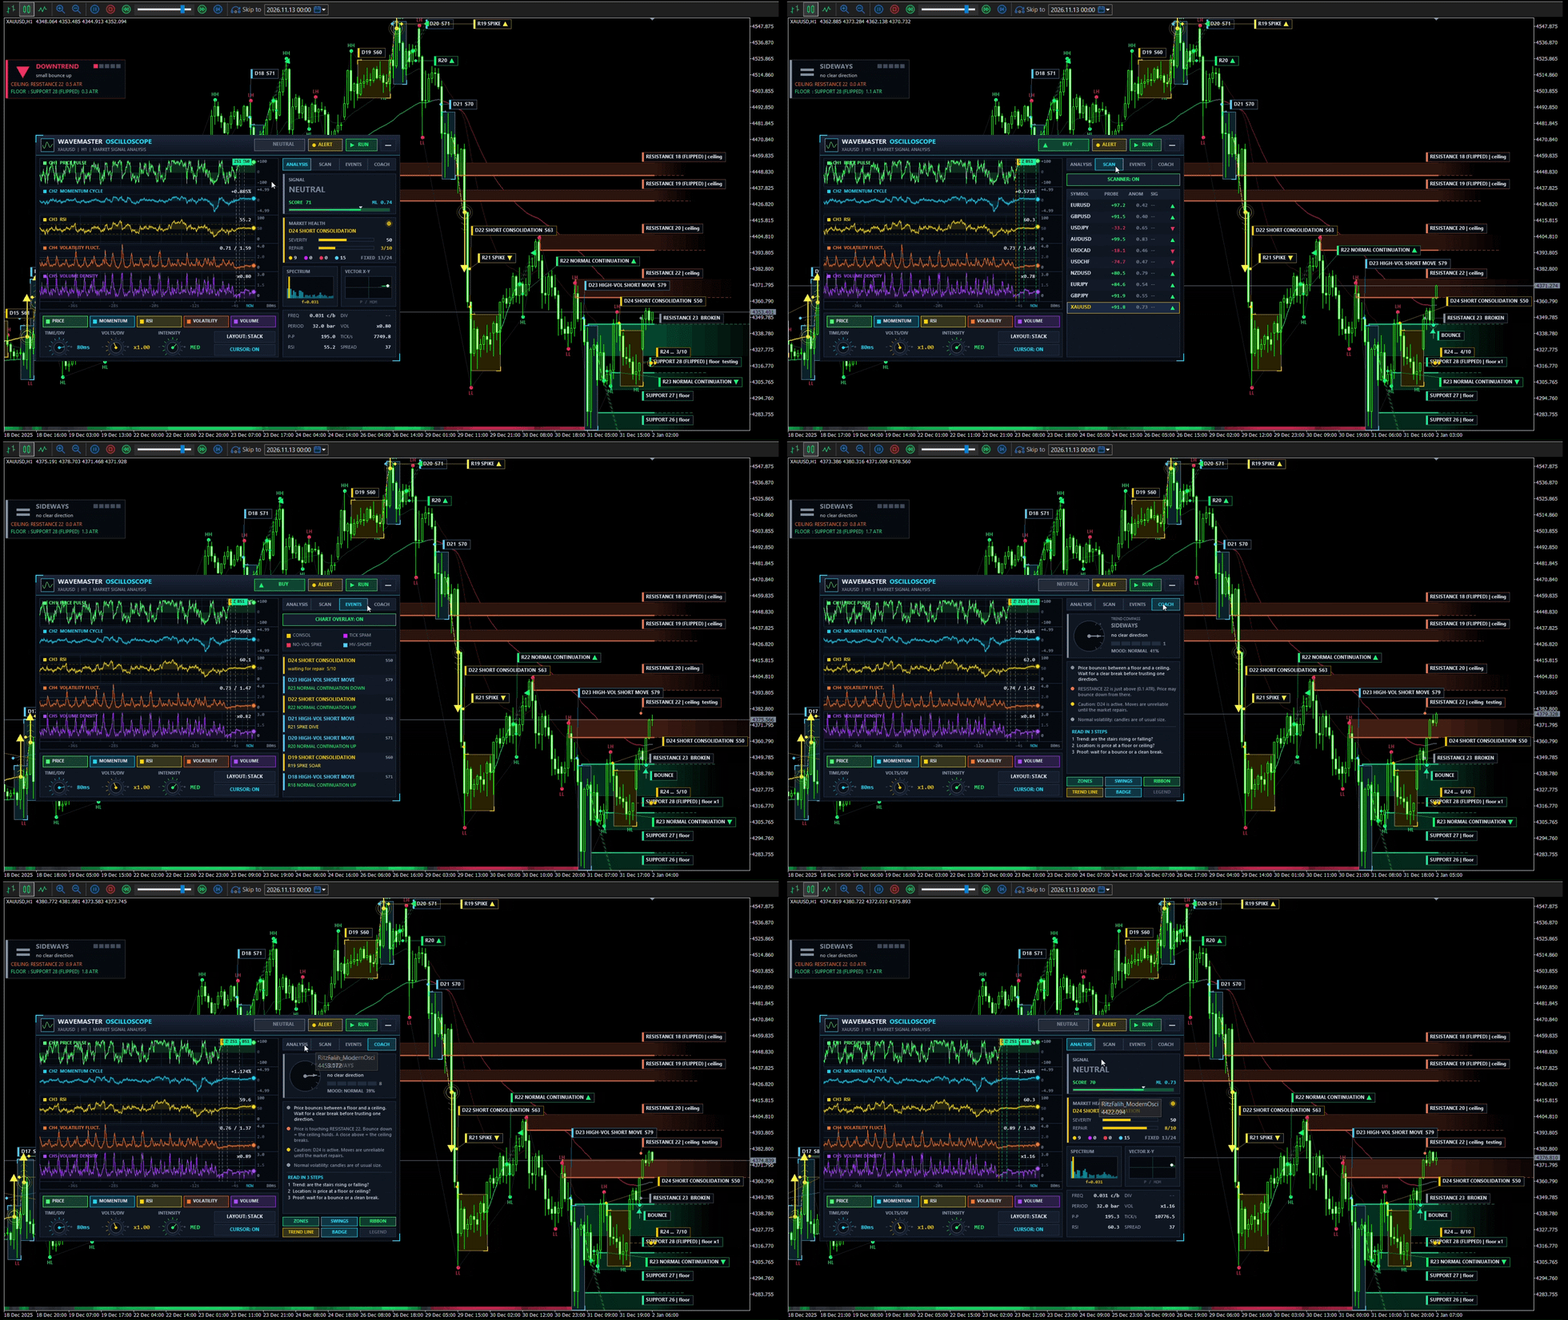
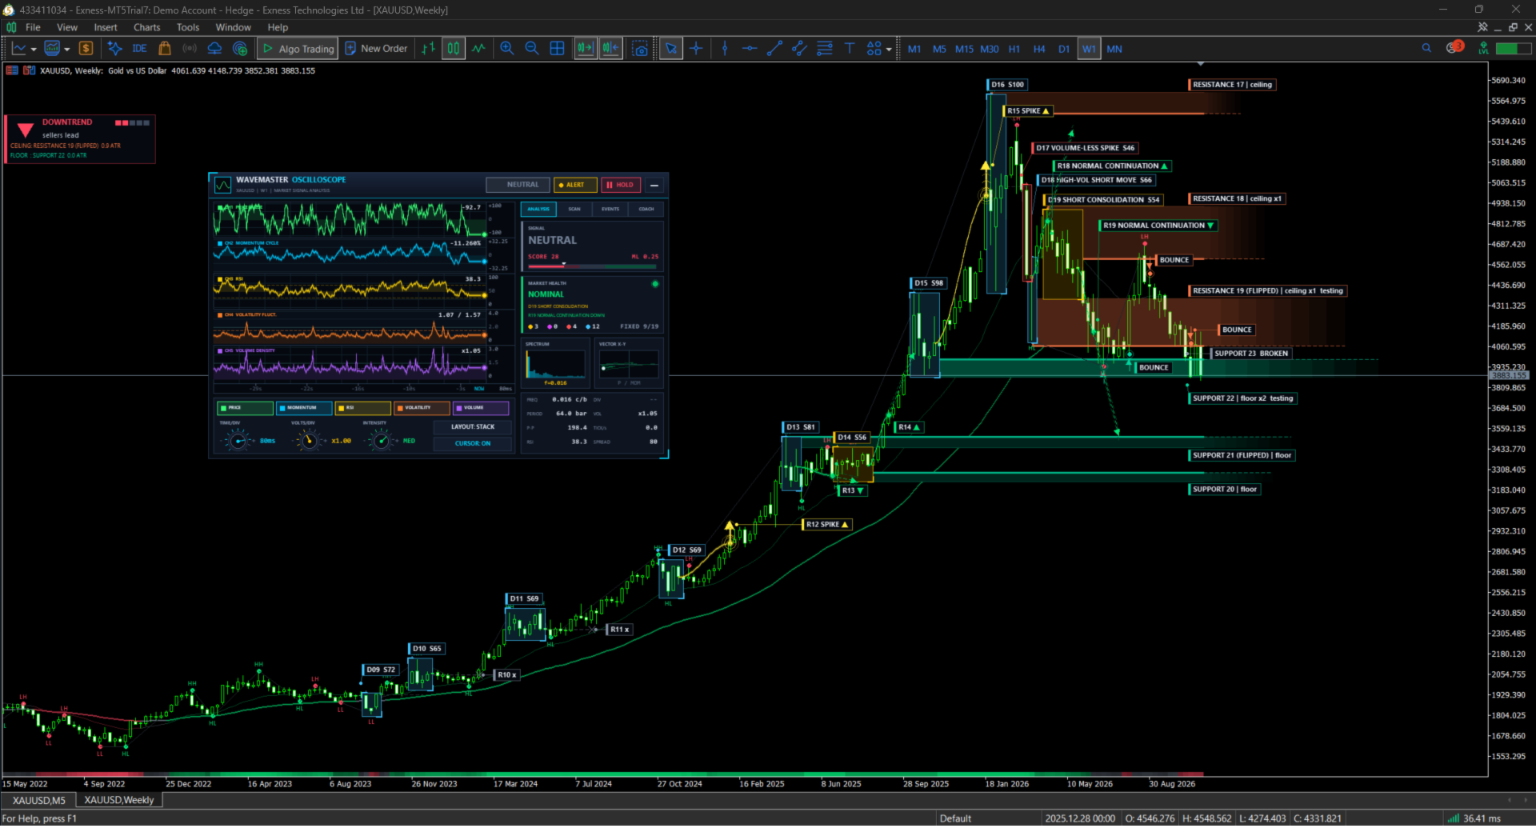
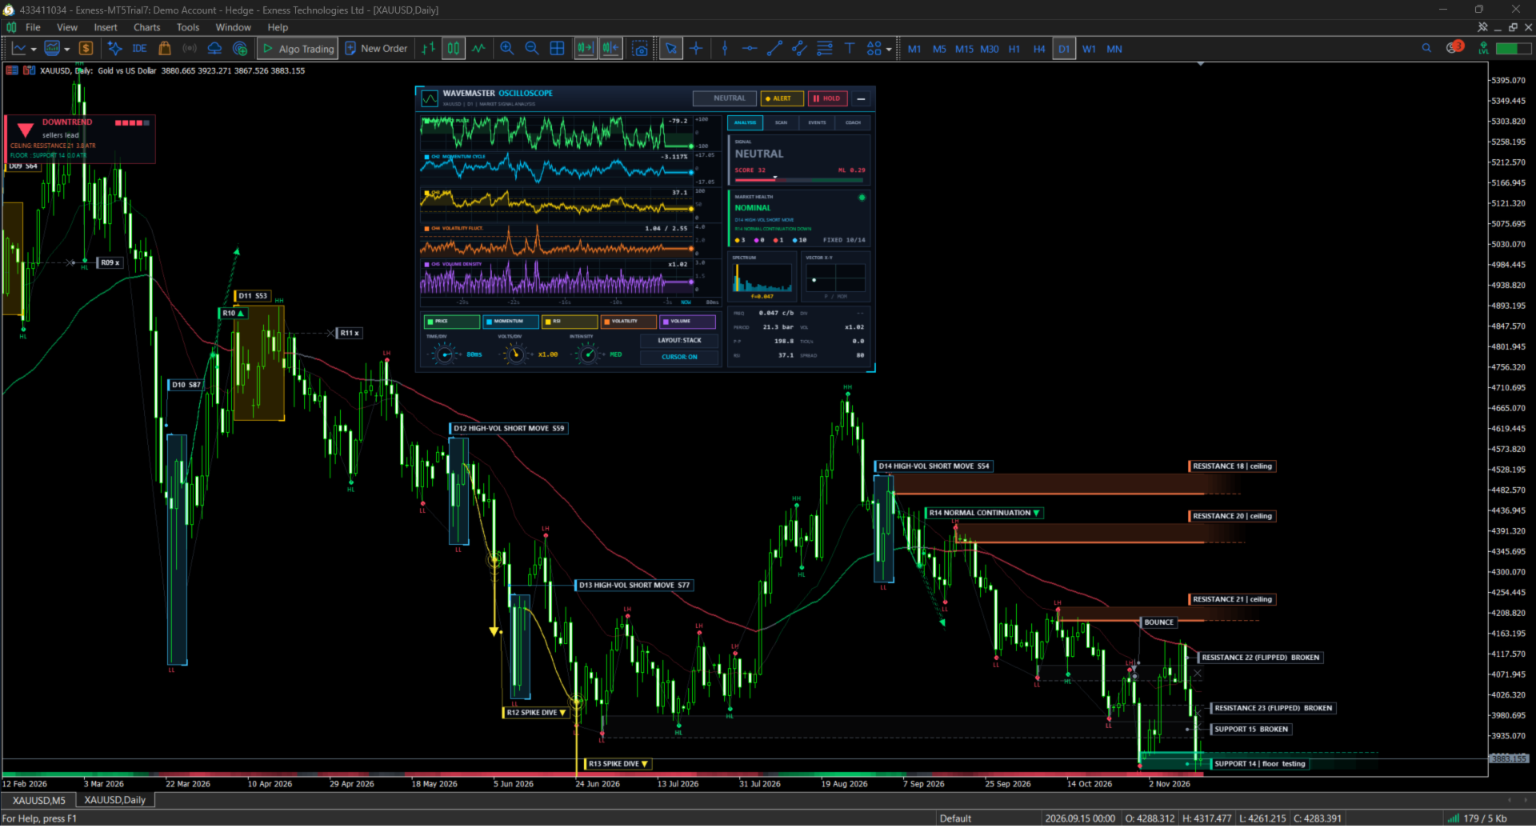
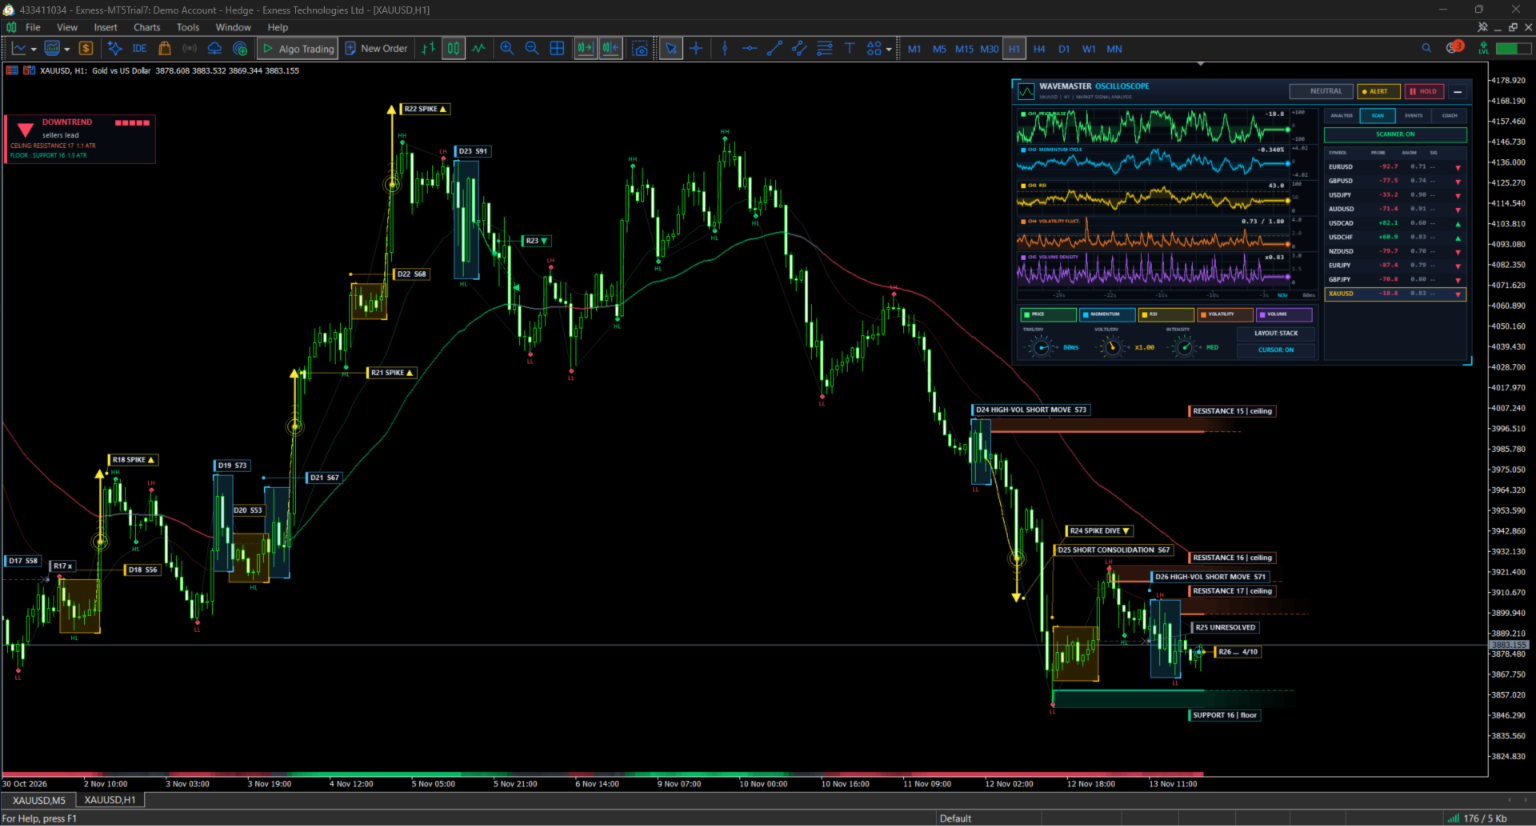
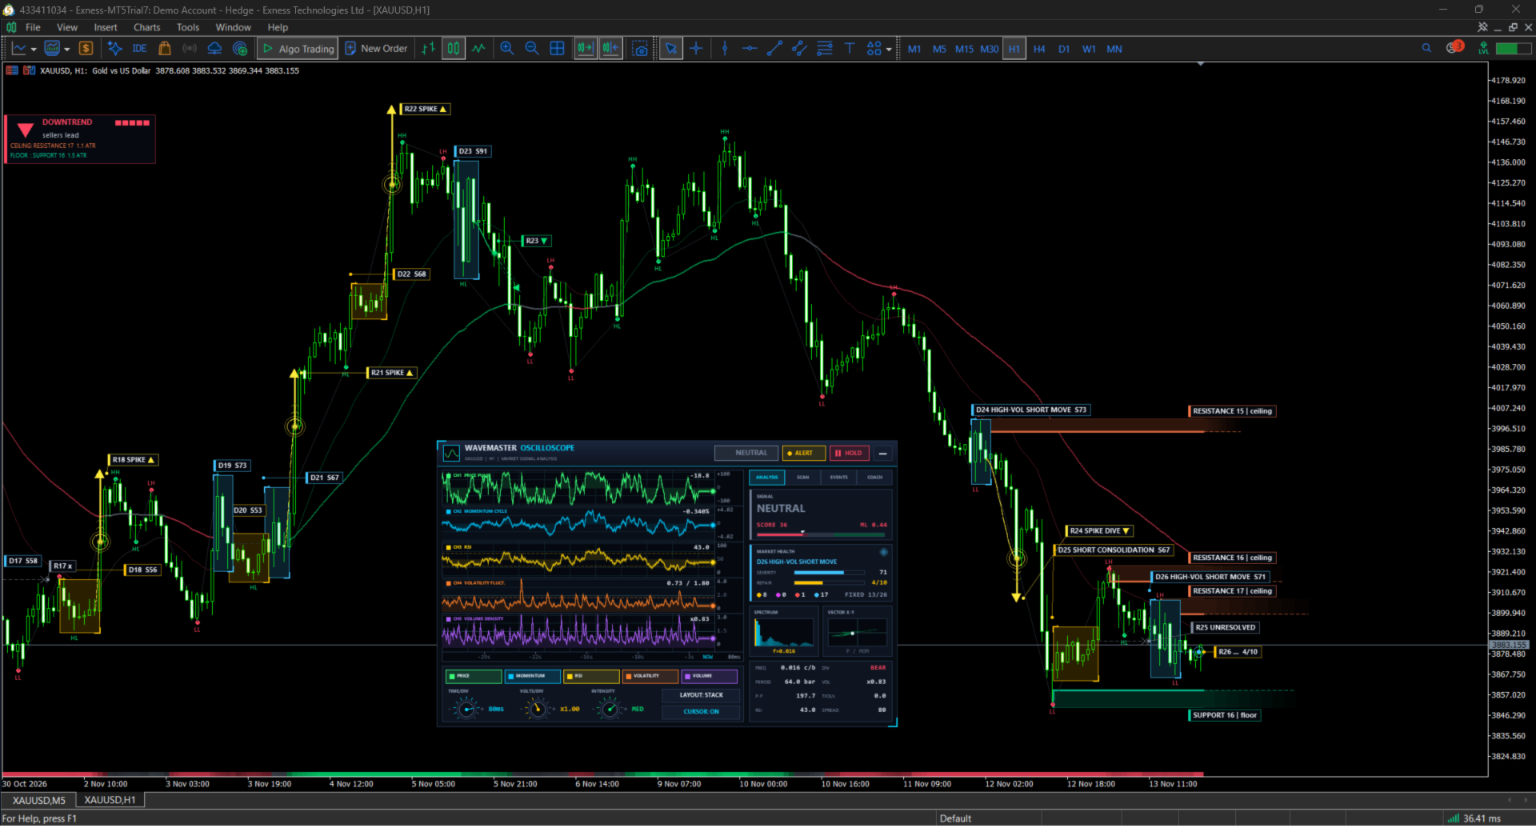
Key features- Oscilloscope dashboard (Canvas). A movable, minimizable panel with rotary controls (time/div, volts/div, intensity), a phosphor-style waveform, spectrum analyzer, XY vector scope and a market-health card. Four tabs: ANALYSIS, SCANNER, EVENTS and COACH.
- Price damage detector. Finds four kinds of abnormal price behavior: short consolidation, tick-volume spam, volume-less spike and high-volatility short move. Each event gets a name (D01, D02...) and a severity score from 0 to 100.
- Repair tracking. After a damage, the indicator waits for the market to recover and labels the outcome on the chart: normal continuation (up or down), spike soar or dive, unresolved, or chained to a new damage.
- Rebound zones. Support and resistance zones are created from repaired damage and from strong swing pivots. Overlapping zones merge. A broken zone can flip its role (support becomes resistance and the reverse). Zones that price has left for too long expire and are no longer drawn.
- Bounce and break alerts. Each zone is tracked as ACTIVE, TESTING, BROKEN or EXPIRED, with notifications for a new zone, a bounce and a break.
- Trend and structure tools. Trend EMA line colored by direction, trend ribbon along the bottom of the chart, a trend badge, and HH / HL / LH / LL swing labels.
- Beginner coach. A plain-language COACH tab and chart hints explain what the market is doing now and what the colors and labels mean.
- Signal engine. Combines close position in the bar range, momentum, RSI limit, repair confirmation and zone-bounce confirmation. Optional filters: machine learning agreement, signal score, trend filter and a damage gate that mutes signals while a damage is unrepaired.
- Extra analytics. Anomaly detection with an adaptive threshold, divergence detection, FFT spectrum, an onboard machine-learning model that can save and reload its weights, and a weighted signal score.
- Multi-symbol scanner. Scans the symbols you list (ten major pairs and gold by default) and can resolve broker-specific symbol names automatically.
- Smart label placement. Labels search for free space so they do not cover candles, use leader lines when needed, and shorten older events to a compact tag.
- Display options. English and Indonesian labels, automatic DPI detection with manual scale, adjustable text size, and two scope layouts (stacked lanes or overlay).
How to read the chart
The overlay is built so a beginner can learn from it and an experienced trader can scan it in seconds.
| On the chart | What it means |
|---|---|
| D01, D02... (labeled box or bar) | A price damage: the market behaved abnormally here. The name shows the type and a severity score (S). |
| R01, R02... with an up or down arrow | The repair: price recovered from damage D01, D02... and the arrow shows the direction it continued. |
| SPIKE tag | The repair came as a sharp impulse instead of a calm continuation. |
| Green band labeled SUPPORT | A rebound zone below price where buyers reacted before. Price may bounce here again. |
| Orange or red band labeled RESISTANCE | A rebound zone above price where sellers reacted before. |
| BOUNCE tag | Price reacted from a zone and moved away from it. |
| Zone marked testing or x2 | Price is touching the zone now, or the zone has already been confirmed twice. |
| HH, HL, LH, LL | Higher high, higher low, lower high, lower low. Rising HH and HL mean an uptrend; falling LH and LL mean a downtrend. |
| Trend line, ribbon and badge | The trend direction and strength, colored so you can read it at a glance. |
| Compass and COACH tab | A short plain-language explanation of what the market is doing and what to watch next. |
A good habit for learning: when a damage appears, wait for its repair, then look at the nearest zone. Over time you start to see how the market breaks, recovers and reacts at the same levels.
Signals, alerts and EA integrationSignals are built from several layers, so you can tighten or relax them to match your style: close position inside the bar range, a momentum check, an RSI limit, repair confirmation, zone-bounce confirmation, and optional machine-learning, score and trend filters. A confirmation window keeps a repair or bounce valid for a few bars. Damage, repair and zone events are evaluated on closed bars; the live dashboard reading updates on every tick.
Alerts. Popup, sound, push notification and email, with separate switches for damage, repair and zone events (new zone, bounce, break) and for anomaly alerts.
EA-ready buffers. The indicator exports 21 data buffers. Read them from your Expert Advisor with iCustom and CopyBuffer . The most useful ones:
| Buffer | Content |
|---|---|
| 0 | Probe: close position inside the bar range (%) |
| 7 | Machine-learning probability |
| 9 | Signal score |
| 11 | Signal: +1 BUY, -1 SELL, 0 none |
| 13 | Damage type on affected bars |
| 14 | Repair marker (sign gives the direction) |
| 15 | Signal quality (0 to 100) |
| 16 | Trend direction |
| 17 | Trend strength |
| 18 | Nearest support price |
| 19 | Nearest resistance price |
| 20 | Zone bounce marker |
The indicator draws everything with Canvas, so the buffers carry data only and add no extra lines to the chart.
Settings and requirements
Every parameter has a sensible default, so the indicator works as soon as you attach it. Inputs are grouped by purpose:
| Group | What it controls |
|---|---|
| Oscilloscope Logic, Adaptive Threshold | Calculation period, anomaly threshold and smoothing, history depth |
| Signal Engine | Probe level, momentum and RSI filters, ML and score filters, damage gate, repair and zone boosts, trend filter |
| Price Damage Detector, Repair Detector | Sensitivity of each of the four damage types and the rules for a valid repair |
| Rebound Zones | Zone sources, maximum active zones, expiry, bounce and break distances, swing depth, trend EMAs |
| Beginner Visuals, Damage On Chart | Show or hide zones, swing labels, ribbon, trend line, badge and event labels |
| Dashboard | Language (English or Indonesian), position, minimized start, layout, glow, DPI scale, text size |
| Machine Learning, Signal Score, Scanner | Learning rate, weights, saved model, scanner symbols and refresh rate |
| Alerts | Popup, sound, push and email |
Requirements
- MetaTrader 5, any symbol and any timeframe.
- Runs in the main chart window. It uses no DLL.
- Detection uses tick volume, which every broker provides.
- If the machine-learning option is on, the model weights are saved to a small file in the terminal data folder.
- A chart-tweaks option can hide the grid and native volume for a cleaner look. You can turn it off.
- Push notifications and email require setup in the terminal options.
Quick start
- Attach the indicator to a chart. The dashboard appears at the top left; drag it anywhere.
- Open the COACH tab for a plain-language reading of the current market.
- Follow one cycle on the chart: a damage (D), its repair (R), then the nearest zone.
- Set your alerts and, if you use an EA, read the signal and zone buffers.
Risk notice. Trading involves risk. WaveMaster Oscilloscope is an analysis tool and does not guarantee any result. Test it on a demo account and on your own symbols and timeframes before using it with real money.