Reverse Probability Profile
- Indicatori
-
Shipra Gupta
 Sono Shipra Gupta, trader e sviluppatrice di strategie quantitative con una solida formazione in matematica, economia e sistemi di trading algoritmico. Nel corso degli anni ho lavorato ampiamente nei mercati forex, oro, indici, materie prime e criptovalute, concentrandomi sulla costruzione di
- Versione: 1.0
Overview
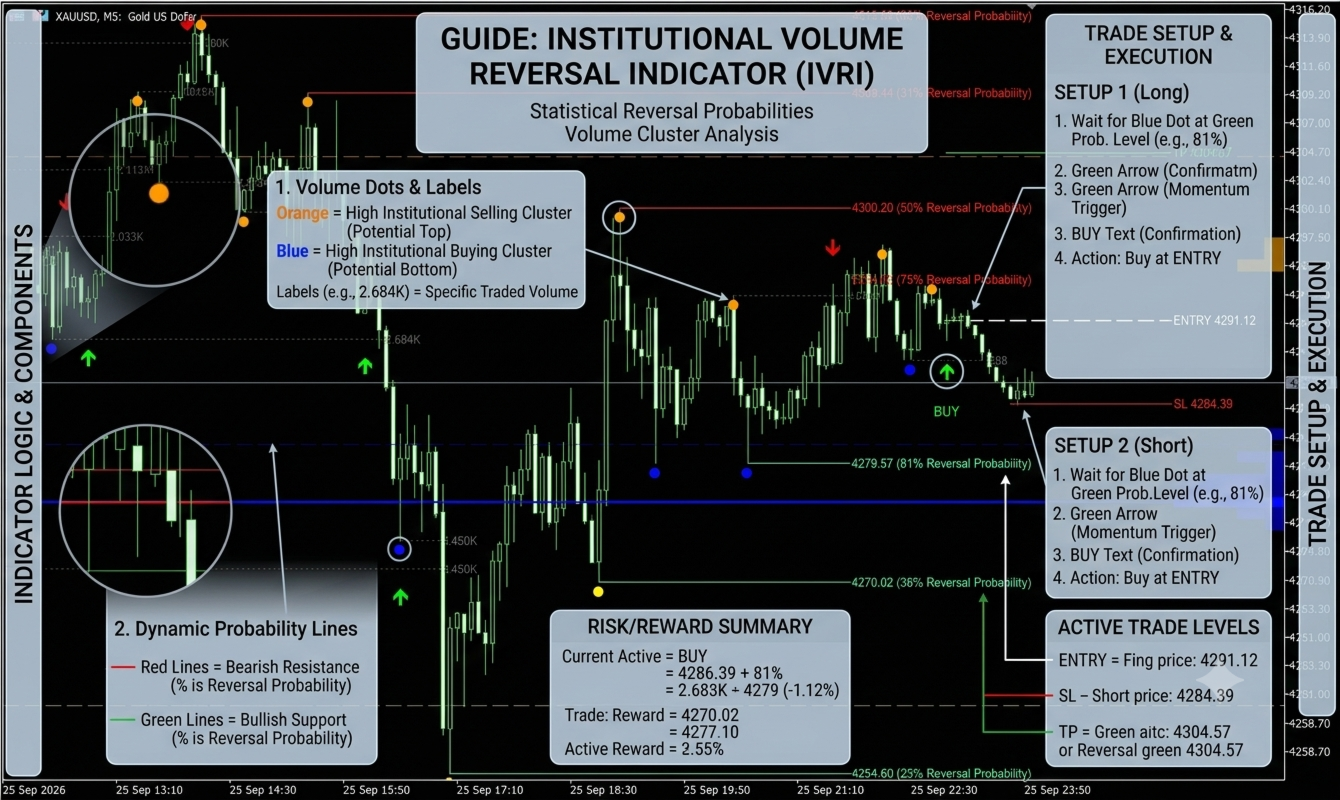
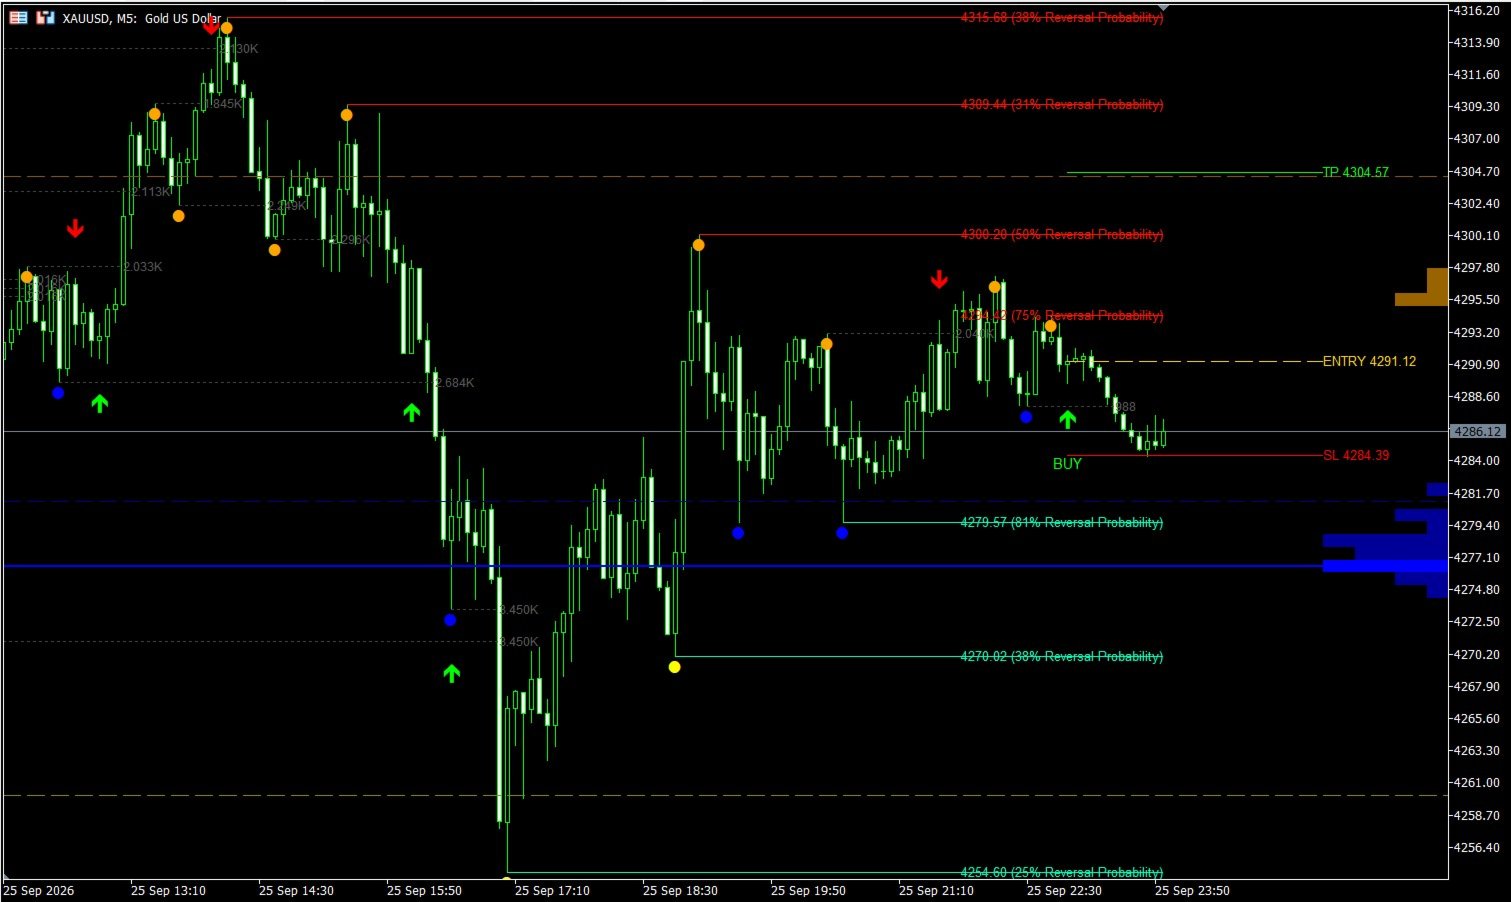
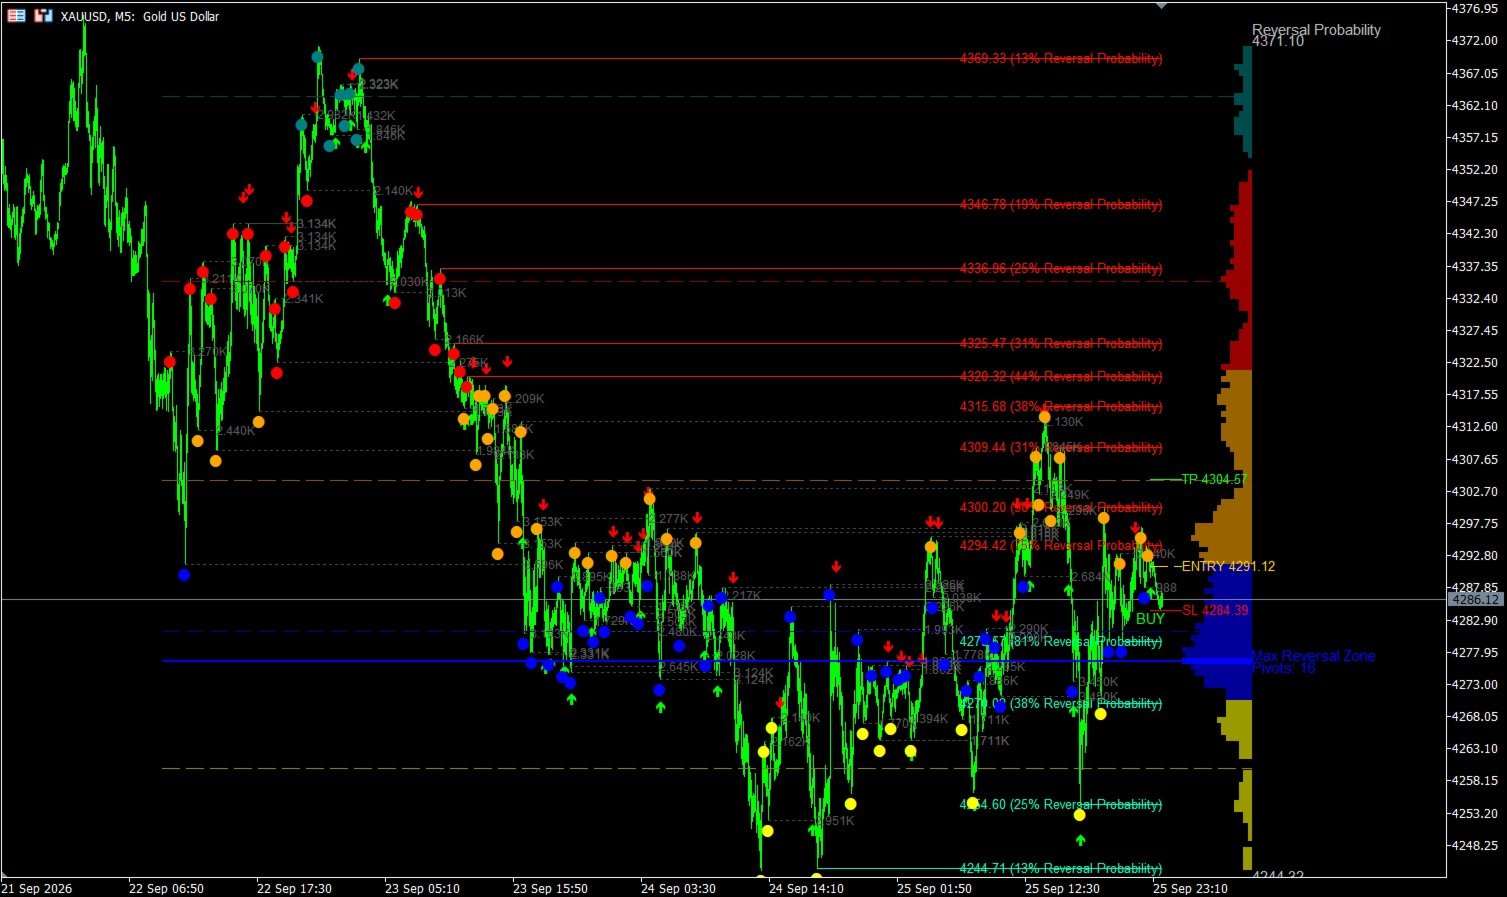
Reversal Probability Profile is a price-action analysis indicator that identifies historical swing points, groups them into price clusters, and displays a profile of potential reversal zones directly on the MetaTrader 5 chart.
The indicator combines pivot detection, K-Means clustering, and a profile-based visualisation to help traders assess areas where historical price reactions have occurred. It also provides configurable reversal signals, ATR-based risk references, and a visual representation of key price levels.
The indicator is designed for traders who want to analyse potential support and resistance zones using historical price structure rather than relying exclusively on manually drawn levels.
MT5 Expert Advisor Collection
Explore automated systems built for Gold & Bitcoin, covering breakout, scalping, momentum and multi-horizon strategies.
Gold: Range Striker | Gold Flash | Vortex Pro | Neural Scalper | Titan Forge | Quantum Pulse | GoldGridBreakout | Gold Micro Account
Bitcoin: BTC Strike | Alpha Vault | Edge Pilot
How It Works
1. Pivot Identification
The indicator scans historical price data to identify swing highs and swing lows. The left and right pivot settings control how swing points are detected and confirmed.
These pivots form the input data for the clustering and profile calculations.
2. K-Means Price Clustering
The indicator groups historical pivot prices into a configurable number of clusters using K-Means clustering.
This process organises nearby swing points into price regions that can be reviewed as potential support or resistance areas. The number of clusters and calculation iterations can be adjusted to change the analysis.
3. Reversal Profile and Key Levels
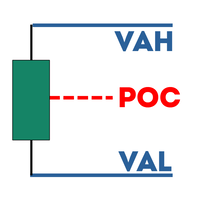
A profile is displayed on the right side of the chart to visualise the distribution of identified price levels. The indicator can highlight the Point of Control (POC) and display relevant support, resistance, and broken-level information.
The profile helps traders compare the current price with historical price structure. These levels represent historical analysis and do not guarantee that price will reverse when they are tested.
4. Signal Generation
When price tests a qualifying zone and meets the configured rejection conditions, the indicator can display a buy or sell signal.
Signal sensitivity can be adjusted using ATR-based touch tolerance and a signal cooldown. When a signal qualifies, the indicator can plot reference entry, stop-loss, and take-profit levels.
5. Volatility-Adjusted Risk References
The indicator uses Average True Range (ATR) to adjust touch tolerance and stop distance to the prevailing volatility.
The take-profit setting allows traders to configure the target relative to the selected risk distance. These plotted levels are analytical references and do not execute broker orders.
Key Features
-
Historical swing-high and swing-low identification.
-
K-Means clustering of historical pivot prices.
-
Configurable cluster count and calculation iterations.
-
Right-side profile visualisation.
-
Point of Control (POC) display.
-
Potential support and resistance zone analysis.
-
Buy and sell signals based on configured price-rejection conditions.
-
ATR-adjusted touch tolerance and stop-loss references.
-
Configurable risk-to-reward target projection.
-
Signal cooldown to limit closely spaced signals.
-
Visual tracking of broken price levels.
-
Historical tick-volume information, where supported by the indicator's calculations.
-
Configurable display of the profile, POC, support and resistance lines, and broken levels.
Input Settings
Calculation Engine
-
Pivot Left Bars: Sets the number of bars used on the left side of a potential pivot.
-
Pivot Right Bars: Sets the number of bars used to confirm a pivot on the right side.
-
Profile Resolution: Controls the resolution of the displayed price profile.
-
Profile Clusters: Sets the number of clusters used to group historical pivot prices.
-
Cluster Iterations: Sets the number of iterations used by the clustering calculation.
Risk and Signals
-
Touch Tolerance (xATR): Sets the permitted distance from a relevant level relative to ATR.
-
Stop Distance (xATR): Sets the ATR-based stop-loss reference distance.
-
Take-Profit R:R: Configures the take-profit target relative to the defined risk distance.
-
Signal Cooldown: Sets the minimum spacing between consecutive signals in bars.
Display
Use the available display settings to show or hide the profile, Point of Control, support and resistance levels, and broken levels. Adjust the display to suit your chart layout.
Suggested Trading Workflow
-
Attach the indicator to a chart with sufficient historical price data.
-
Review the profile and identify price clusters near the current market.
-
Compare relevant zones with the broader trend and other support or resistance levels.
-
Monitor price behaviour when a zone is tested.
-
Evaluate a generated signal and review its plotted entry, stop-loss, and take-profit references.
-
Define the invalidation point and acceptable risk before considering a trade.
Suitable For
-
Traders analysing historical swing points and price clusters.
-
Support and resistance traders seeking a structured view of historical price reactions.
-
Price-action traders evaluating potential reversal areas.
-
Traders who use ATR-based risk references and configurable signal filters.
Requirements and Setup
-
Open MetaTrader 5 and attach the indicator to the desired chart.
-
Ensure sufficient historical data is available for the selected instrument and timeframe.
-
Configure the pivot settings, profile resolution, cluster count, and signal parameters.
-
Adjust the profile and level display settings to suit your analysis.
Important Notes
Reversal Probability Profile is an analytical indicator, not an automated trading system. Historical pivot clusters do not establish the probability that a future reversal will occur. Price may pass through identified zones or continue in the direction of a breakout.
Pivot confirmation depends on the configured left and right bar settings. Check the indicator's behaviour on live bars and historical charts before relying on its signals. ATR-based levels and take-profit projections are references, not guarantees of execution price or trade outcome.
Results depend on the instrument, timeframe, available historical data, and selected settings. Use independent confirmation, test the indicator under relevant market conditions, and apply appropriate risk management.