Big Move Map

  • Göstergeler
  • Anna Makwana
    Anna Makwana
    MetaTrader tools and indicators that measure the odds on your own chart: how often levels were reached, how far days and sessions usually run, and what followed past signals. Every figure comes from the symbol’s own price history and uses closed bars only, so nothing repaints. Questions are welcome
  • Sürüm: 1.0

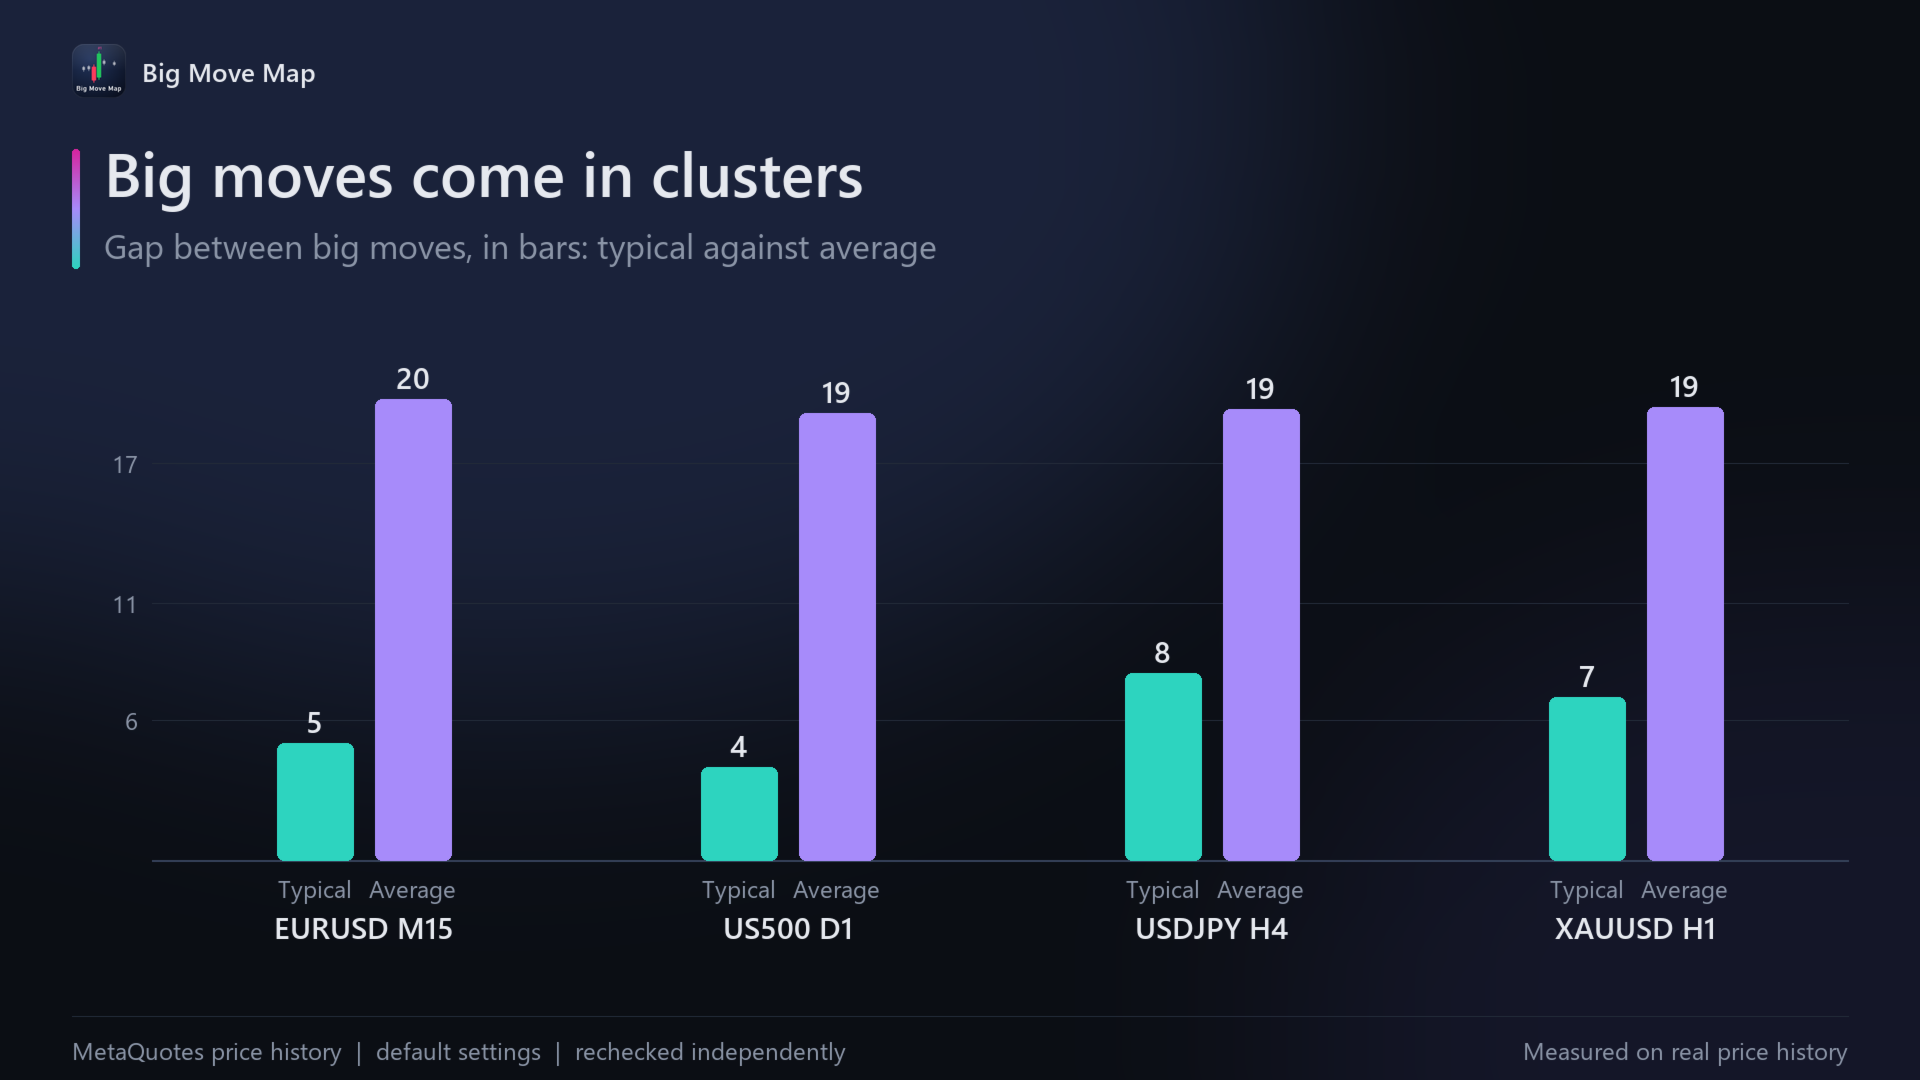
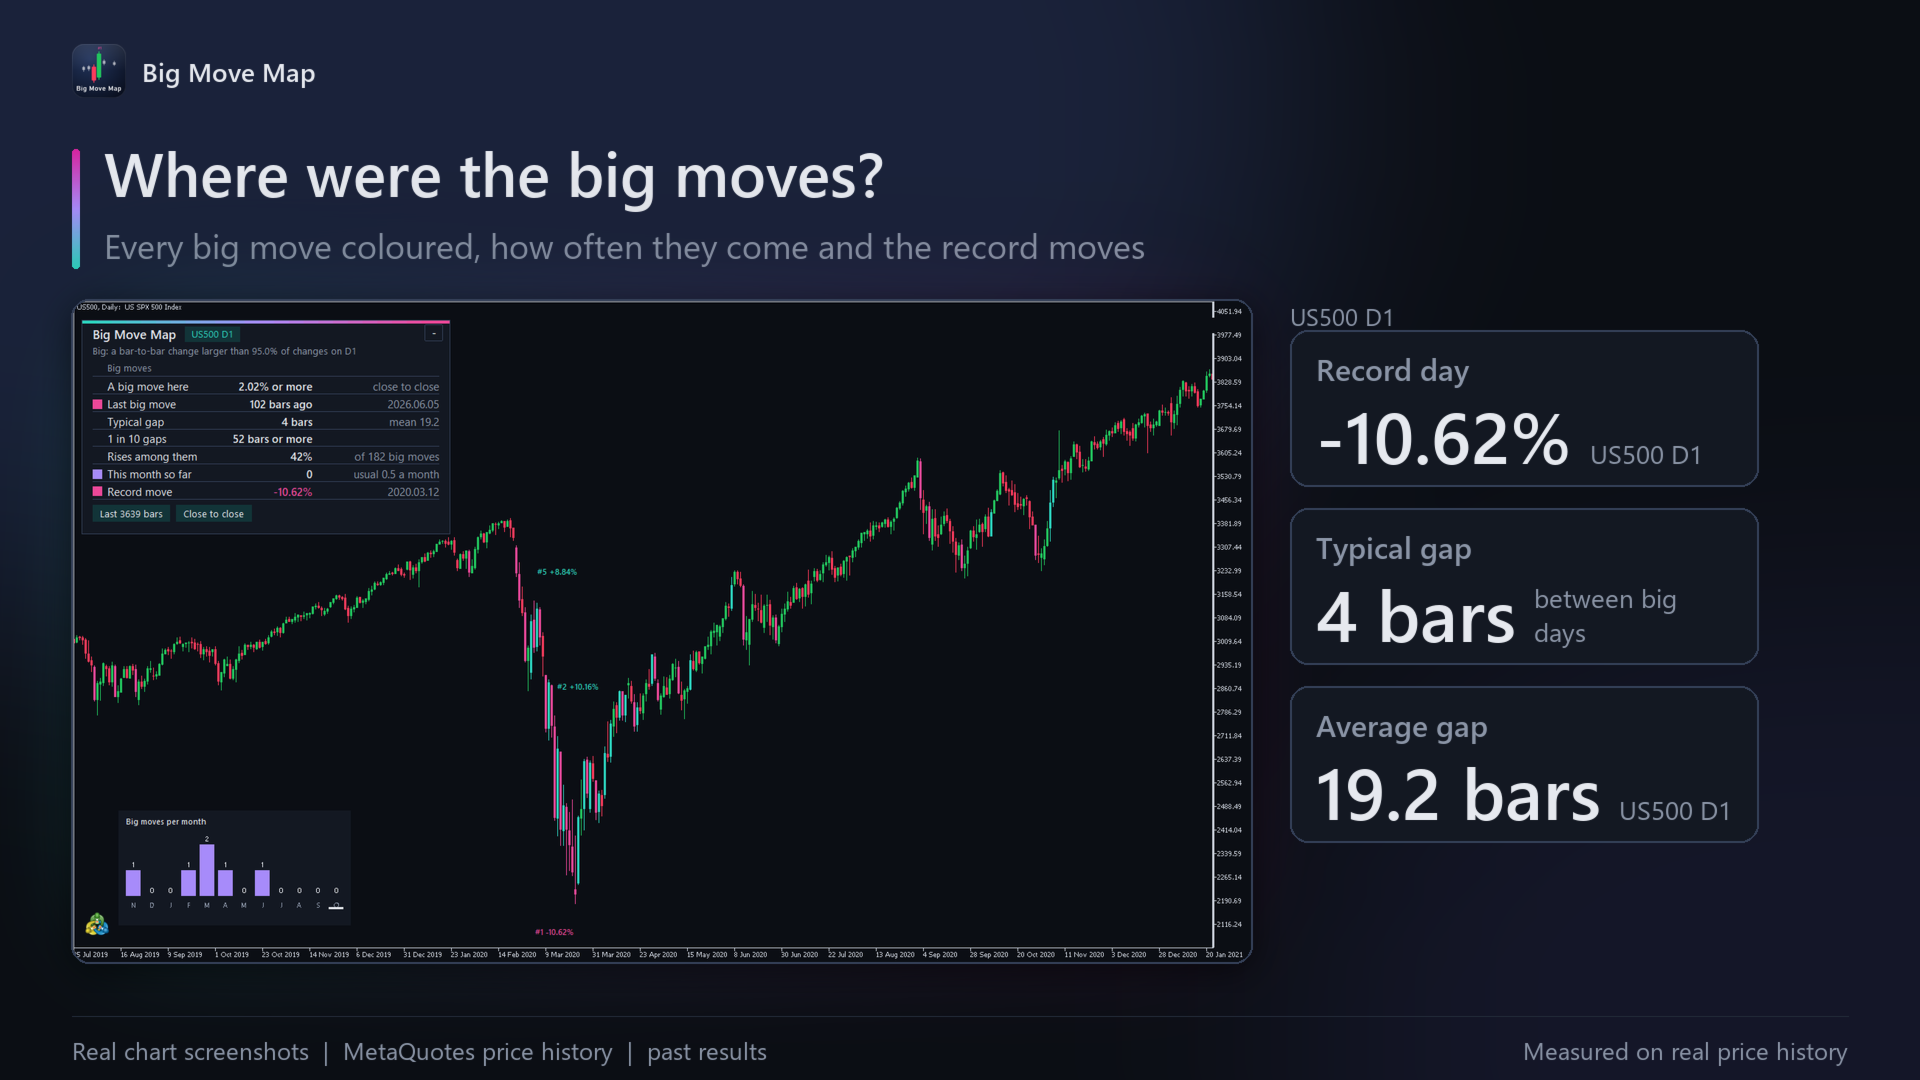
Big Move Map colours every big move on your chart and counts them: how often big moves come on this symbol, how many bars since the last one, the usual gap between them, big moves per month and the 10 record moves with their dates. Big moves come in clusters: on US500 D1, half of the big days came within 4 days of the one before, while the average gap was 19 days. The record day since 2012 was -10.62% on 12 March 2020. Closed bars only, so it never repaints. Every number is verified against a separate implementation before each release.

What it does

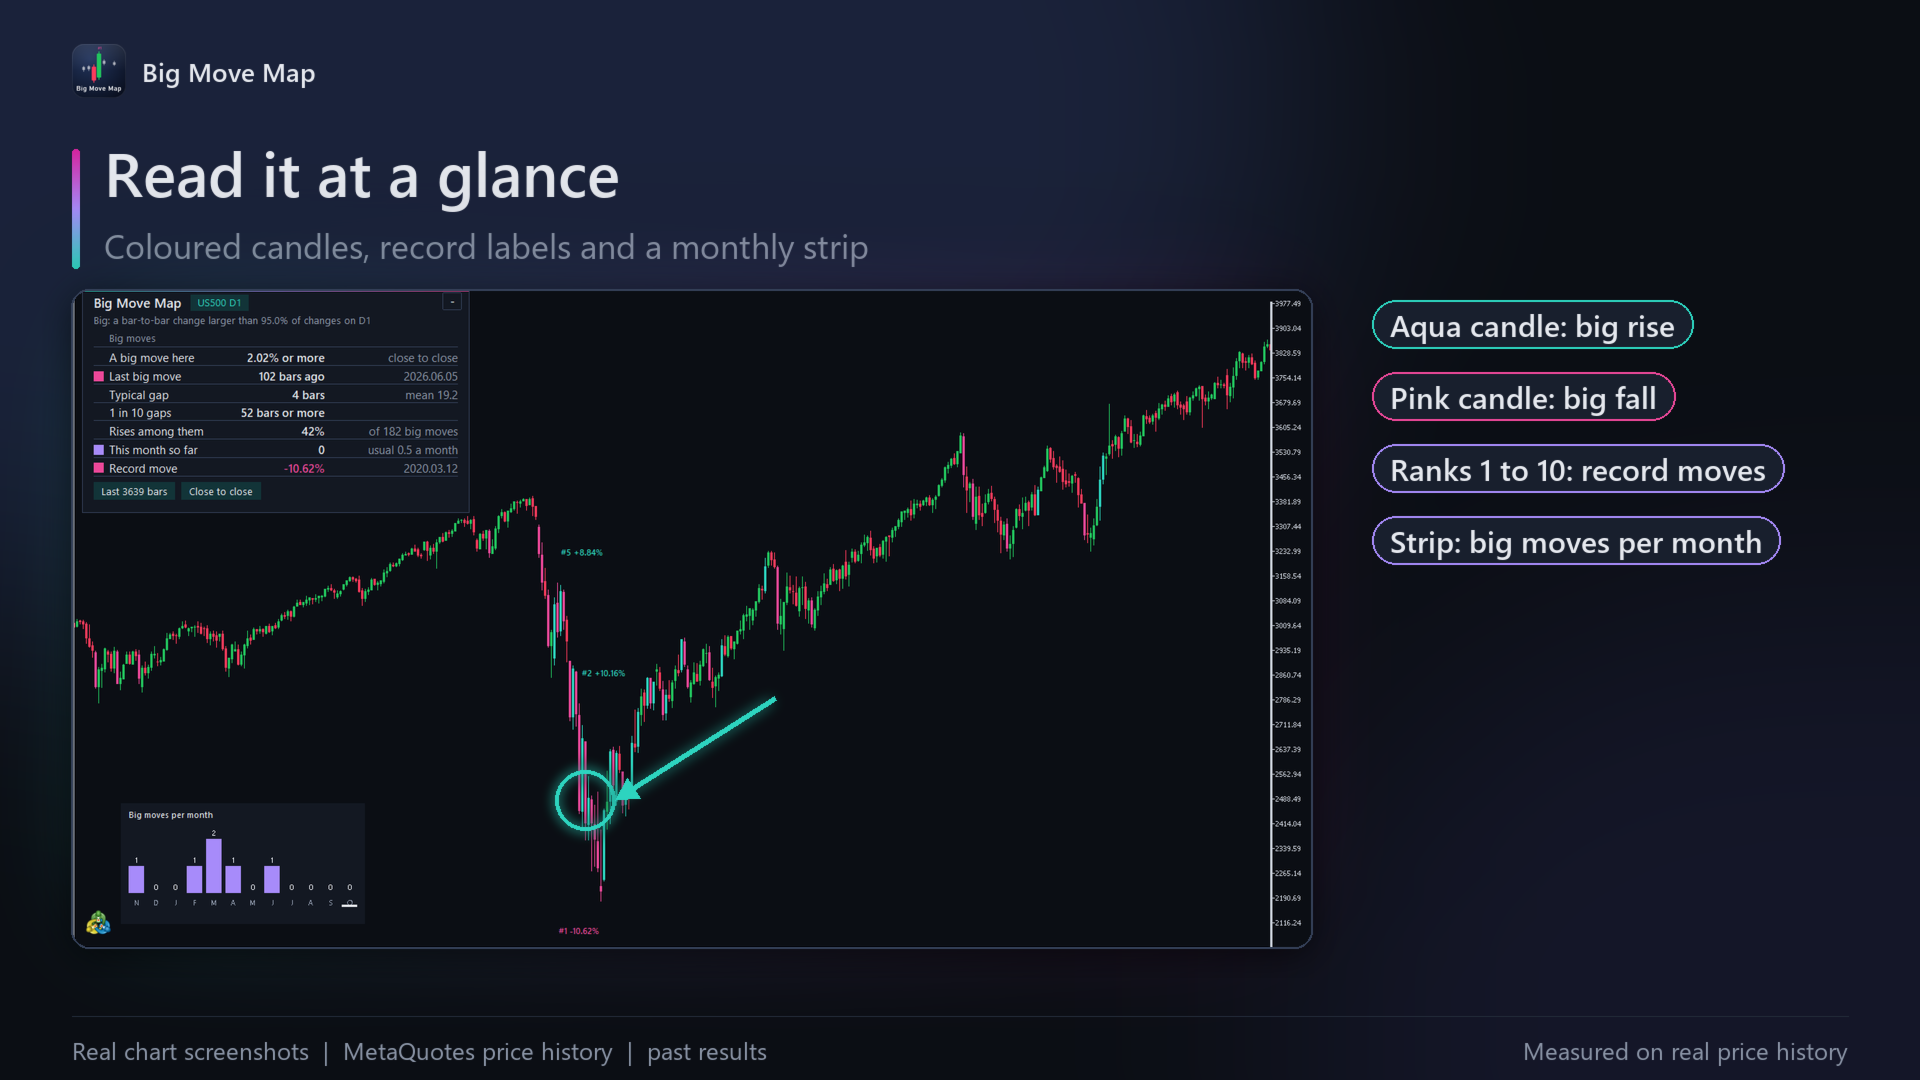
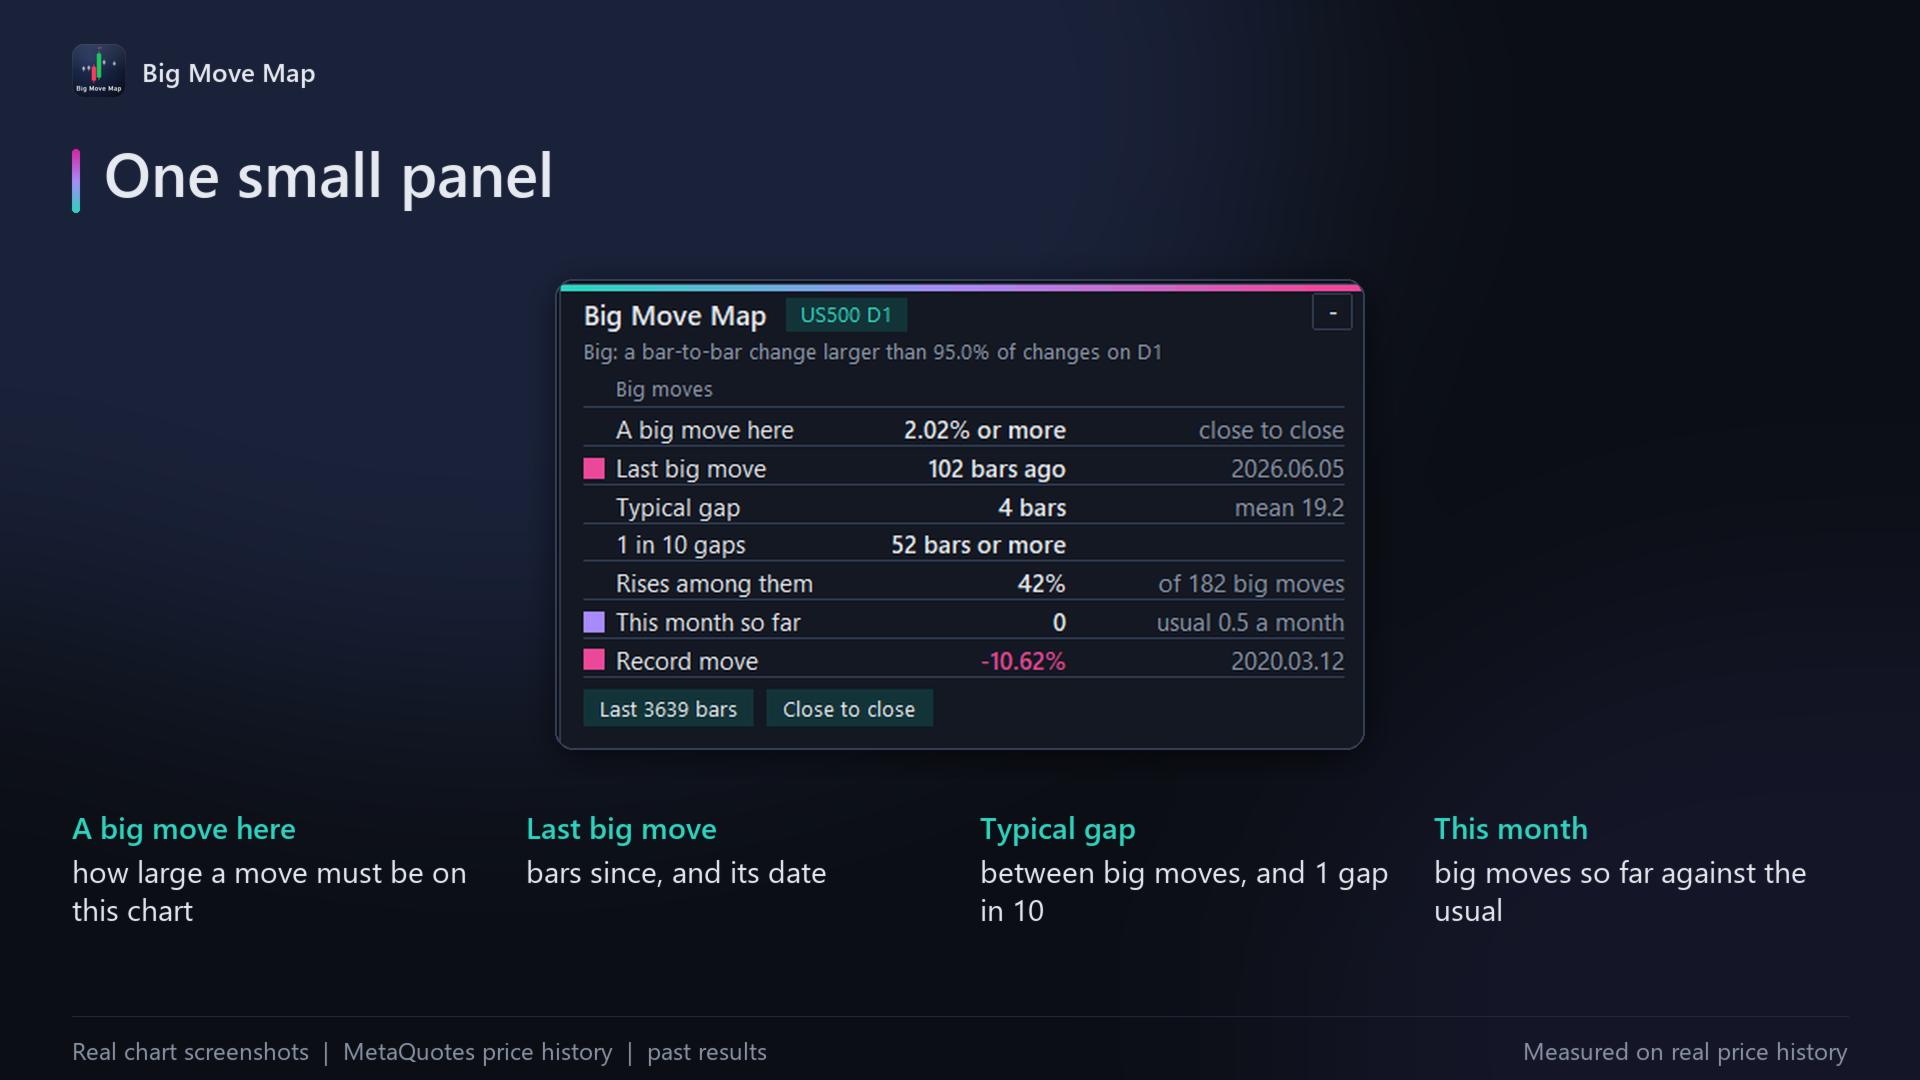
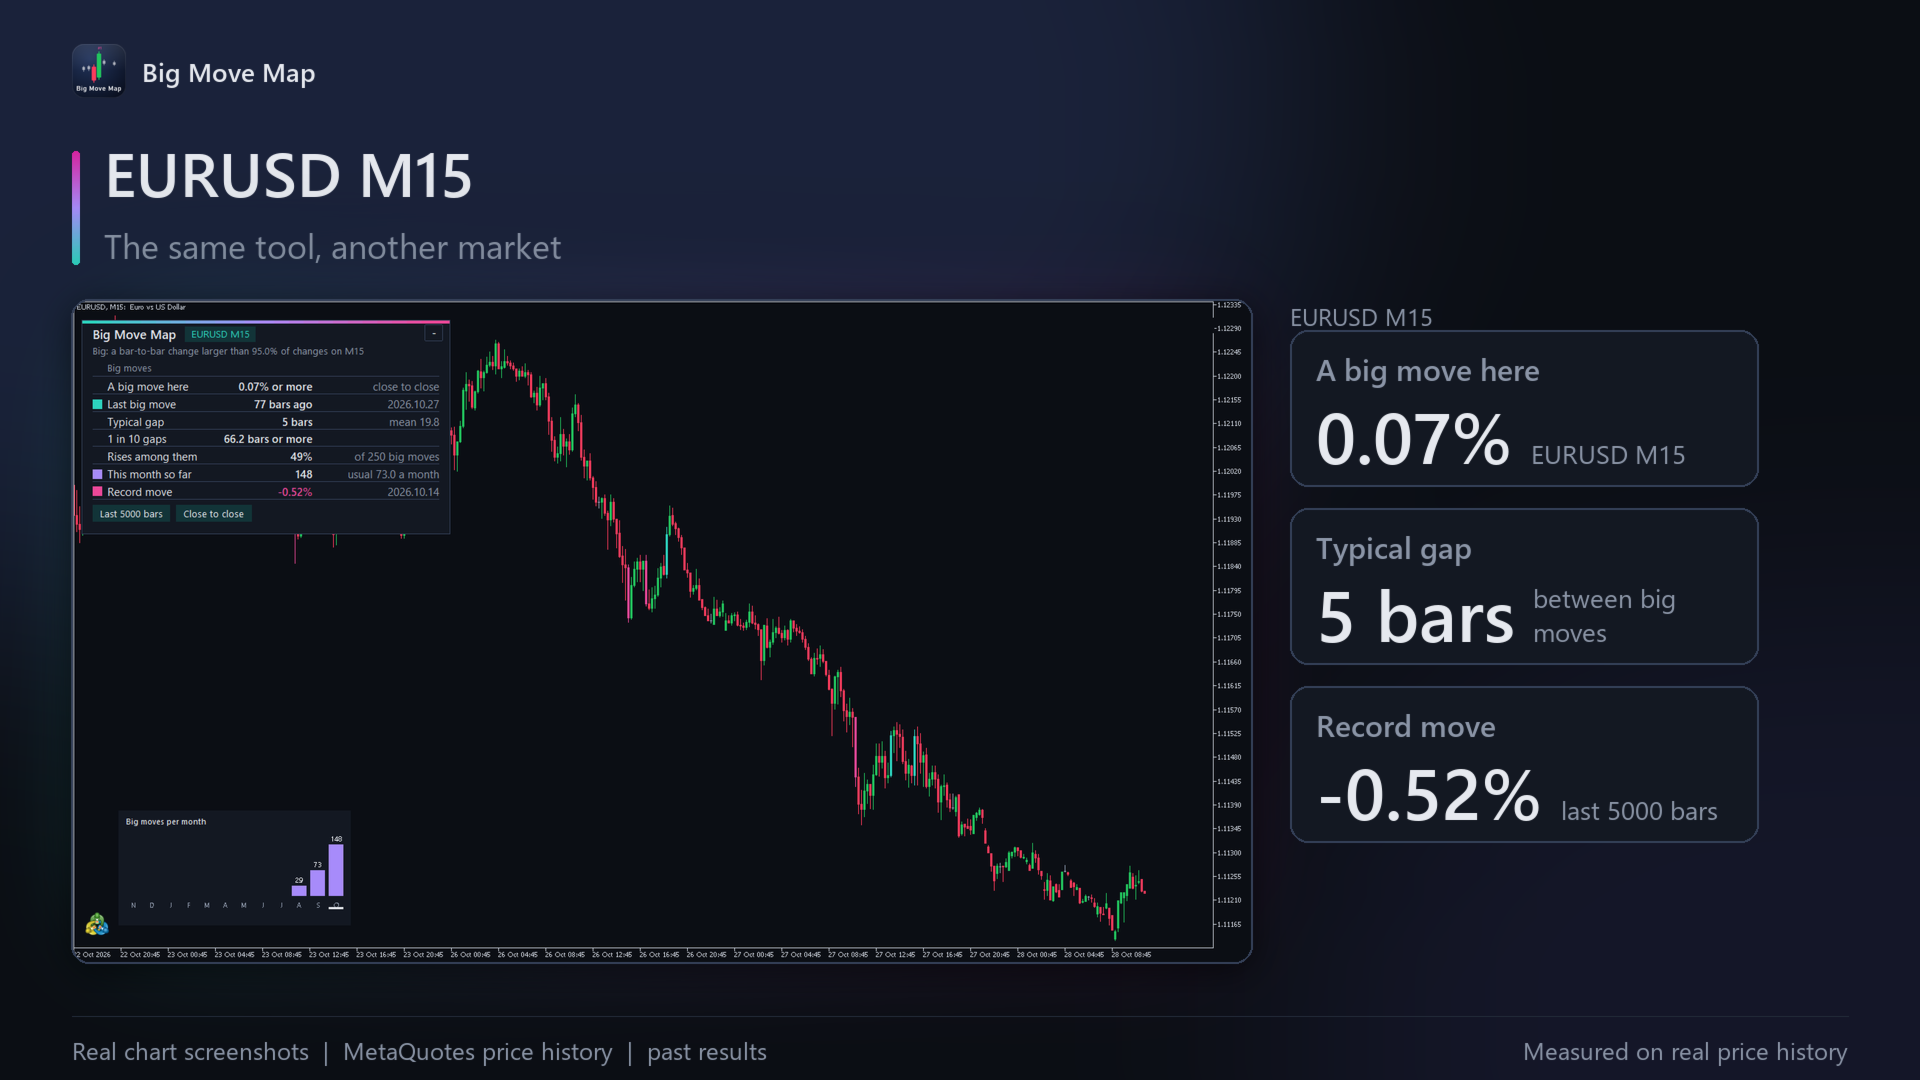
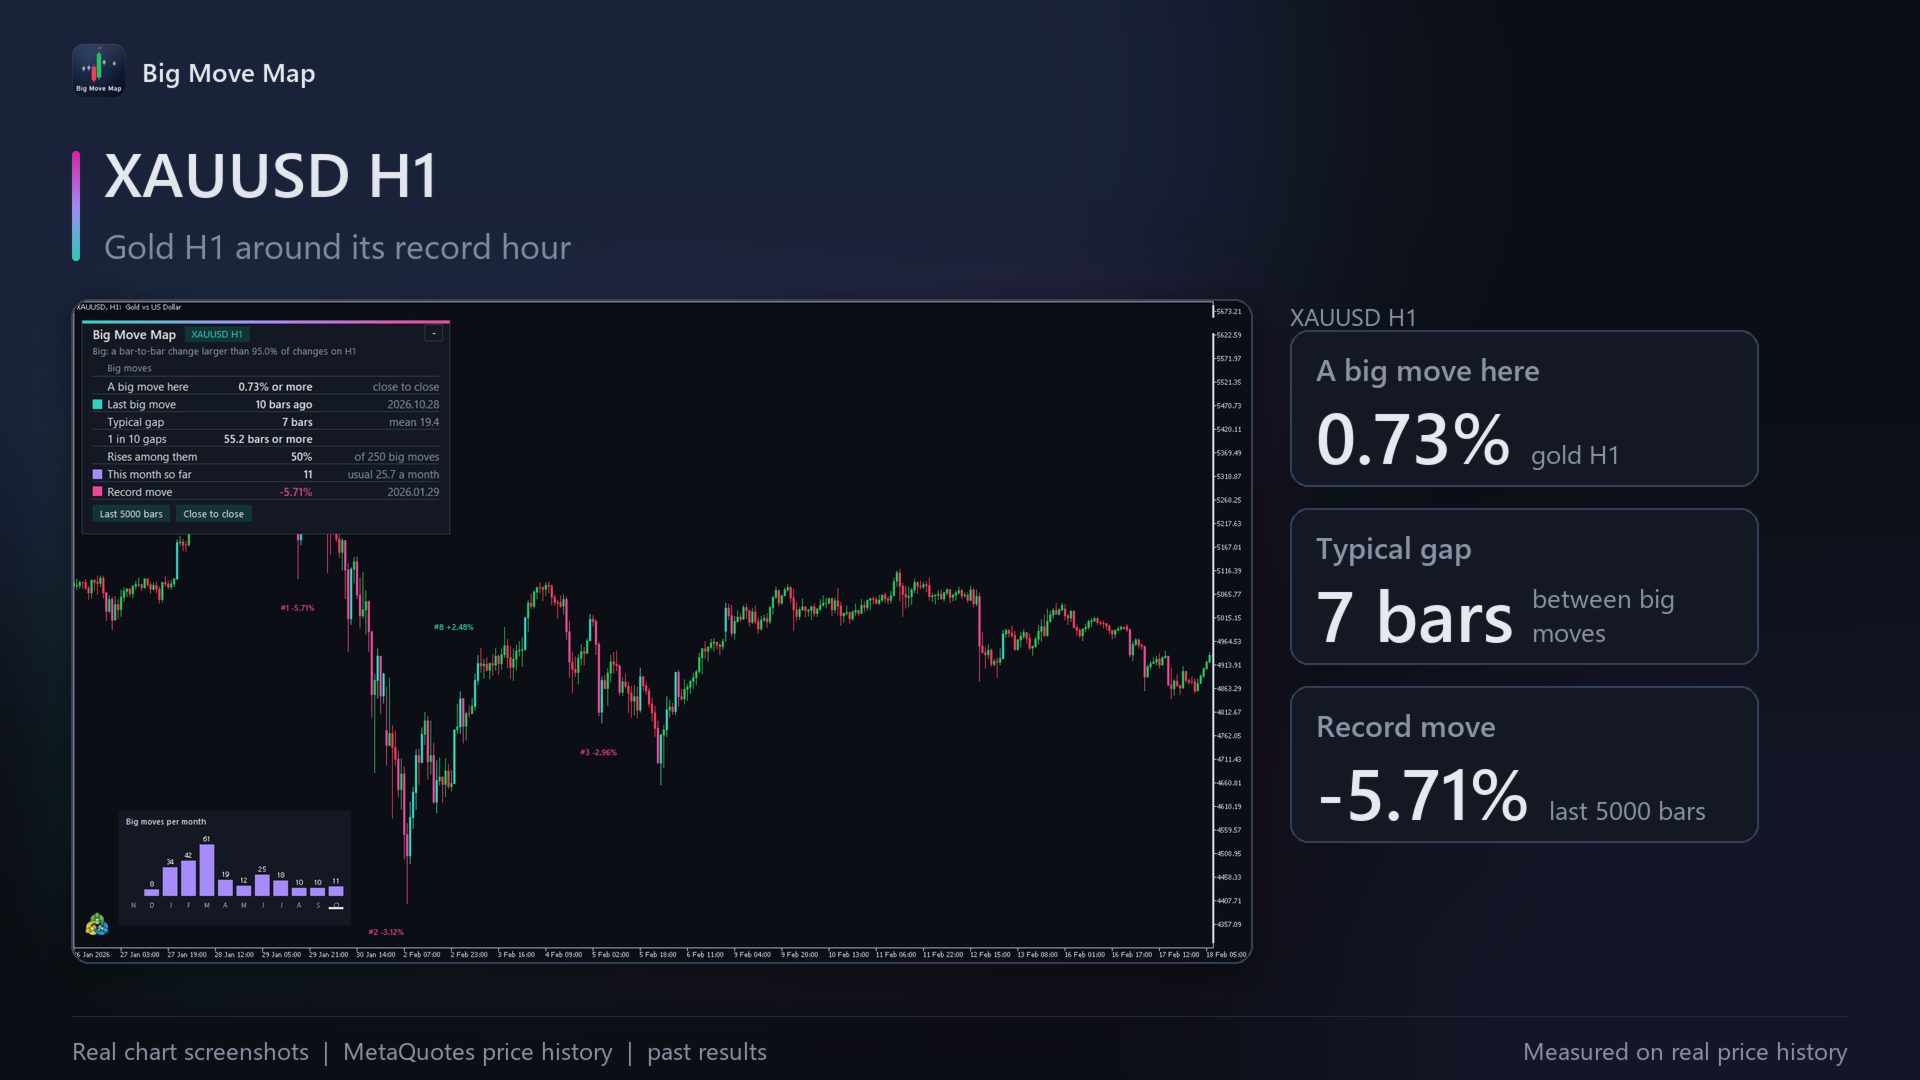
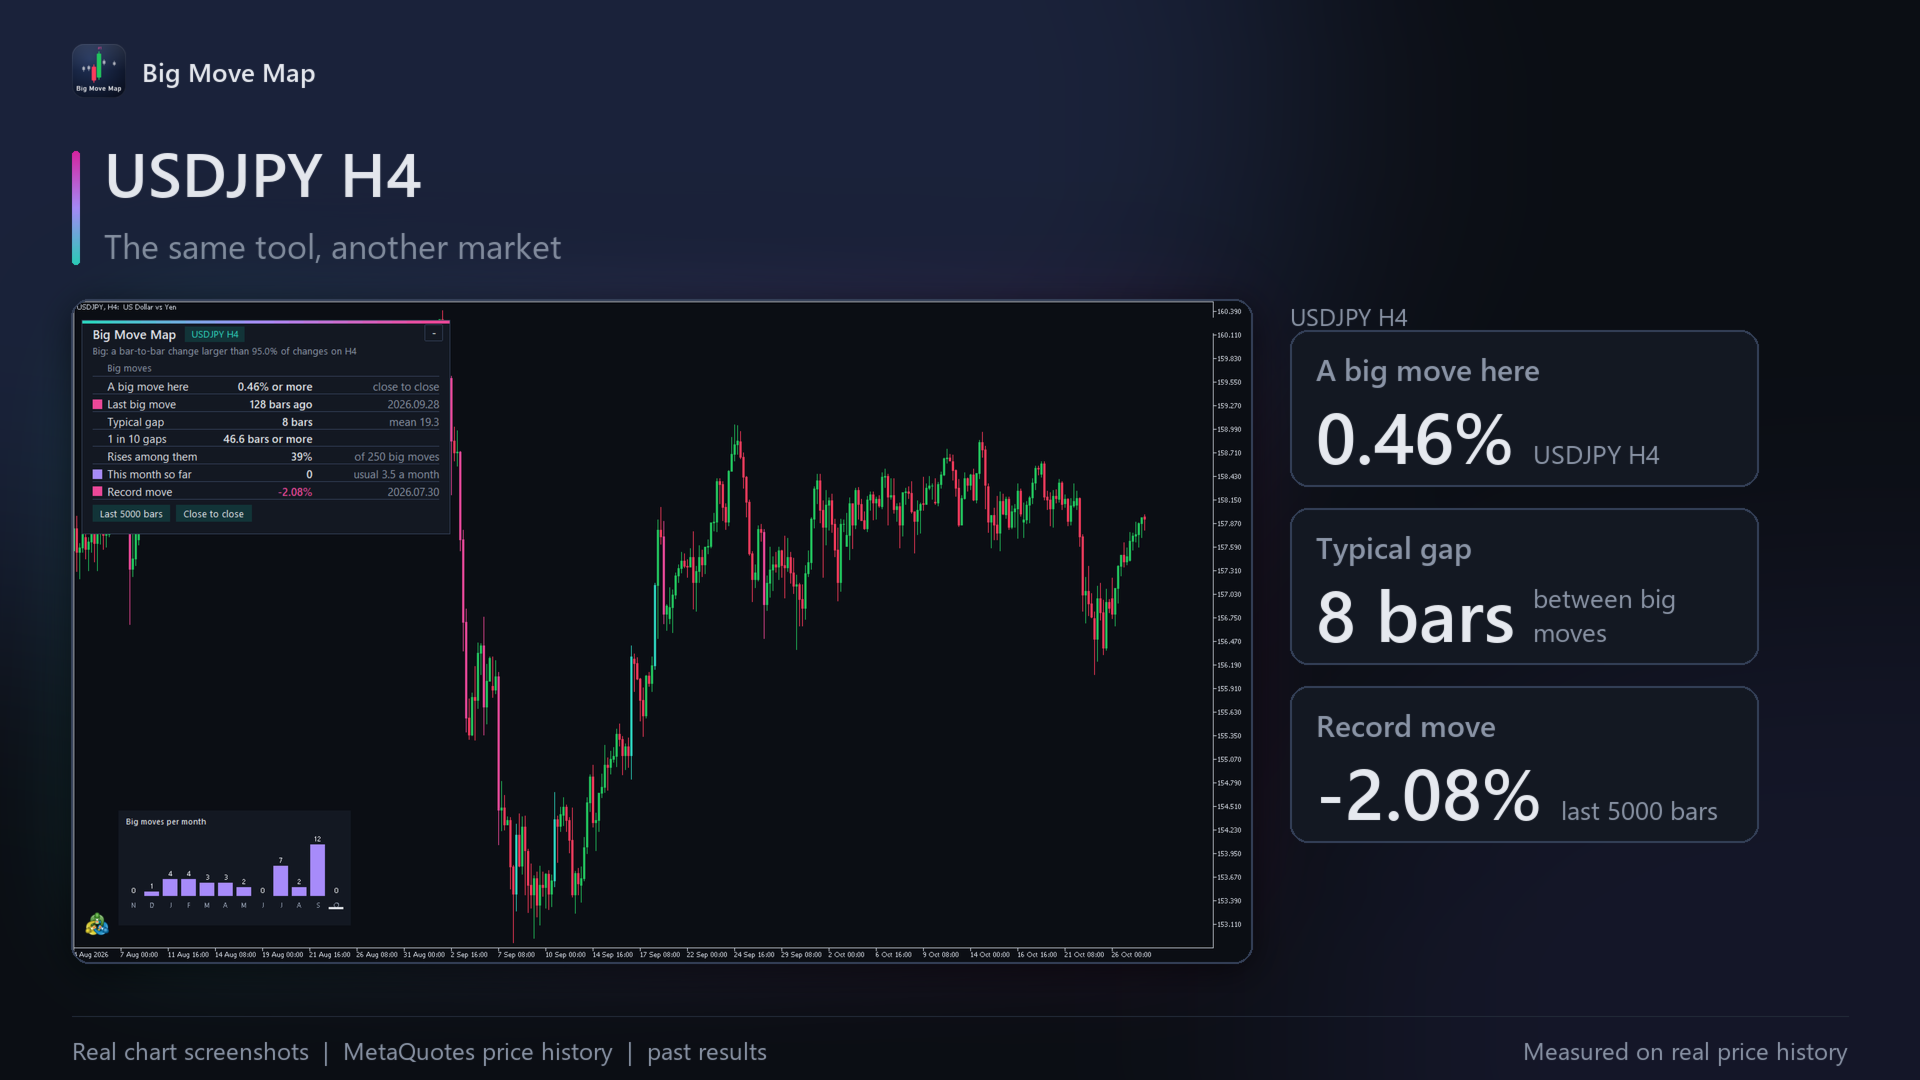
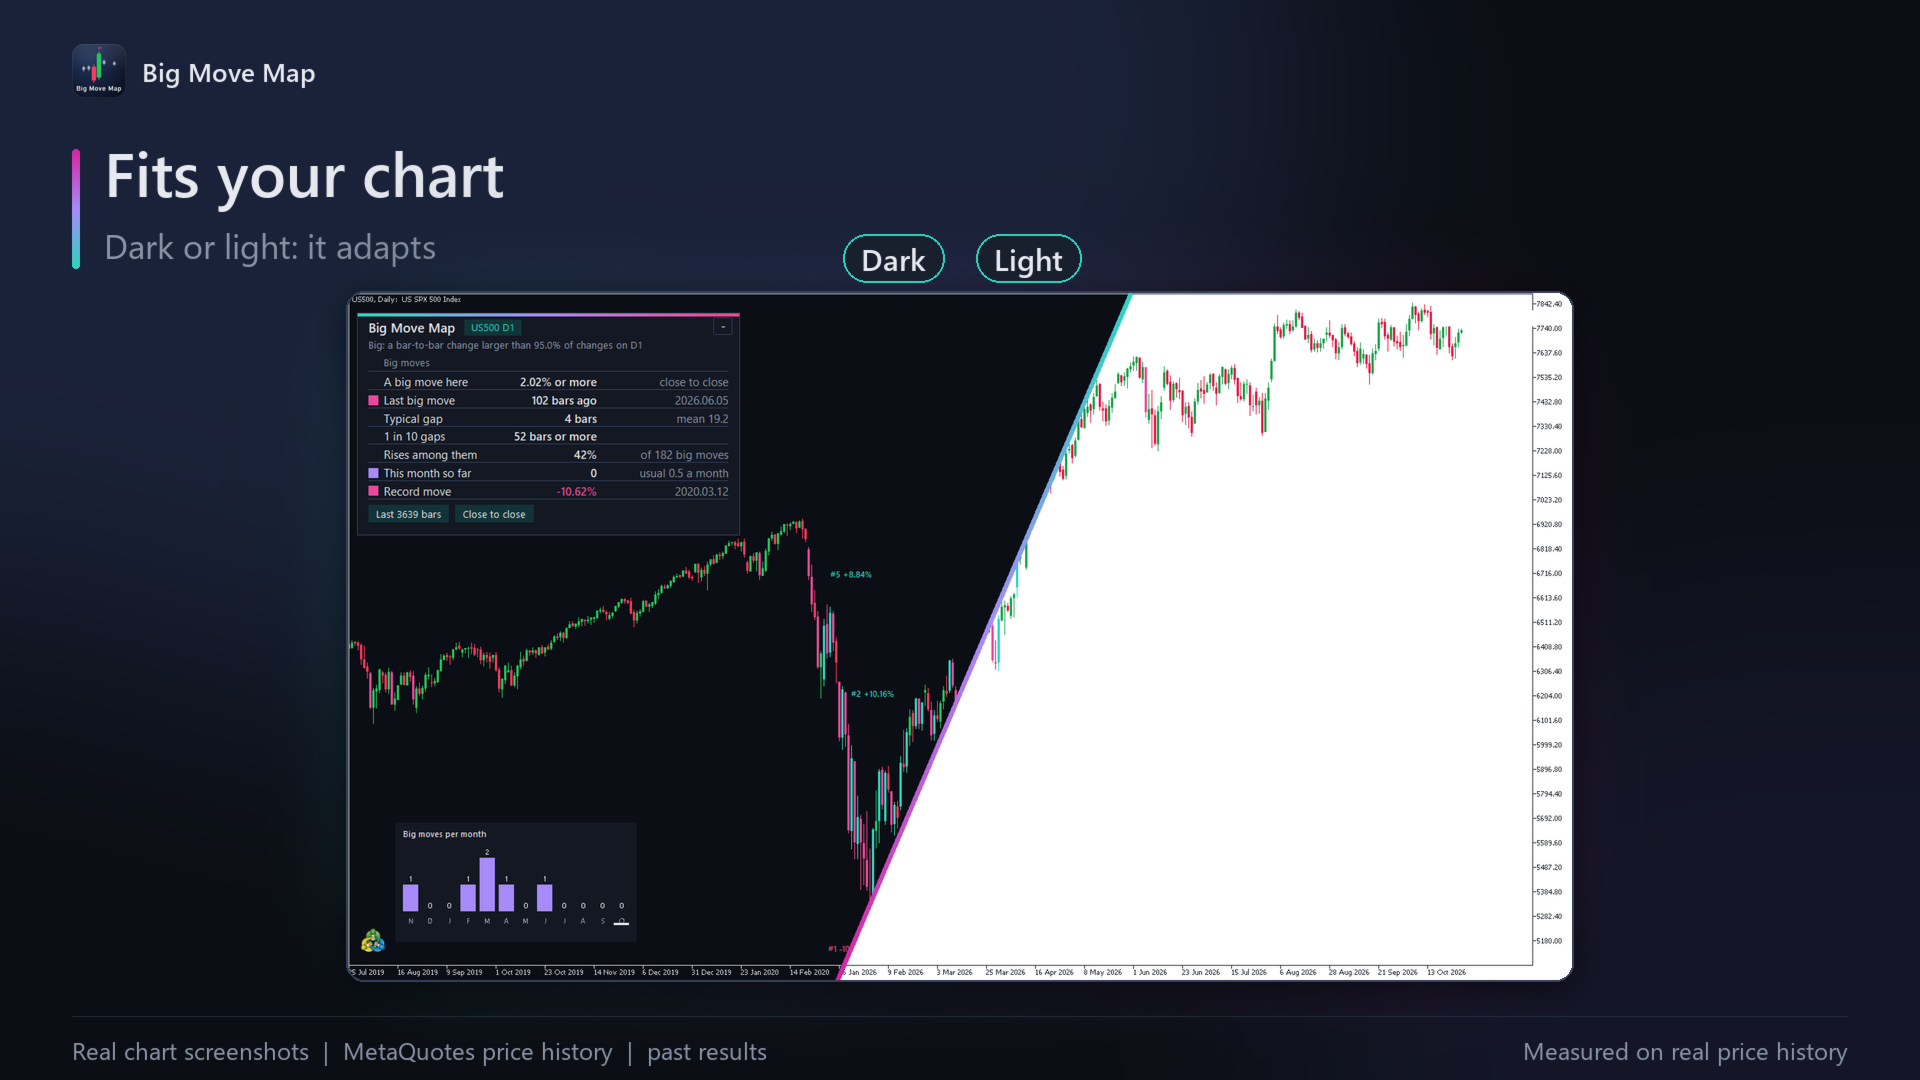
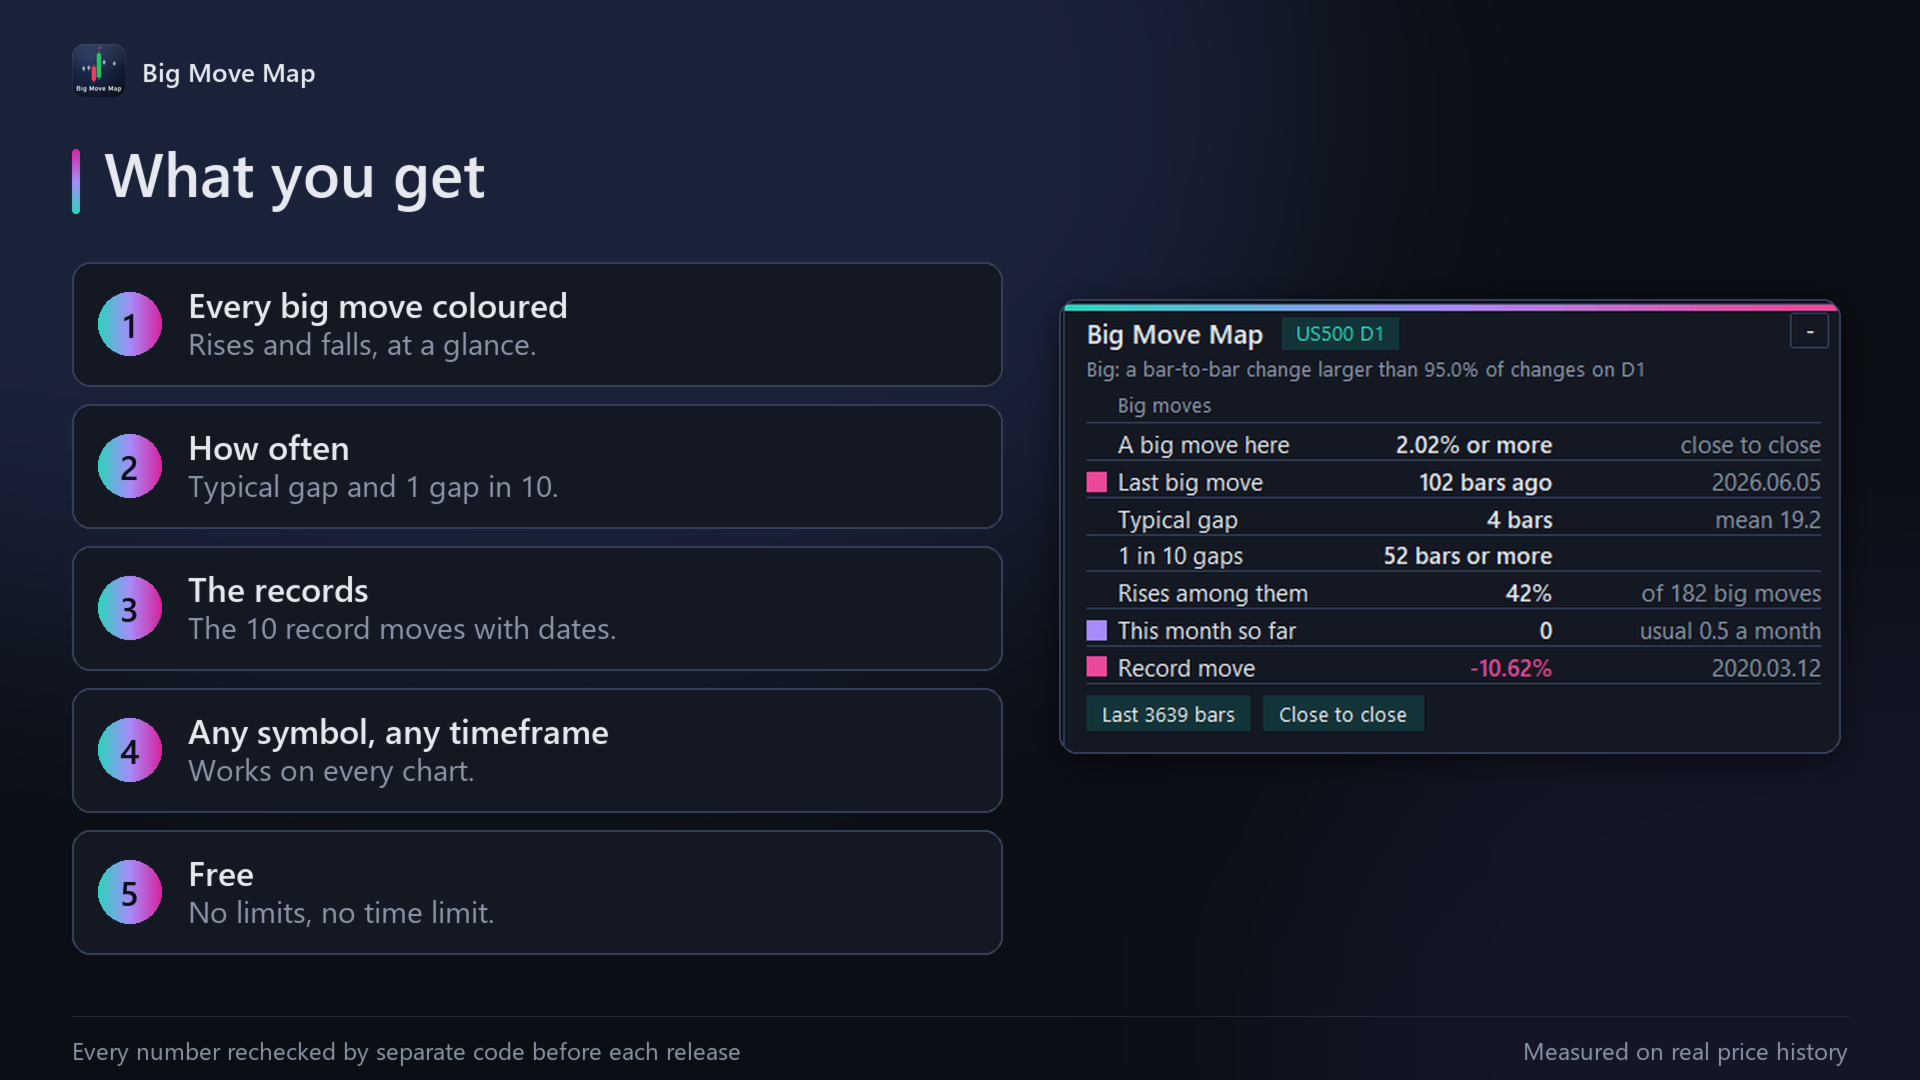
Every candle with a big move is redrawn in colour on the price chart: aqua for a big rise, pink for a big fall. The 10 record moves are labelled with their rank and size. A small panel shows how large a move must be to count as big on this chart, the bars since the last big move and its date, the typical gap between big moves and the 1-in-10 gap, the share of big moves that were rises, the big moves this month against the usual number per month, and the record move. A strip in the lower-left corner shows the big moves in each of the last 12 months.

How it works

Each candle's move is its close against the previous close, in percent. A move is big when it is larger than 95% of all moves on this symbol and timeframe (you can set 80% to 99.5%), so "big" follows each market's own history and the same setting fits gold, currencies and indices on any timeframe. The last 5000 bars are studied by default. Only finished candles count.

How it was tested

Every figure (which candles are big, the size a big move needs, the gaps, the monthly counts and the 10 records) is recomputed by a separate implementation from the same broker data and matches it to the last decimal, on gold, EURUSD, US500 and USDJPY across H1, M15, D1 and H4, at settings from 80% to 99% and several history lengths.

Results and risks

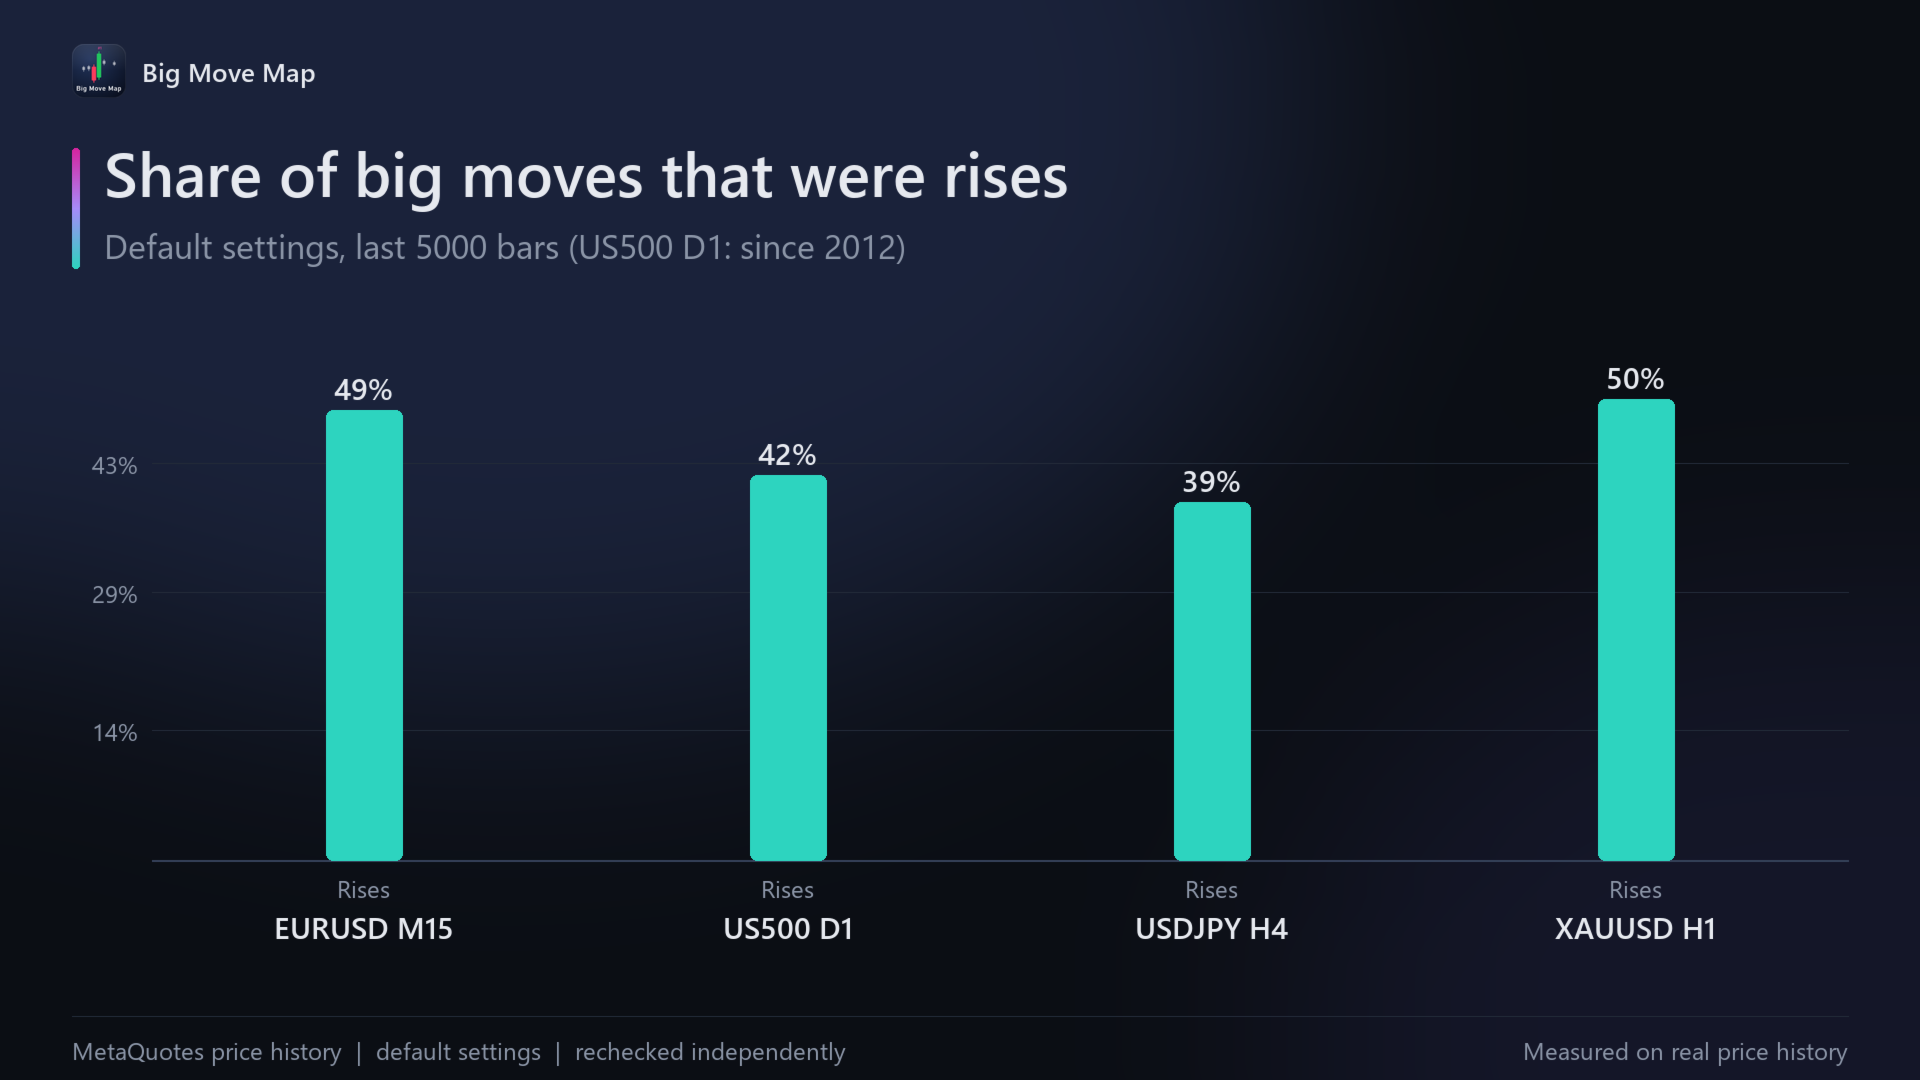
On US500 D1 since August 2012, a big day was a move of 2.02% or more; there were 182, and 42% of them were rises. The typical gap between big days was 4 days, the average 19. The record moves were -10.62% on 12 March 2020, +10.16% on 24 March 2020 and +10.14% on 9 April 2025. On gold H1 over the last 5000 bars, a big hour was 0.73% or more, and the typical gap between big hours was 7 bars. These describe past moves, not the future: a move can always be larger than any before it.

Recommended use

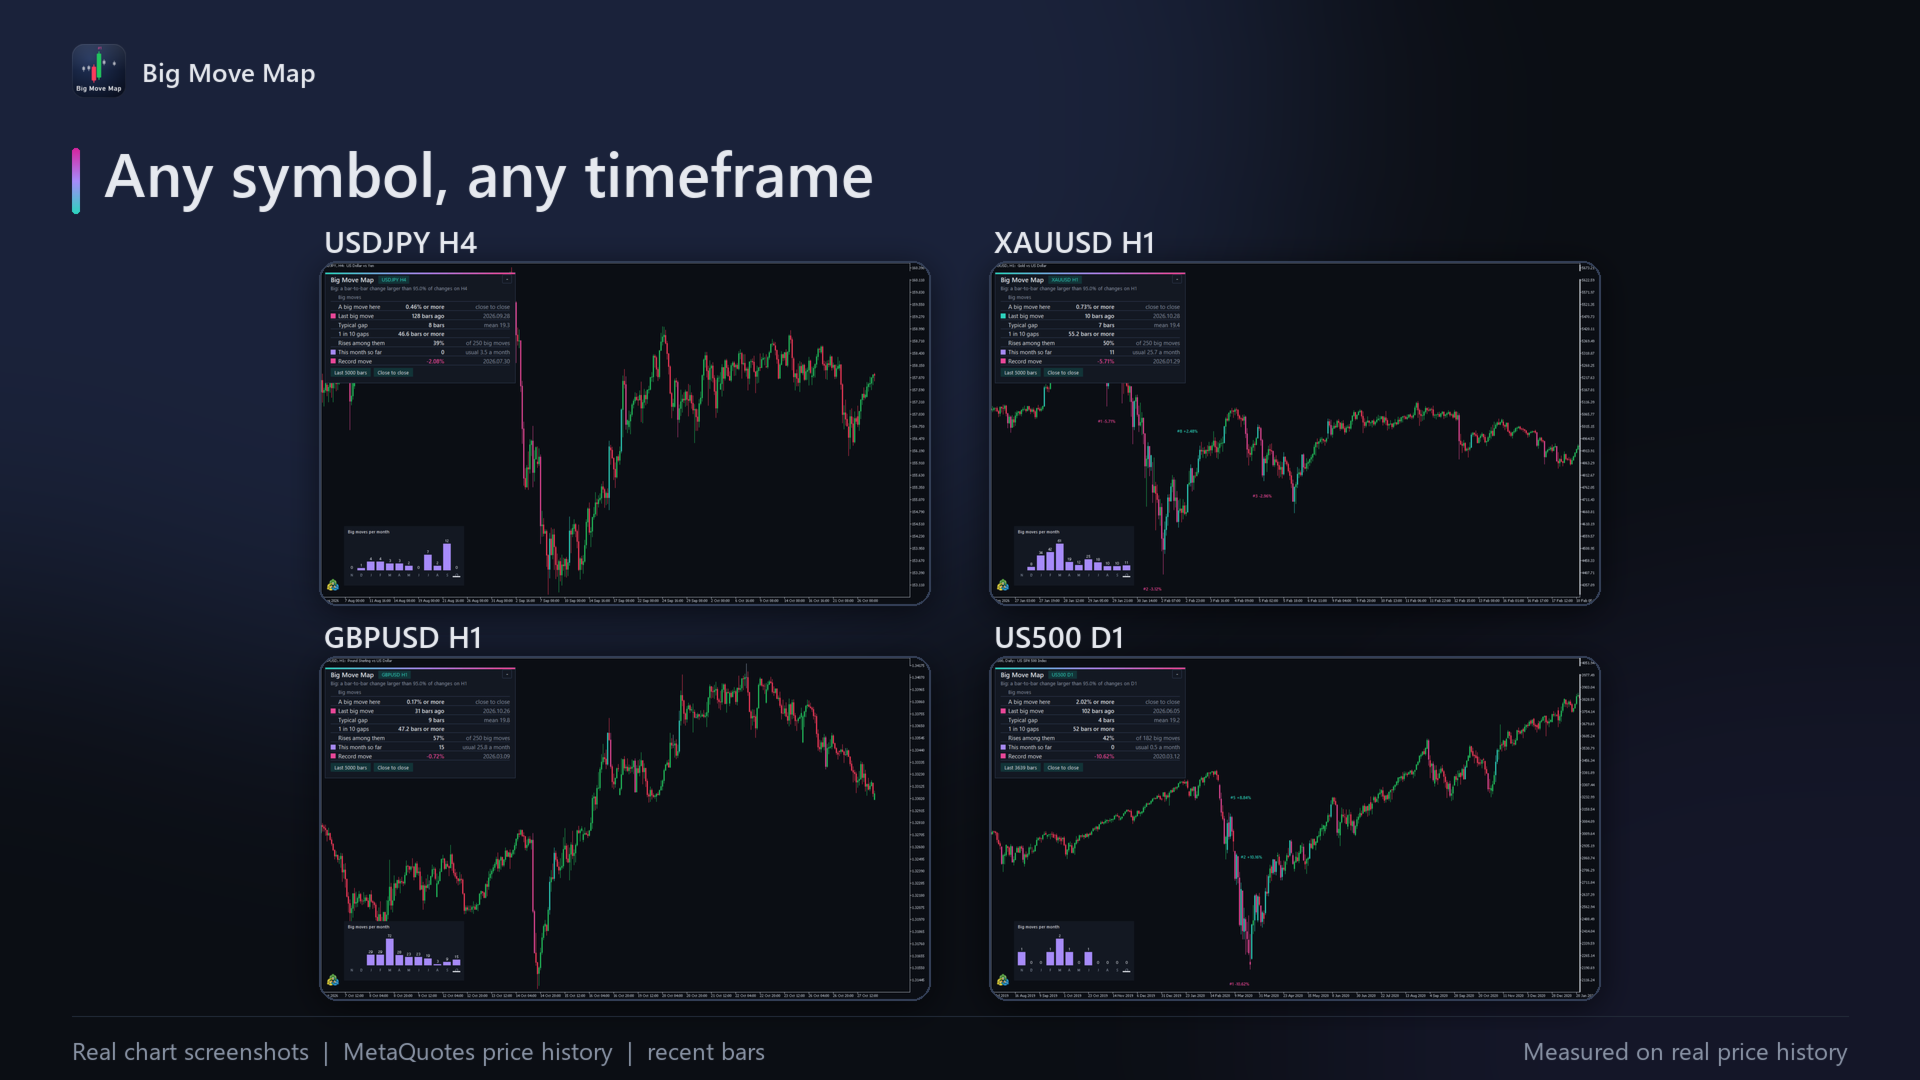
Any symbol and any timeframe, from M1 to monthly, with at least 200 finished candles. Typical uses: seeing at a glance where the big moves were on the chart, how long it has been since the last one, whether this month has had more than usual, and when the record moves happened.

Inputs

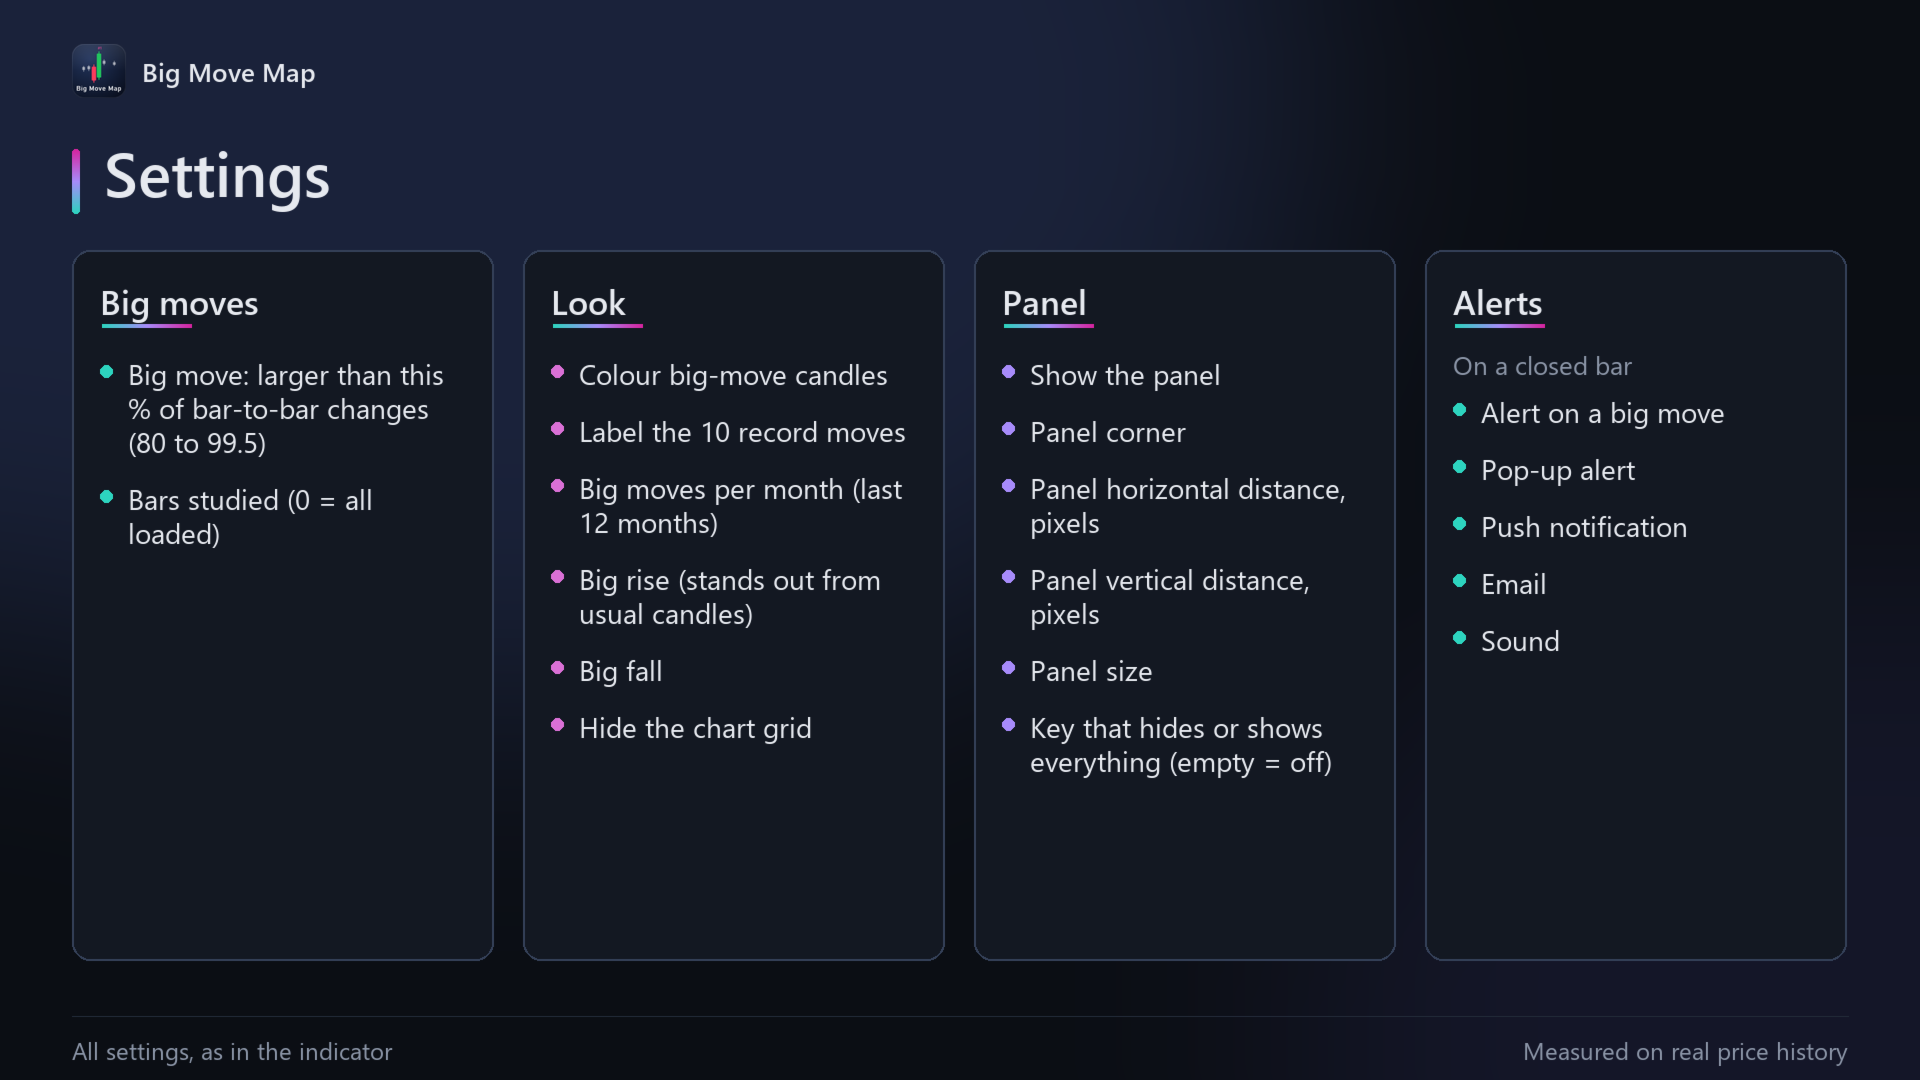
  • Big move: larger than this share of moves (95% by default, 80% to 99.5%).
  • Bars studied: 5000 by default; 0 uses all loaded history.
  • Coloured candles, record labels and the monthly strip: each can be switched off.
  • Colours for big rises and big falls.
  • Panel: show or hide, any chart corner, distance from the edges in pixels, and size (small, normal, large). One key (H by default) hides or shows everything the indicator draws.
  • Alert on a big move: pop-up, push, email or sound, on a closed bar.
  • Hide the chart grid: on by default.

Risk notice

Trading forex, metals, indices and other leveraged products carries a high risk of loss. Big Move Map is an analysis tool: it does not give investment advice or trading recommendations, and it does not guarantee any result. All figures describe past data, and past behaviour does not guarantee future behaviour. You are responsible for your own trading decisions.

Support

Questions? Message me through MQL5 chat.

Useful? A short review helps other traders find it.

A full guide with pictures: https://www.mql5.com/en/blogs/post/778639
Yazarın diğer ürünleri
Swing Size Ruler colours every swing on the chart by its size and measures the swing you are in now against all past swings on this symbol and timeframe: "this up swing is longer than 82% of past up swings". On gold H1, a typical up swing covered 10,309 points in 16 bars, and 1 swing in 10 covered 23,327 points or more. Closed bars only, so it never repaints. Every number is verified against a separate implementation before each release. What it does Each finished swing is drawn on the price cha
FREE
How far is price below its high, and how long has it been there? Drawdown Map shows it on any chart: the drawdown now, the bars below the peak, the rise needed to get back, the maximum drawdown and the maximum time below a peak on this chart, and how often past drawdowns this deep got back to their peak within a set number of bars. Closed bars only, so it never repaints. Every number is verified against a separate implementation before each release. What it does Drawdown Map draws the drawdown i
FREE
What kind of day is it: a trend day, a range day, a reversal, an inside or an outside day? Day Type Map names every day on your chart, shows what today is so far, and how this symbol's past days were split between the six types. On gold over the last 250 days, 32% were range days, 17% trend-up days and 16% reversals. Free, clear, and checked against a separate implementation. What it does Each recent day is underlined and named in its own colour: trend up, trend down, range, reversal, inside or
FREE
Wick Map shows where long wicks happen on your symbol: a dot on every long upper and lower wick, a wick clock that splits them by hour of the day, and today's long wicks against the usual for the same hours. On EURUSD M15, 32% of the candles opening at 00:00 broker time had a long lower wick, against 17% over all hours. On US500 D1, long lower wicks came on 19.8% of days and long upper wicks on 11.8%. Closed bars only, so it never repaints. Every number is verified against a separate implementat
FREE
A ruler that tells you whether a move is big. Drag it over any move and it shows the size in points and percent, the number of bars and the time it took, the value per lot, and how often past spans of the same number of bars on this symbol reached that far. On gold H1, a usual 5-bar span reached 4,782 points, and 1 span in 10 reached 10,089 points. Free, clear, and checked against a separate implementation. What it does A ruler line is placed over the recent move when you attach the indicator; d
FREE
How much room is left before a funded-account challenge's loss limit? Prop Floor Monitor shows it on the chart at a glance: the daily-loss floor, the maximum-loss floor, which one is closer, and the price at which this symbol's open position would reach it. The daily reset follows the time zone you choose, with its daylight saving: the reset moment was checked against the IANA time zone database at 18,688 moments from 2024 to 2027, including every clock change, with no difference. Every number i
FREE
How big is a normal Asia, London or New York session on this symbol, and how does today's compare? Session Ranges answers from the symbol's own history: the typical and big size of each session, today's size so far as a multiple of normal, and a box around every session of the last days, tinted quiet, normal or big. Free, clear, and checked against a separate implementation. What it does Session Ranges draws a box around each Asia, London and New York session on the recent days, from the session
FREE
A candle countdown that also tells you how big the current candle already is. On gold H1, the usual 16:00 candle was 3119 points and the usual 23:00 candle 645 points: the same timeframe, very different candles by hour. Candle Timer Pulse shows the time left in the current candle and compares its size so far with the usual candle of this timeframe at this hour, from the symbol's own history. Free, clear, and checked against a separate implementation. What it does Beside the forming candle, a cou
FREE
Is today's move normal or unusual for this market? Daily Range Stats answers it from the symbol's own history: how big a typical, a big and a very big day usually is, how today ranks against past days, and where today's high or low would sit if it became one of those days. Free, clear, and checked against a separate implementation. What it does A small table on the chart shows how big a typical day, a big day (1 in 5 days) and a very big day (1 in 20 days) is on this symbol over the past days yo
FREE
Filtrele:
Değerlendirme yok
Değerlendirmeye yanıt