Multiple Timeframe Filtered MA Crossover Signals
- Indicatori
- Versione: 1.0

What makes this indicator different?
Most moving average crossover indicators on the market do one thing: they watch two moving averages cross and they fire an arrow the moment the cross happens. Every cross. Every time. Whether the market is ranging, whether the higher timeframe agrees, whether momentum supports the move, whether the price is at a logical entry point — none of that matters to them. You get arrows. Lots of arrows. Most of them useless...
This indicator was built on a different premise — that a crossover is only as valuable as the context that confirms it.
Instead of two moving averages, you can stack more than ten moving averages on a single timeframe and require all of them to be in a specific order before a This filter is one of the greatest strength of this indicator signal is considered valid. Instead of ignoring the higher timeframe, you can filter every signal through an MA trend check on any timeframe. Instead of ignoring momentum, you can require RSI and MACD to agree. Instead of ignoring where price actually is, you can require the signal to happen at a Fibonacci retracement level inside the previous higher-timeframe candle.
Combine as many or as few of these layers as your strategy demands. The result is not a flood of arrows and alerts — it is a small, deliberate set of signals that survived every filter you chose to enable.
A note on the clean chart
After you apply the indicator and finish configuring it, you will notice something: no moving averages appear on the chart. This is intentional.
The indicator draws only signal arrows — and only when you have enabled them. The moving averages that drive the logic stay hidden. The intention is to give you a chart that stays genuinely clean, so you can practise other forms of analysis on the same chart without noise competing for your attention: drawing trendlines, marking order blocks, applying other indicators, or reading price action directly.
On TradingView, hiding an indicator temporarily is trivial — you click the eye icon and it disappears until you want it back. On MetaTrader 5, that option does not exist. If you want to hide an indicator, you have to remove it from the chart and re-apply it later, which means going back and forth every time. Rather than force that workflow on you, the indicator simply never draws the MAs in the first place.
If you do want to see the moving averages on the chart, you can add them manually — one by one — using the same periods you configured in the indicator's inputs. Once you have them arranged the way you like, save the chart as a template. Next time, loading that template restores all of them in a single click. This gives you the best of both worlds: a visual reference of the MA stack when you want it, and a clean chart when you don't, without ever having to touch the indicator itself.
Seeing the MAs on the chart also lets you visually verify that the indicator is firing correctly — you can watch the exact cross of your chosen pair happen, and confirm the arrow alerts and arrows appears where you expect it to.
How the indicator works, section by section
1. Alert Configuration
Decide how a signal reaches you. Each option is independent.
-
Enable Alerts — pop-up alert window.
-
Enable Sound — plays your chosen .wav file.
-
Enable Email — sends to your terminal-configured email.
-
Enable Push — sends to your MetaTrader mobile app.
-
Enable Backtest Logging — writes diagnostic values to the Experts log for tuning.
2. Alert Filtering
-
Enable Early Signal Alerts — receive Early signal alerts.
-
Enable Full Signal Alerts — receive Full signal alerts.
-
Suppress Early Alert if Full Fires Same Bar — when Early and Full fire on the same bar for the same direction, only the Full alert is sent, avoiding a duplicate notification.
3. Arrow Appearance
-
Draw Arrows — No Arrows (alerts only, cleanest chart), Early + Full Signals, or Full Signals Only.
-
Arrow Size — 1 to 5.
-
Arrow Distance from Candle — pixel offset for the arrows.
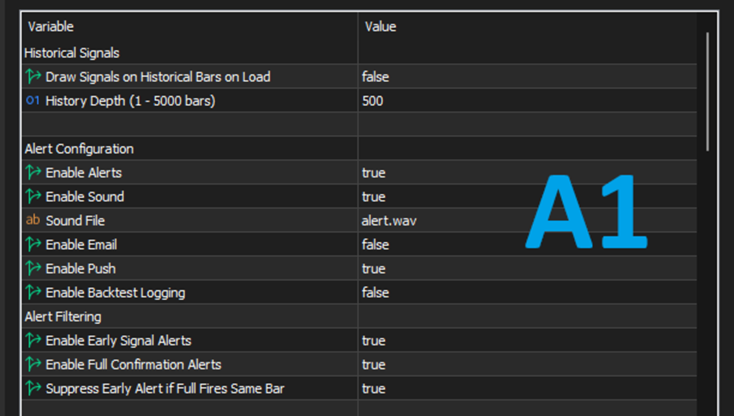
Image A1—Screenshot showing the indicator's arrow input section on the indicator's menu.
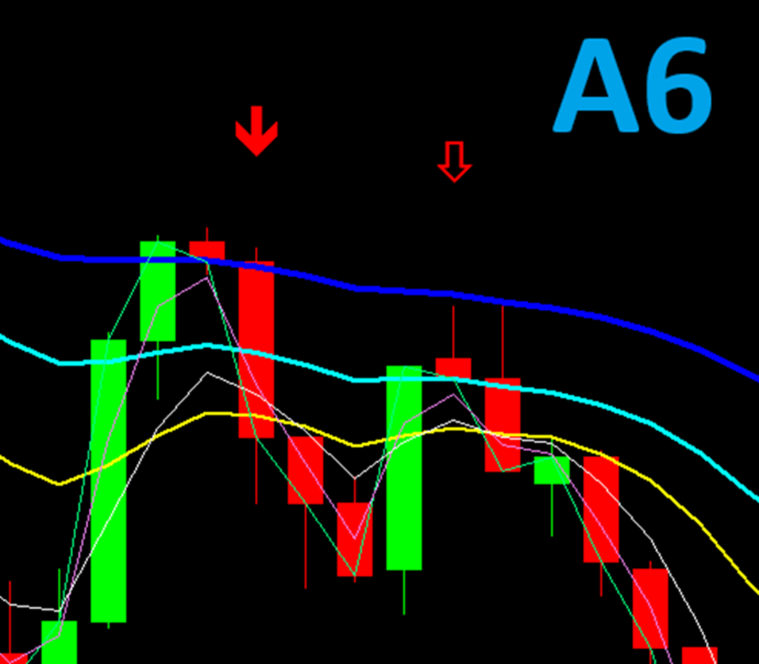
Image A6—Screenshot showing the indicator's arrow appearance, with the hollow arrows representing the early signals and the full body colored arrows representing full signals.
4. Signal Filter
-
Signal Mode — Long Only, Short Only, or Both Directions.
-
Show Early Signals — master switch for the Early subsystem.
5. Early Signal Configuration
The Early signal is designed to detect the crossover earlier in its development — before the full validation stack lines up — giving you a heads-up that a Full signal may be forming.
-
Early Fast MA — the fast moving average for the Early cross.
-
Early Slow MA — the slow moving average for the Early cross.
Both are chosen from a large library that includes Exponential, Weighted, and Simple moving averages at every common period from 1 up to 200. You are not restricted to "EMA 9 and EMA 21" or any other preset pairing — pick whichever pair best matches the market you trade.
6. Full Signal Configuration
The Full signal is the confirmed crossover — the one that fires only when the crossover has occurred and all enabled validation and filter layers have agreed.
-
Full Fast MA — the fast moving average for the Full cross.
-
Full Slow MA — the slow moving average for the Full cross.
You can run a completely different MA pair here than you use for Early, which means you can build a two-stage system: an aggressive Early pair that gets your attention, and a stricter Full pair that confirms the trade.
7. Signal Timing
This is one of the most important settings in the entire indicator, and it deserves careful attention.
-
Intrabar — signals are detected on the live, still-forming candle. The fastest detection but the noisiest — the candle can still change. Alerts fire, but no arrows are drawn in this mode, by design.
-
On Close of Cross Candle — the default. Signals are detected only after the crossover candle has closed. Arrows are drawn. No repainting.
-
One Candle After Close — the strictest mode. The crossover must have occurred on the previous closed candle and the relationship must still hold on the current closed candle. This eliminates false crosses that immediately reverse.
8. The MA Validation Order — the heart of the indicator
This is where the indicator leaves every other crossover tool behind. There are two identical sections in the inputs:
-
Early Signal :: MA Validation Order (Buy)
-
Full Signal :: MA Validation Order (Buy)
Each contains the full MA library (every EMA, WMA, and SMA from period 1 up to 200). For each MA you get two inputs: an Enable checkbox and a Position number.
How the position numbering works
-
You enable the MAs you want to use — say, EMA 14, EMA 5, EMA 25, and EMA 50.
-
You assign each one a position number. The number is not the MA period — it is the slot that MA occupies in your validation stack. You are telling the indicator which MA is the strongest leg of your setup, which is second, and so on.
-
When a candidate crossover fires, the indicator collects the current values of every enabled MA, sorts them by the positions you assigned, and checks whether the sorted values are in the exact order you described:
-
Buy signal — values must be in strictly descending order. The MA in the top slot must currently have the highest value, the next slot the next-highest, and so on.
-
Sell signal — the same check in reverse: strictly ascending order.
-
-
If the order does not match exactly, the signal is rejected. No arrow, no alert.
A concrete example
You want a bullish stack to look like this on the chart:
EMA 14 (top — highest value) EMA 5 EMA 25 EMA 50 (bottom — lowest value)
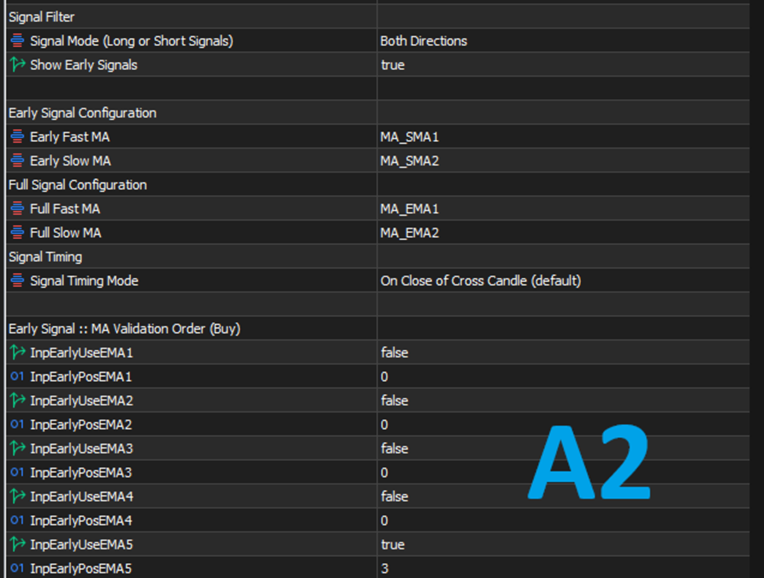
You also want the early crossover to be 1SMA crossing 2 SMA upwards for bullish signal and 1EMA crossing 2EMA upwards for full confirmation signal.
You would set:
| MA | Enable | Position |
|---|---|---|
| EMA 14 | yes | 4 |
| EMA 5 | yes | 3 |
| EMA 25 | yes | 2 |
| EMA 50 | yes | 1 |
The indicator sorts these by position, giving [EMA 14, EMA 5, EMA 25, EMA 50] . For a Buy signal it then requires:
MA Order => EMA 14 > EMA 5 > EMA 25 > EMA 50
If that chain holds at the moment of the crossover, the Buy is valid. If EMA 14 pokes above EMA 5, or EMA 25 above EMA 14, the signal is discarded.
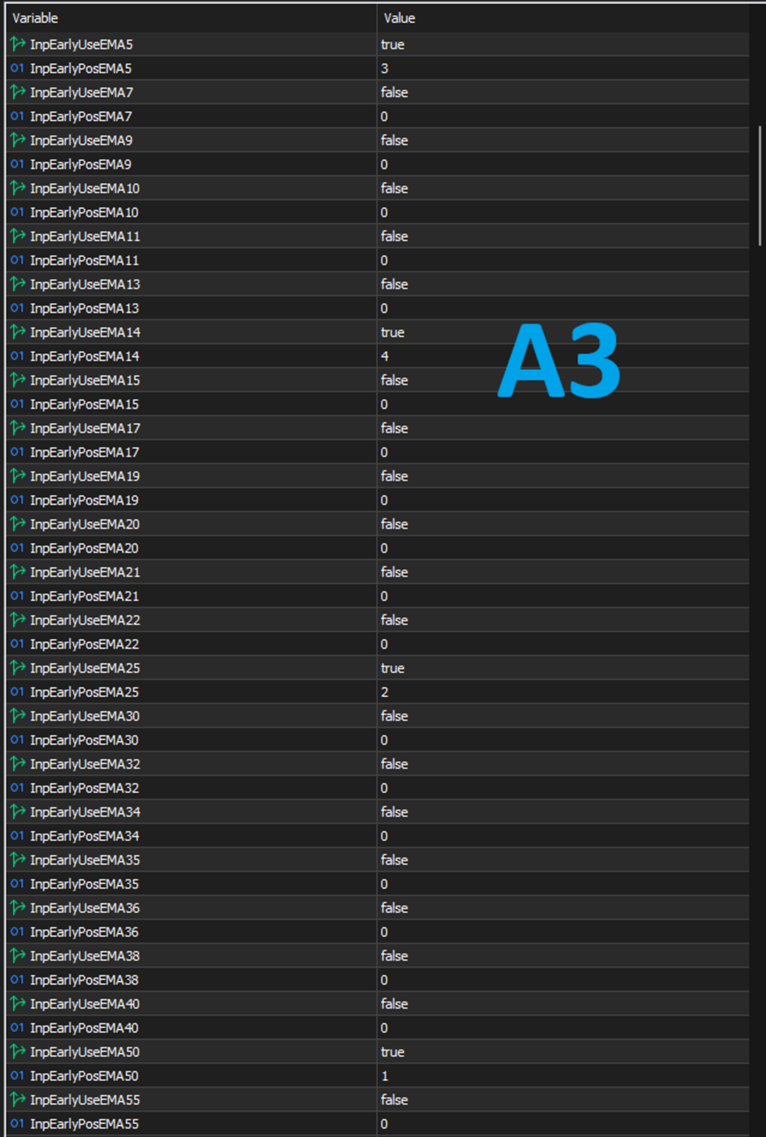
Image A3 — showing the indicator's MA validation ordersettings input section on the indicator's menu.
Image A6 — showing how the given example above would look like for a bearish signal. The thick dark blue line at the top is the 50 EMA and the blue aqua line following beneath it is the 25 EMA, followed by 5 EMA which is a thin white line then lastly followed by 14 EMA which is the yellow line. The green and purple lines crossing each other are 1 EMA and 2 EMA respectively. There aren't any visible moving averages on the chart representing 1 SMA and 2 SMA.
Note: If you want to include the moving averages involved in the crossover on the MA validation order section, you can but only the Slow MA, if you include the fast MA asa well, the logic would not work.
Why this matters
Two-MA crossover indicators fail in one specific way: they generate signals in choppy, non-trending conditions where the two MAs tangle and cross repeatedly. By requiring a full stack of MAs to line up at the same moment, this indicator refuses to fire in those conditions.
You are effectively saying: "Only tell me about crossovers that happen when the market structure supports them."
Because you can enable up to ten or more MAs — from the 1-period SMA to the 200-period EMA — the depth of validation is entirely up to you. Some traders use two MAs for a fast, loose filter. Others use eight or nine for an extremely strict one.
9. Signals by Market Direction (Filter by MAs)
This is the higher-timeframe trend filter. It is separate from the validation stack above — validation checks the current timeframe, this checks another timeframe.
-
Enable Signals by Trend Direction Only — on/off.
-
Filter Mode — Include Price (chains Price > MA1 > MA2 > ... > MAn for buys) or MA Only (chains MA1 > MA2 > ... > MAn , ignoring price).
-
MA(s) Filter Timeframe — the timeframe the filter MAs are evaluated on. Set this to whatever higher timeframe defines your trend.
-
Use First through Seventh Filter MA — up to seven filter MAs, each with its own enable checkbox and MA type.
If you trade M5 but want to only take signals in the direction of the H1 trend, set the filter timeframe to H1, enable two filter MAs (say EMA 50 and EMA 200), and use MA Only mode. Every signal from your M5 engine is now checked against H1 first. If H1 says down and your signal is a buy, it is silently discarded.
10. MTF RSI Filter
The same principle applied to momentum.
-
Enable RSI Filter — on/off.
-
RSI Timeframe — RSI is evaluated on a completely different timeframe from your chart.
-
RSI Period, RSI Applied Price — standard RSI configuration.
-
RSI Buy Threshold — Buy signals pass only if RSI is at or below this level (default 30).
-
RSI Sell Threshold — Sell signals pass only if RSI is at or above this level (default 70).
11. MTF MACD Filter
-
Enable MACD Filter — on/off.
-
MACD Timeframe, MACD Fast, MACD Slow, MACD Signal, MACD Applied Price — standard MACD configuration on any timeframe.
-
Crossover Level — Below Zero (momentum reversal from a low) or Above Zero (continuation in an established trend).
12. MTF Previous Candle Price Trade Direction Filter
This filter implements what is often called the one-candle theory — a single completed higher-timeframe candle is enough to define a tradable range for the session or day. After a strong directional candle, price often retraces back into it before the trend continues. Wait for the retracement, and accept a crossover only when it fires inside a specific area of that candle, and you get an entry with natural context and a natural invalidation point.
The filter is off by default. When enabled, it becomes the final arbiter: any signal that does not fit inside the range you have defined is silently discarded, no matter how many other filters agreed.
The elements you configure
1. Previous Candle Timeframe — the timeframe whose most recently closed candle defines the reference. Typically H4, D1, or W1. Must be higher than your chart timeframe; a lower setting is blocked on load with a clear error message.
2. Fibonacci Anchor — which part of the previous candle defines the 0% and 100% boundaries of the Fibonacci grid:
-
Wick to Wick — from the candle's High (100%) down to its Low (0%). Wicks included.
-
Body to Body — from the top of the body (100%) down to the bottom (0%). Wicks ignored. Useful when the previous candle had unusually long wicks, since it compresses the levels into the meaningful part of the candle.
3. Fibonacci Level — the retracement level price should reach before a crossover is accepted:
| Level | Meaning |
|---|---|
| 23.6% | Shallowest retracement |
| 38.2% | Moderate |
| 50.0% | Mid-candle |
| 61.8% | Deep |
| 78.6% | Very deep |
| 100.0% | Full retracement to the opposite extreme |
| 107.0% | Sweep past the opposite extreme — the stop-hunt zone |
The 107% level exists for a specific reason. Many traders place stop losses just below the low of a bullish candle, or just above the high of a bearish candle. Price frequently spikes through those levels to trigger stops, then reverses and resumes the trend. If you want to catch that move, 107% is the level to select.
4. Price Reference Level — the second boundary of the acceptance zone, taken from the previous candle's actual OHLC: Open, High, Low, or Close.
The Fib level and the Reference level together define a zone. The crossover must occur with price inside that zone.
How the zone is built
Two prices are extracted from the previous candle:
-
Fib Price — the value of your chosen Fibonacci level across the anchor.
-
Reference Price — the value of your chosen OHLC level.
The zone is the range between those two prices, sorted so it is always well-defined.
-
Buy signal: the previous HTF candle must be bullish. Zone runs between the Fib level and the Reference level.
-
Sell signal: the previous HTF candle must be bearish. Same construction, mirrored.
If the previous candle's direction does not match the signal, the signal is rejected before the zone is even computed.
Worked examples
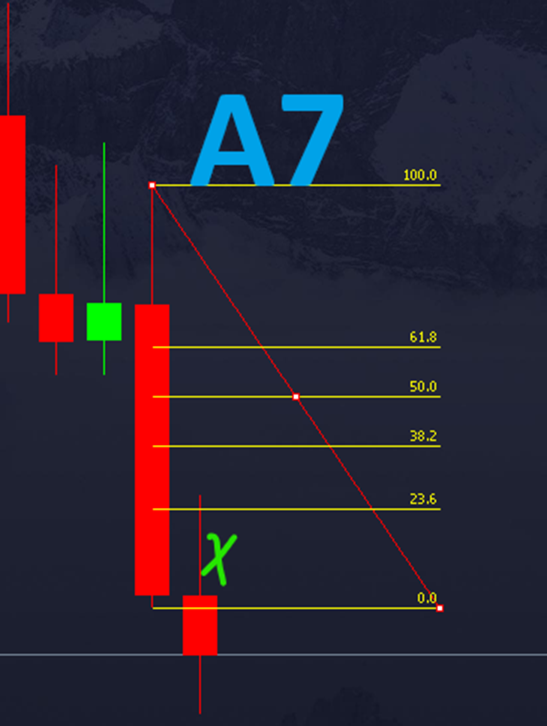
Look at the reference image A7. The bearish previous candle is the large red body on the left. The Fibonacci grid is drawn from the 100% line at the top (high) to the 0% line at the bottom (low). The blue X marks the exact crossover point — it fired inside the 23.6% level of the previous bearish candle. Because the previous candle was bearish and the signal was a sell that occurred inside the retracement zone, the filter accepted it. The green X below shows where a subsequent signal would have been rejected — price had already broken past the 23.6% level, so the retracement was spent.
The rule that surprises people — dips are forgiven
This is the single most important thing to understand about this filter.
The check is evaluated only at the moment of the crossover. Past price action within the current period does not disqualify a signal.
If you are new to this one-candle trading method, here is a practical starting point. If you choose the H4 candle as your reference, pair it with the 1-minute timeframe for the crossover signals. If you choose the D1 candle as your reference, pair it with the 15-minute timeframe for the crossover signals. If you choose the W1 candle as your reference, pair it with the H4 timeframe for the crossover signals. These pairings are a starting point, not a rule. You are free to combine any higher-timeframe reference candle with any lower timeframe for the crossover signals — whatever best fits the market you trade and the pace at which you like to work. But if you have never tried this method before, the combinations above are a good place to begin exploring it.
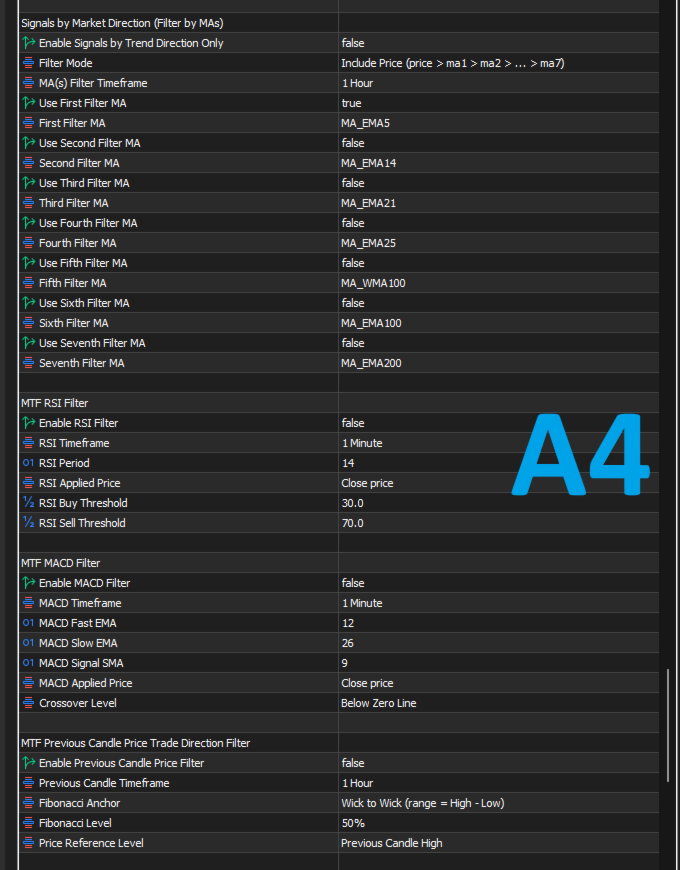
Image A4 — showing the indicator's MTF signals filter on the indicator's menu.
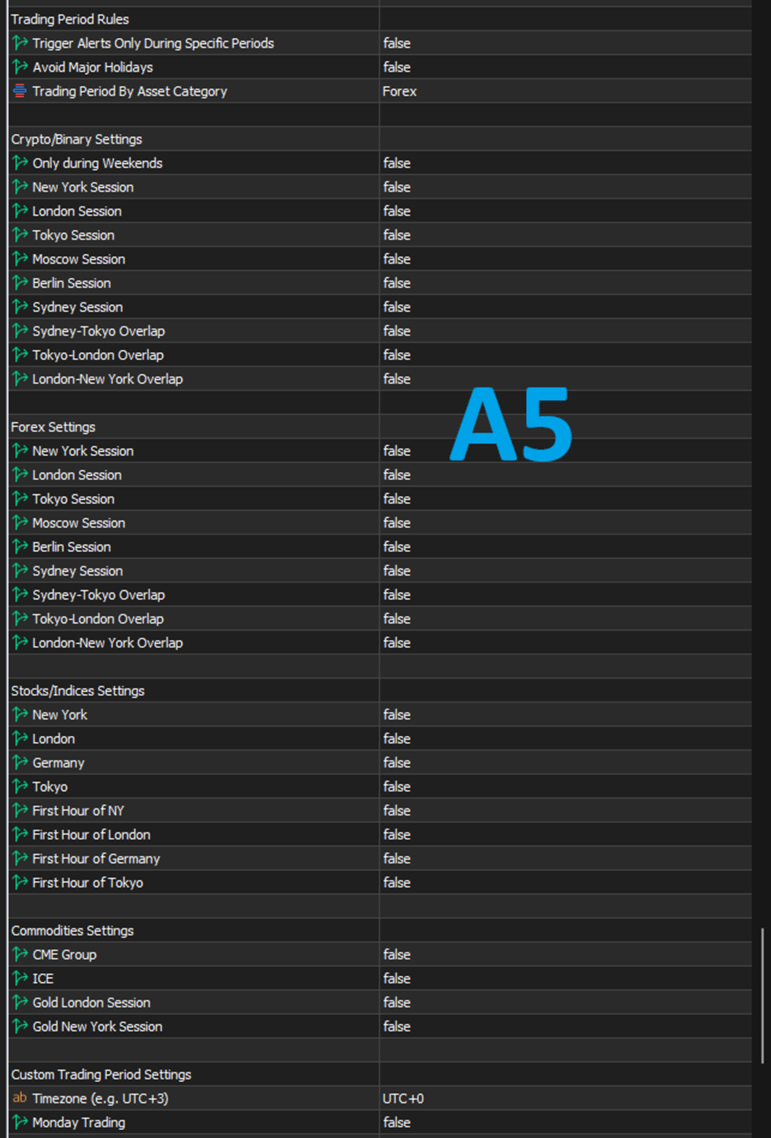
13. Trading Period Rules
Restrict signals to specific hours — London session, the first hour of the New York open, and so on.
-
Trigger Alerts Only During Specific Periods — master on/off.
-
Avoid Major Holidays — suppresses signals during New Year, Christmas, US Independence Day, and US Thanksgiving.
-
Trading Period By Asset Category — pick the category that matches your instrument:
-
Crypto / Binary — including a weekends-only option.
-
Forex — New York, London, Tokyo, Moscow, Berlin, Sydney sessions, plus three overlap periods (Sydney–Tokyo, Tokyo–London, London–New York).
-
Stocks / Indices — NYSE, LSE, FWB, and TSE hours, plus first-hour-after-open filters.
-
Commodities — CME, ICE, London Gold, and New York Gold sessions.
-
Custom — your own day-by-day schedule with a timezone offset, start hour, and end hour per day.
-
How to combine the layers
The real strength of this indicator is not any single filter. It is that all the filters are independent and composable. You decide how strict you want to be.
A simple configuration looks like this:
-
Multiple MAs in the validation stack (say four or five).
-
On Close timing.
-
Everything else off.
You will get more signals, filtered primarily by the MA structure.
A strict configuration looks like this:
-
Six or more MAs in the validation stack.
-
One Candle After Close timing.
-
Trend filter on H4 using two MAs.
-
RSI filter on M15 with default thresholds.
-
Previous candle filter on H1 at the 50% level.
-
Trading periods restricted to London and New York.
You will get very few signals. Every one of them will have passed every single layer you turned on.
The indicator does not force a particular trading style on you. It gives you the building blocks and lets you assemble the combination that matches the way you actually trade.
Image A5 — showing the indicator'ssignal filter section by trading period rules on the indicator's menu.
Part Four — What you receive, and what to expect
-
A clean chart. All signals are drawn as non-repainting arrows on closed bars (except in Intrabar mode, where arrows are deliberately suppressed). Your chart remains uncluttered enough to draw trendlines and load other indicators alongside this one.
-
Multi-channel alerts. Pop-up, sound, email, and mobile push are all available, independently configurable.
-
No repainting in On-Close and Confirmed modes. Once an arrow is drawn, it stays drawn.
-
Cross-instrument compatibility. The indicator works on any instrument MetaTrader 5 supports — forex pairs, metals, indices, commodities, and crypto — on any timeframe.
-
Full input documentation. Every input in the properties window carries a descriptive label, so you can configure it without constantly referring back to a manual.
Who this is for
This tool is designed for the trader who has already realized that more signals is not the same as better signals. If you have tried plain crossover indicators and found yourself scrolling back through history thinking "why did it fire there?" — this indicator was built to answer that question.
It is not a strategy in itself. It does not tell you where to place your stop loss or how much size to take. What it does is filter a common, well-understood signal type through the context that determines whether the signal is meaningful — and give you the option to make that filter as tight as you want.
Set it loose if you want a broad view of the market. Set it strict if you want a shortlist of setups that agree with every condition you care about. Either way, you are in control of the process, and the indicator is transparent about every signal it either accepts or rejects.