Hourly Spread Map
- Indicatori
- Versione: 1.0

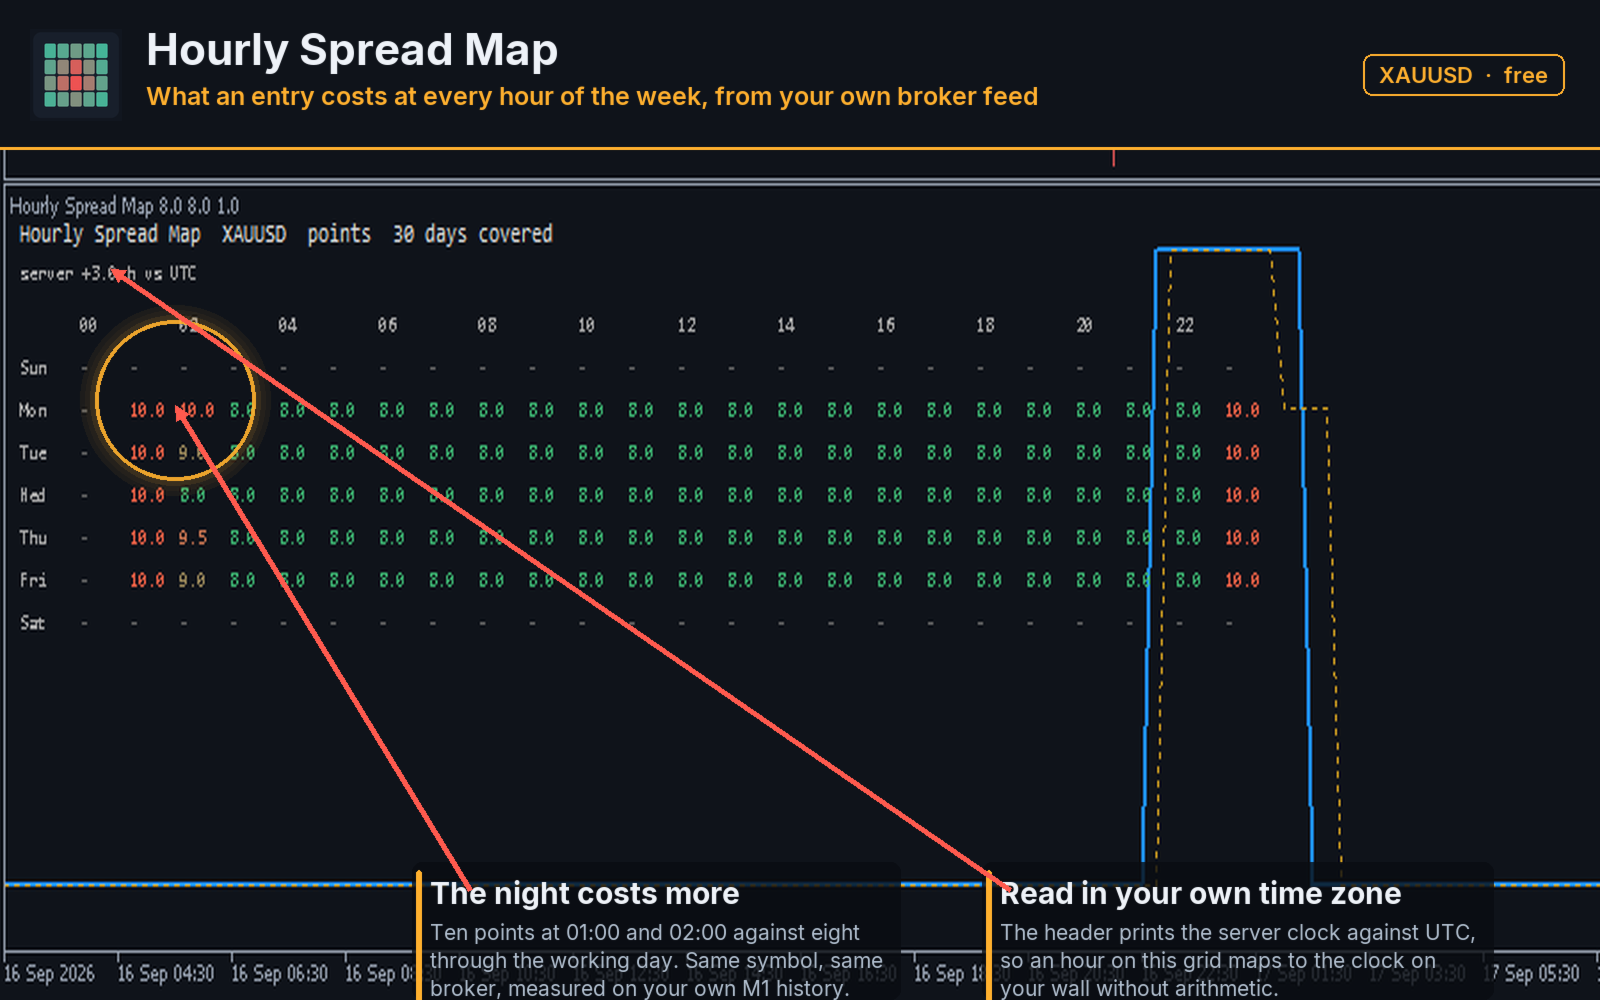
Hourly Spread Map answers one question: at which hours does this symbol cost more to enter, and by how much. It reads the spread field that the terminal stores in every closed M1 bar of your own broker feed, sorts those measurements into 24 hours by 7 days of the week, and shows the result as a grid in the indicator sub-window.
What It Measures
Every closed M1 bar carries one spread measurement. The indicator collects them over the period you choose, groups them by the hour and weekday of the bar, and computes three things per cell: the median spread, the 90th percentile, and the share of measurements above a ceiling you set.
The median tells you the normal cost of that hour. The 90th percentile tells you how bad the hour gets when it goes bad. The share above the ceiling tells you how often that hour crosses a level you consider unacceptable. You switch between the three with one input.
The Grid
Seven rows, one per weekday, twenty four columns, one per hour of the broker's server clock. Cheaper cells are green, more expensive ones red, and the colour scale is built from your own data rather than from a fixed table, so the picture stays informative whether the symbol trades at two points or at two hundred.
The header line prints the offset of the server clock against UTC, so the grid translates to the clock on your own wall without arithmetic on your side.
Cost In Account Currency
A spread in points means little until it is expressed in the currency of your account. Set the volume you normally trade and the grid switches to account currency, using the tick value and tick size the broker reports for the symbol. If you pay commission, enter it per lot round turn and it is added to every figure, because the cost of entering a position is spread plus commission, not spread alone.
When A Cell Stays Empty
A cell shows a dash instead of a number until it has collected the minimum number of samples you require. Three measurements do not make a median, and a number computed from three measurements looks exactly like a number computed from three thousand, which is the reason the dash exists.
The same principle covers two more cases. If your broker does not write spread into M1 bars at all, the panel says so in plain words rather than drawing a grid of zeros. If the broker does not report tick value for the symbol, the indicator stays in points and tells you why, rather than printing a figure that would be a guess.
Reading The Lines
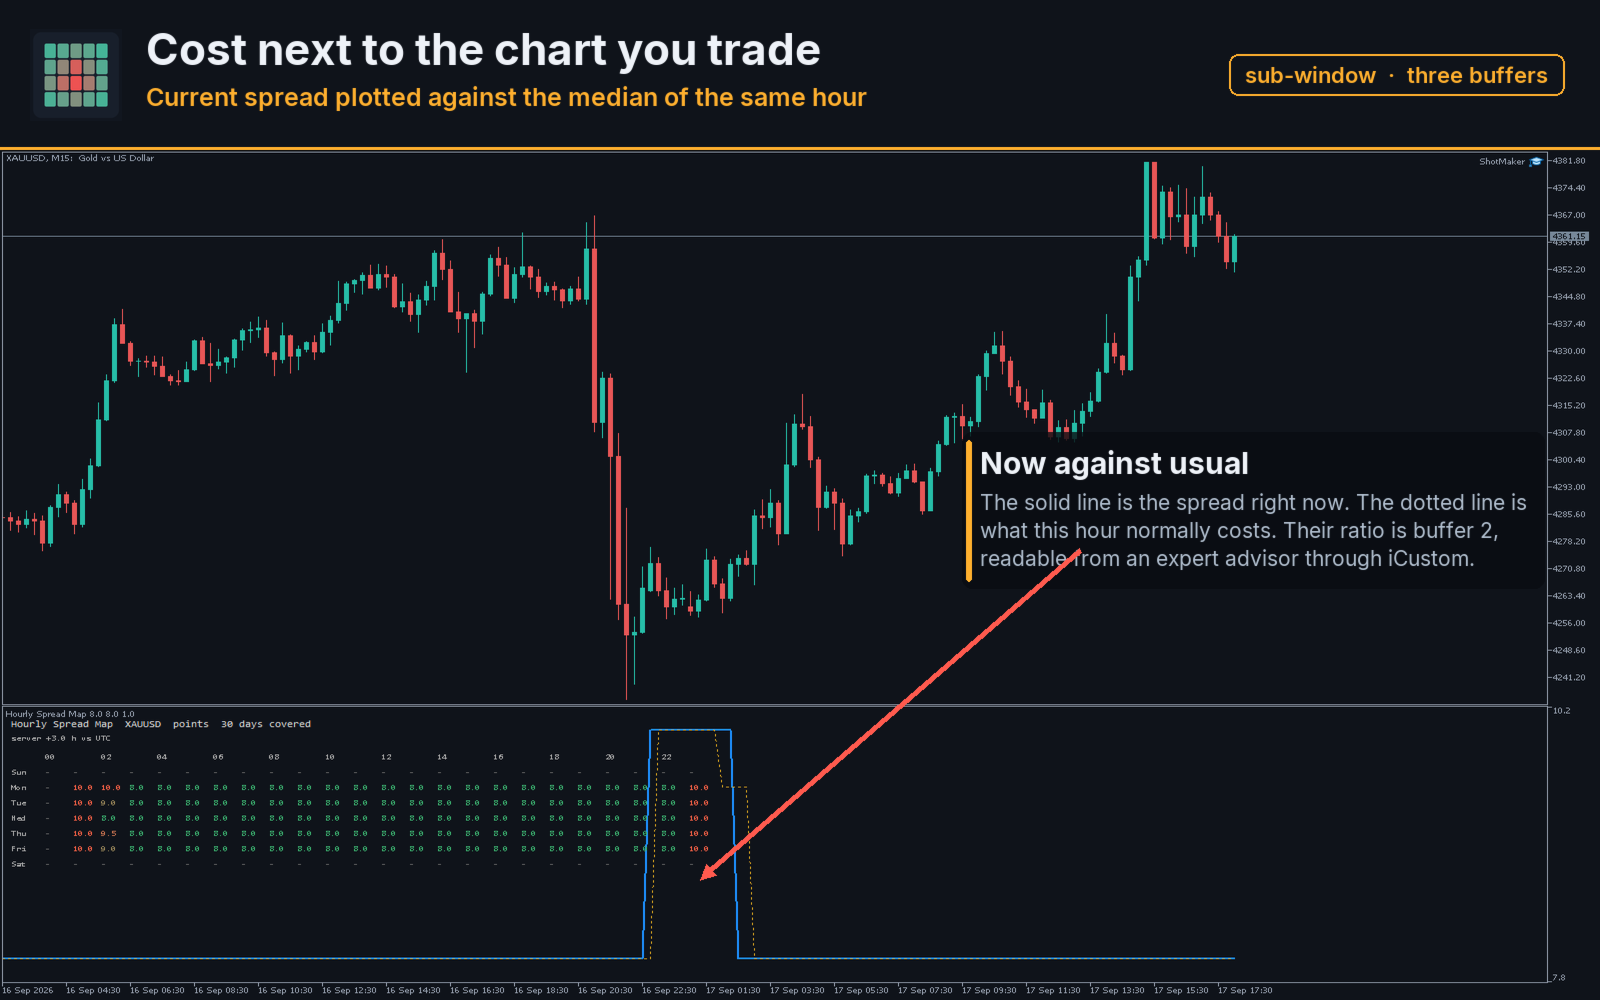
Three buffers are plotted in the sub-window. The first is the spread of the current bar. The second is the median of the cell that bar belongs to, which is the usual cost of this hour on this weekday. When the first runs above the second, the market is charging more than it normally charges at this time.
The third buffer is their ratio, plotted invisibly and available to any expert advisor through iCustom as buffer index 2. A value of 1.0 means the spread is exactly normal for the hour, 2.0 means twice the usual.
Calculation
Everything is computed from closed M1 bars. The bar that is still forming never enters the statistics, because its spread field is not final until it closes. The whole map is rebuilt when a new M1 bar closes, not on every tick.
No state is written to disk. Nothing is cached between sessions. Delete the indicator, restart the terminal, put it back on the chart, and you get the same numbers from the same history, because the only input is the history your terminal already holds.
Every object drawn on the chart carries a prefix you control, and all of them are removed when the indicator is taken off the chart.
Input Parameters
- HistoryDays - days of M1 history to scan
- MaxBarsToScan - hard cap on the number of M1 bars read
- MinSamplesPerCell - minimum measurements before a cell shows a number
- CostUnit - points or account currency
- VolumeForMoney - volume used when converting to account currency
- CommissionPerLotRoundTurn - commission per lot, round turn
- SpreadCeilingPoints - ceiling used by the share mode
- ShowGrid, GridMode, GridCorner, GridXOffset, GridYOffset, GridFontSize
- ColorLow, ColorHigh, ColorNoData
- ObjectPrefix - prefix for every chart object created
Requirements
MetaTrader 5, any symbol, any chart timeframe. The indicator reads M1 history of the current symbol, so the terminal needs that history downloaded. Works on demo and live accounts alike.
Support
Questions about parameters or about a specific symbol: write in the comments of this product, I read that thread.