Directional Impulse
- Indicatori
- Versione: 1.4
- Aggiornato: 12 settembre 2026

Directional Impulse™
One formula. Every candle. Instantly legible.
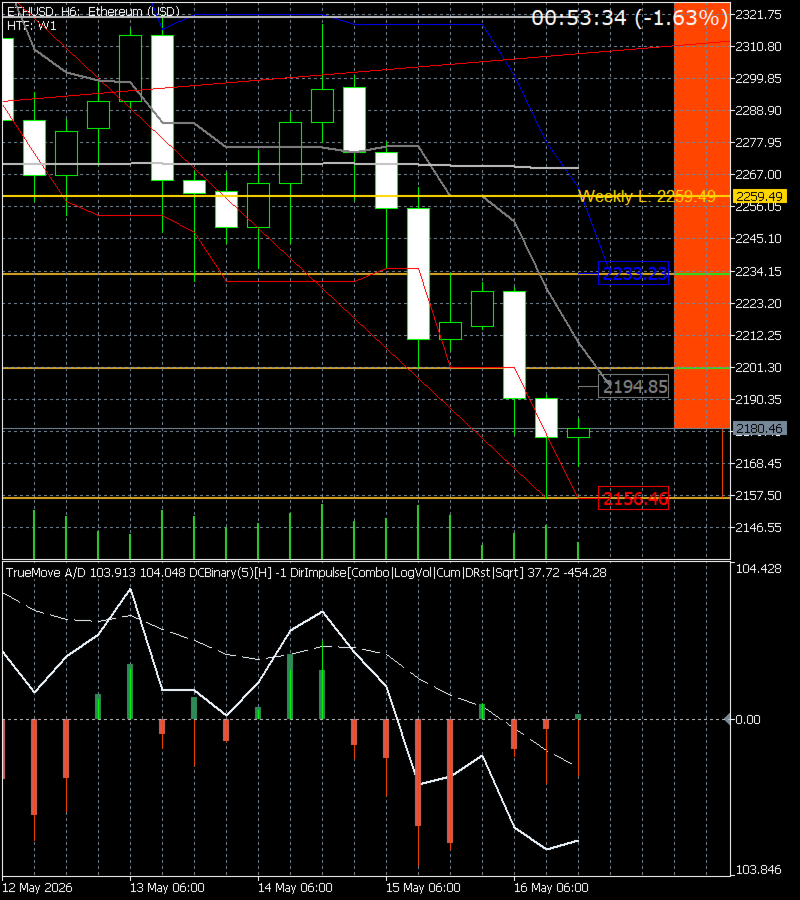
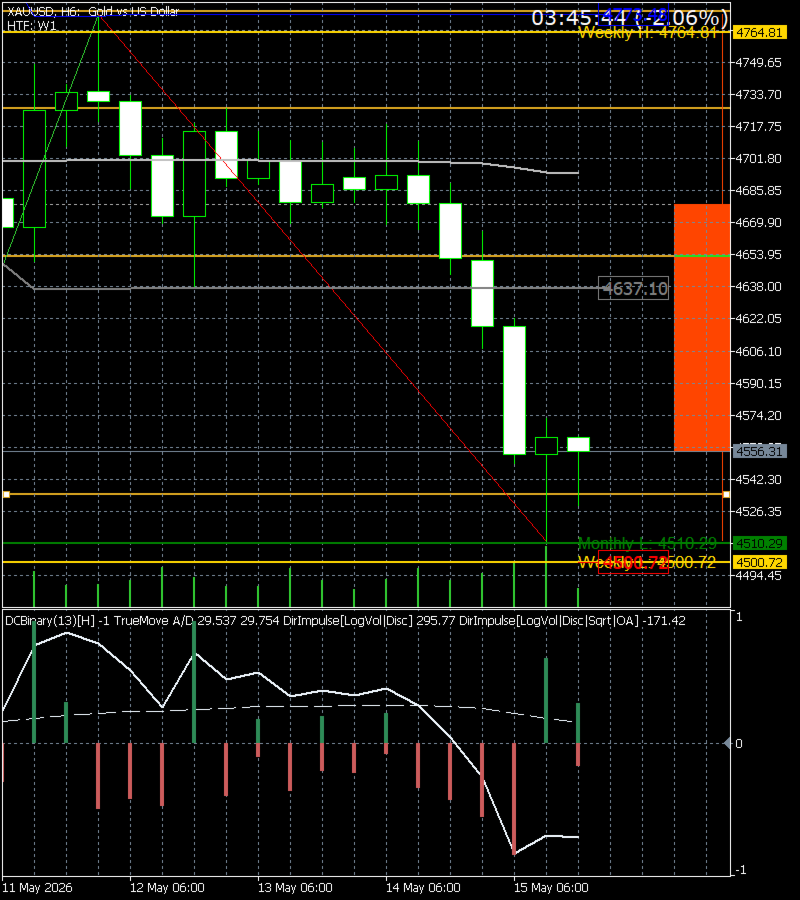
Most indicators tell you where price is or how fast it's moving. Directional Impulse™ tells you something different: who won this candle, and by how much.
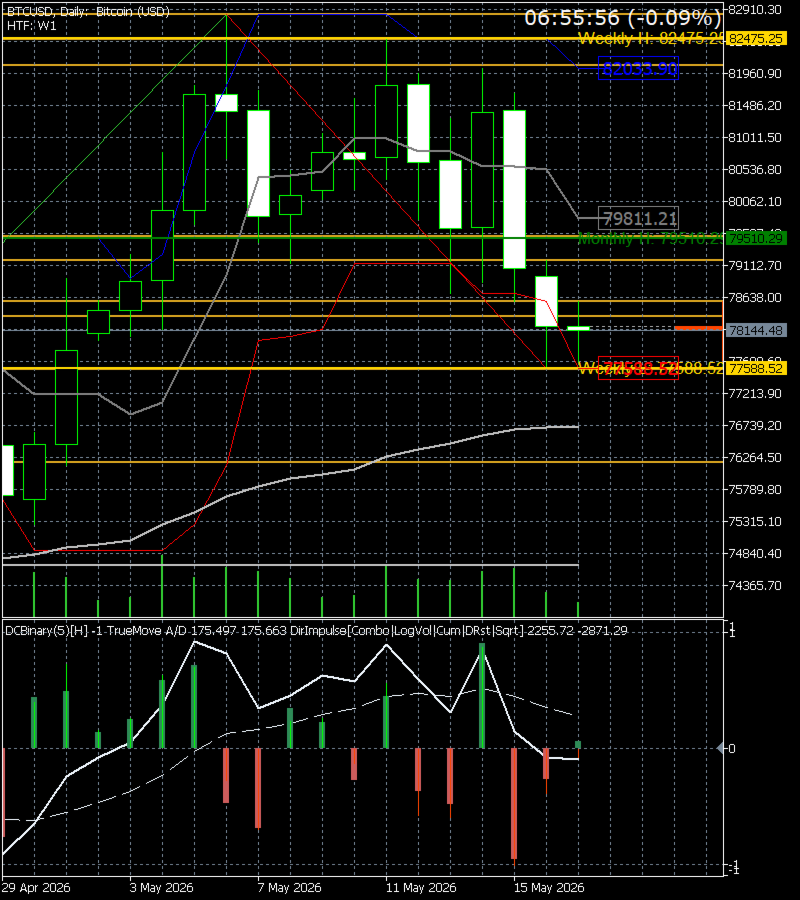
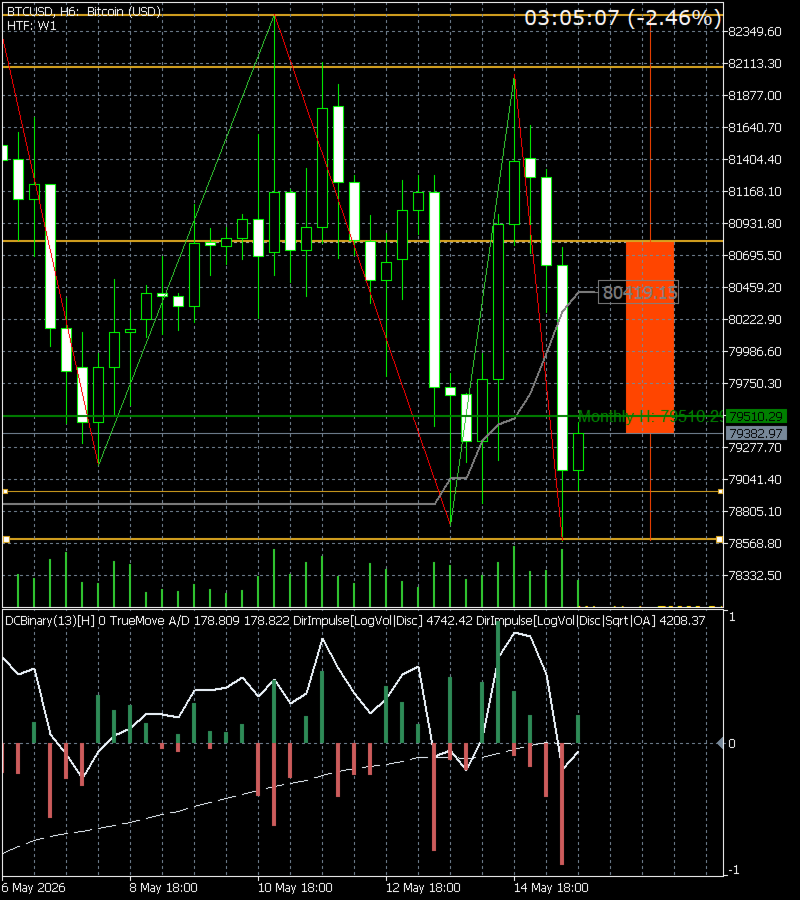
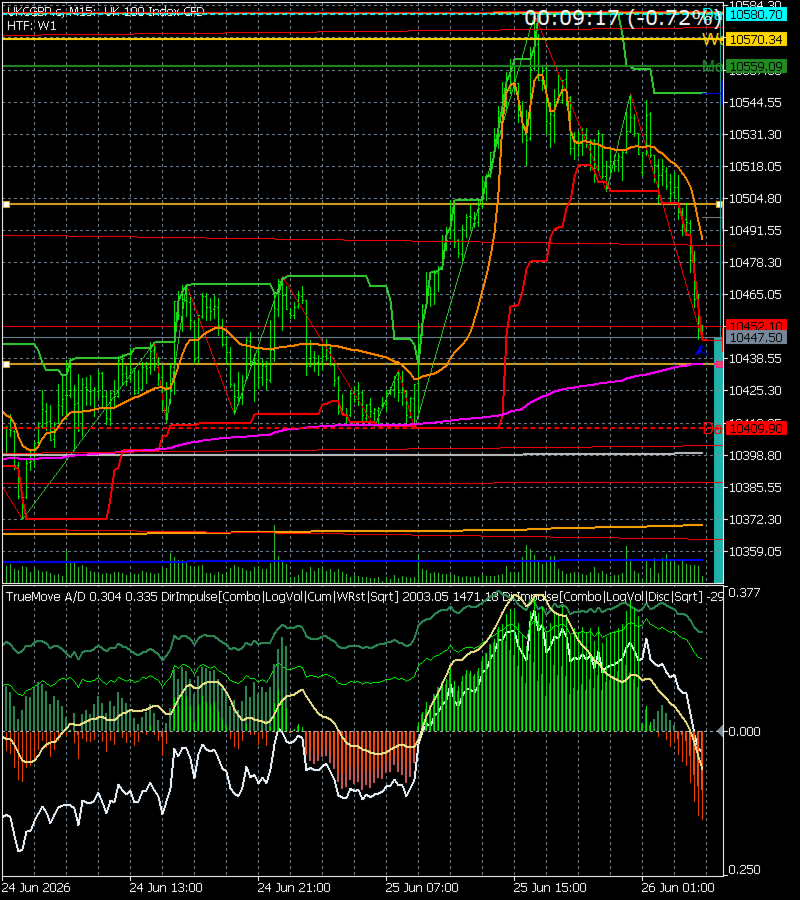
Built on an original formula — X = (2C − H − L) × (H − L) & X = (C − O) x (H − L) — it multiplies directional bias by the bar's full range rather than normalising it away like every preceding indicator in this lineage. The result is a signed energy measure for each bar that captures both conviction and volatility simultaneously. A signed square root transform scales the output to linear price units, making the full distribution of bars legible rather than dominated by one or two outlier moves.
The Combo version plots two layers simultaneously:
- Midpoint Anchor (wide bar) — flips first when internal pressure shifts. First to detect a tussle forming inside a bullish or bearish candle.
- Open Anchor (narrow bar) — flips only when the candle body reverses. Confirms the full takeover.
What you can see that you couldn't before:
- A bullish candle with a large upper wick reading as bearish — because sellers drove price back below the range midpoint before the close
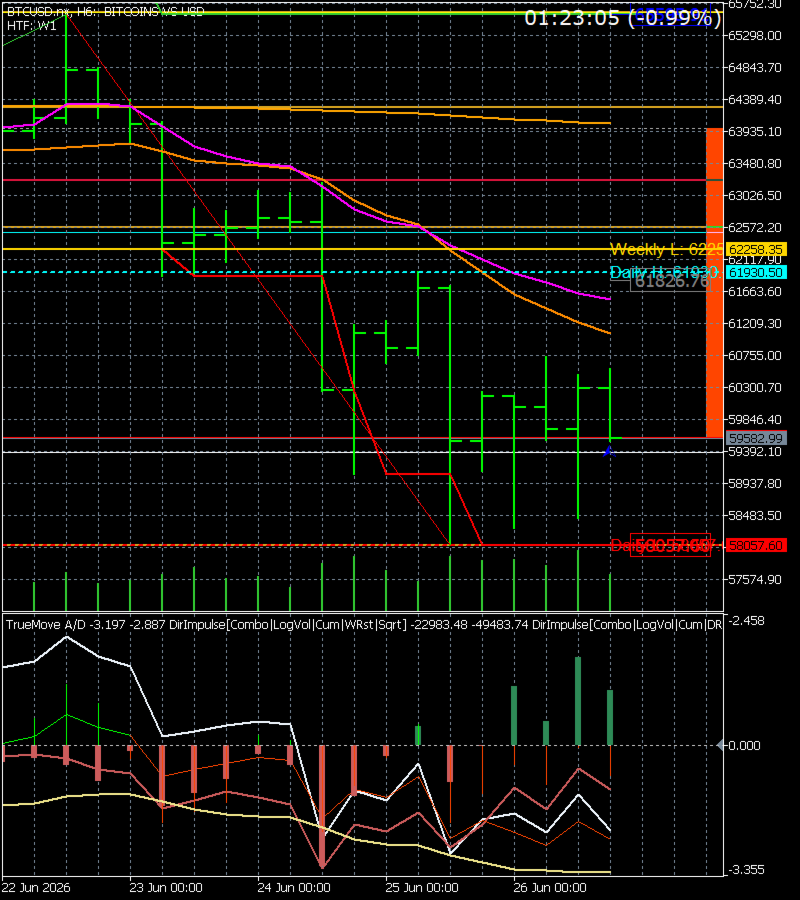
- Fading impulse bars (same direction, shrinking size) signaling exhaustion before price confirms it
- Anchor divergence — midpoint flipped, body still positive — flagging the exact moment internal pressure shifted
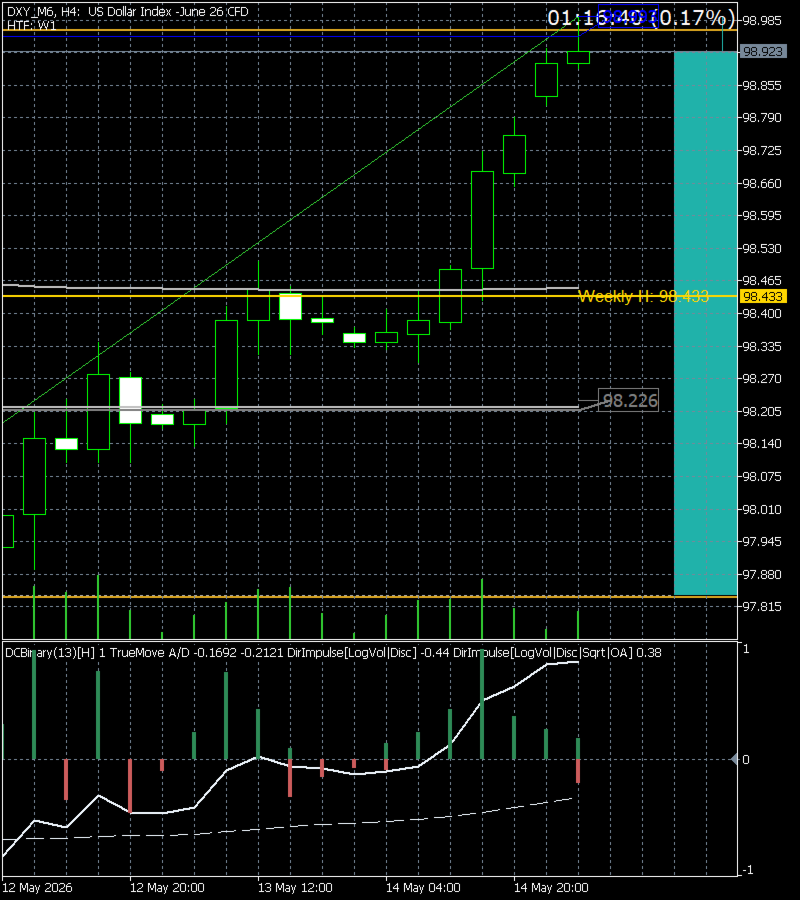
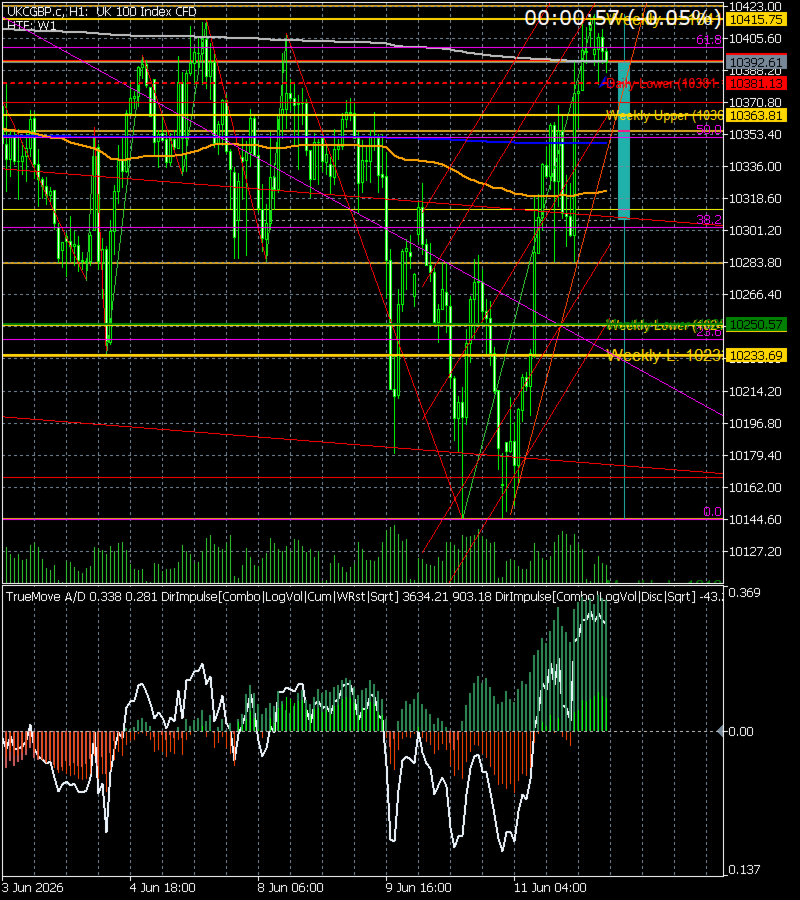
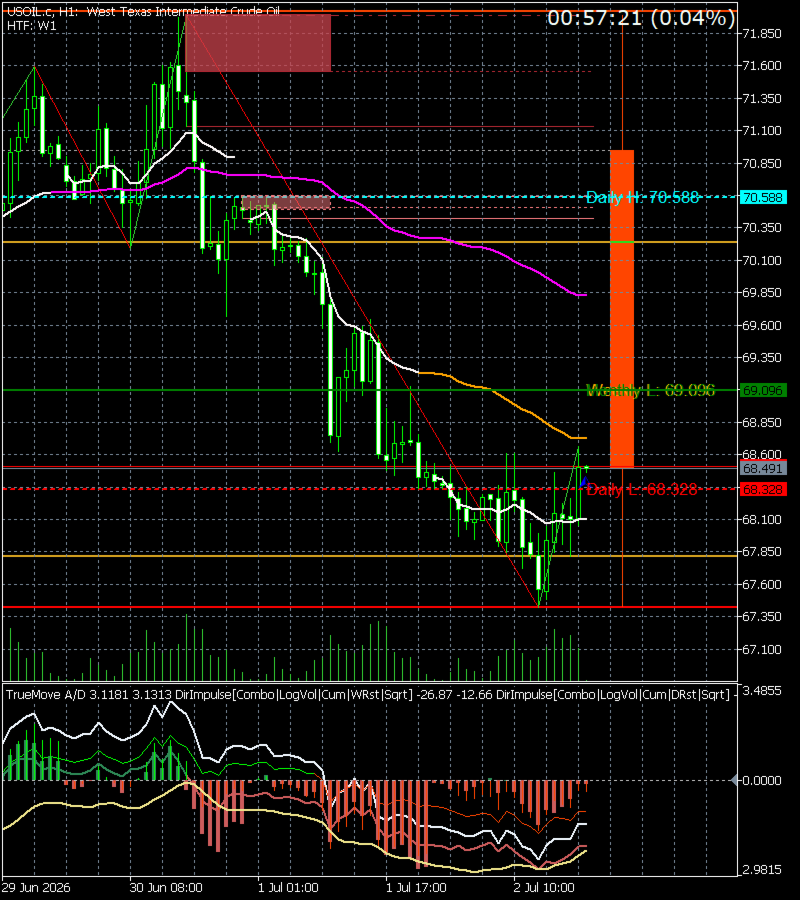
Output modes: Discrete (per-bar), Cumulative with Daily / Weekly / Monthly / No reset. Volume modes: Raw, Relative, Log (recommended), Log Relative, Tick.
Recommended settings: Cumulative with Daily reset (Main). Cumulative with Weekly reset (secondary). Discrete (useful for per bar analysis, but cumulative gives more directional output, particularly on lower timeframes). Cumulative with Monthly reset (tertiary)
Peer-reviewed and published. Full methodology available at:
📄 ssrn.com/abstract=7050140
DOI: 10.2139/ssrn.7050140 | Author: Ebuka Obiakor
For a free complementary tool, check out the True Move A/D: https://www.mql5.com/en/market/product/187178
For a tool to help you protect against drawdown (plus many more perks: Position sizing, Total position loss, Effective leverage calculation, etc.), check out : https://www.mql5.com/en/market/product/169269