
Multi Macd HD MT4
- Indicatori
-
Mostafa Ghanbari
 ✅ Fondatore di MGH Products
✅ Ingegnere del Software | Sviluppatore di Indicatori Personalizzati ed Expert Advisor (EA)
✅ Autore pubblicato su MQL5.com - Versione: 1.1
- Aggiornato: 4 giugno 2026
- Attivazioni: 5
Multi-Timeframe MACD Hidden Divergence Detector
The trend continuation signal most traders never see — now detected automatically across 6 timeframes.
Overview
Regular divergence tells you when a trend may be reversing. Hidden divergence tells you when it is about to continue — and it is the signal that professional trend-following traders rely on most. The problem is that hidden divergence is significantly harder to spot than regular divergence, and virtually no indicator on MQL5 Market detects it accurately across multiple timeframes simultaneously.
MGH-MultiMACD-HD changes that entirely. Built on the same proprietary multi-timeframe engine as MGH-MultiMACD-RD, this indicator is dedicated exclusively to hidden divergence detection — monitoring up to 6 timeframes at once, drawing precise divergence lines on both the price chart and the MACD window, and alerting you the moment a confirmed setup forms. All without repainting.
What Is Hidden Divergence — And Why Does It Matter?
Most traders learn regular divergence early in their education. Fewer learn hidden divergence. And almost none have a tool that detects it reliably.
Hidden bullish divergence occurs when price makes a higher low while MACD makes a lower low. It signals that the underlying bullish momentum is intact despite a surface-level pullback — and that the trend is likely to resume upward.
Hidden bearish divergence occurs when price makes a lower high while MACD makes a higher high. It signals that selling pressure remains dominant beneath a brief corrective bounce — and that the downtrend is likely to continue.
These are not reversal signals. They are trend continuation signals — among the highest-probability setups available to technical traders, appearing consistently across all instruments and all timeframes. The challenge has always been detecting them accurately and in real time. MGH-MultiMACD-HD solves that challenge completely.
Why Most Hidden Divergence Tools Fail
The reason hidden divergence detection is rarely implemented well comes down to three core problems that most indicators never address:
- Single-timeframe blindness — they show you hidden divergence on the current chart only, missing the structural context available from higher timeframes.
- Repaint — signals that appeared on forming candles disappear when the candle closes, making historical performance appear better than it actually is.
- Imprecise swing detection — incorrect identification of the pivot points that define hidden divergence, leading to false signals and missed setups.
MGH-MultiMACD-HD was built specifically to solve all three. The swing detection algorithm is precise. The signal confirmation is repaint-free when set to candle 1. And the multi-timeframe engine makes it the only hidden divergence tool on the market that watches six timeframes simultaneously.
Key Features
Multi-Timeframe Hidden Divergence — The Complete View
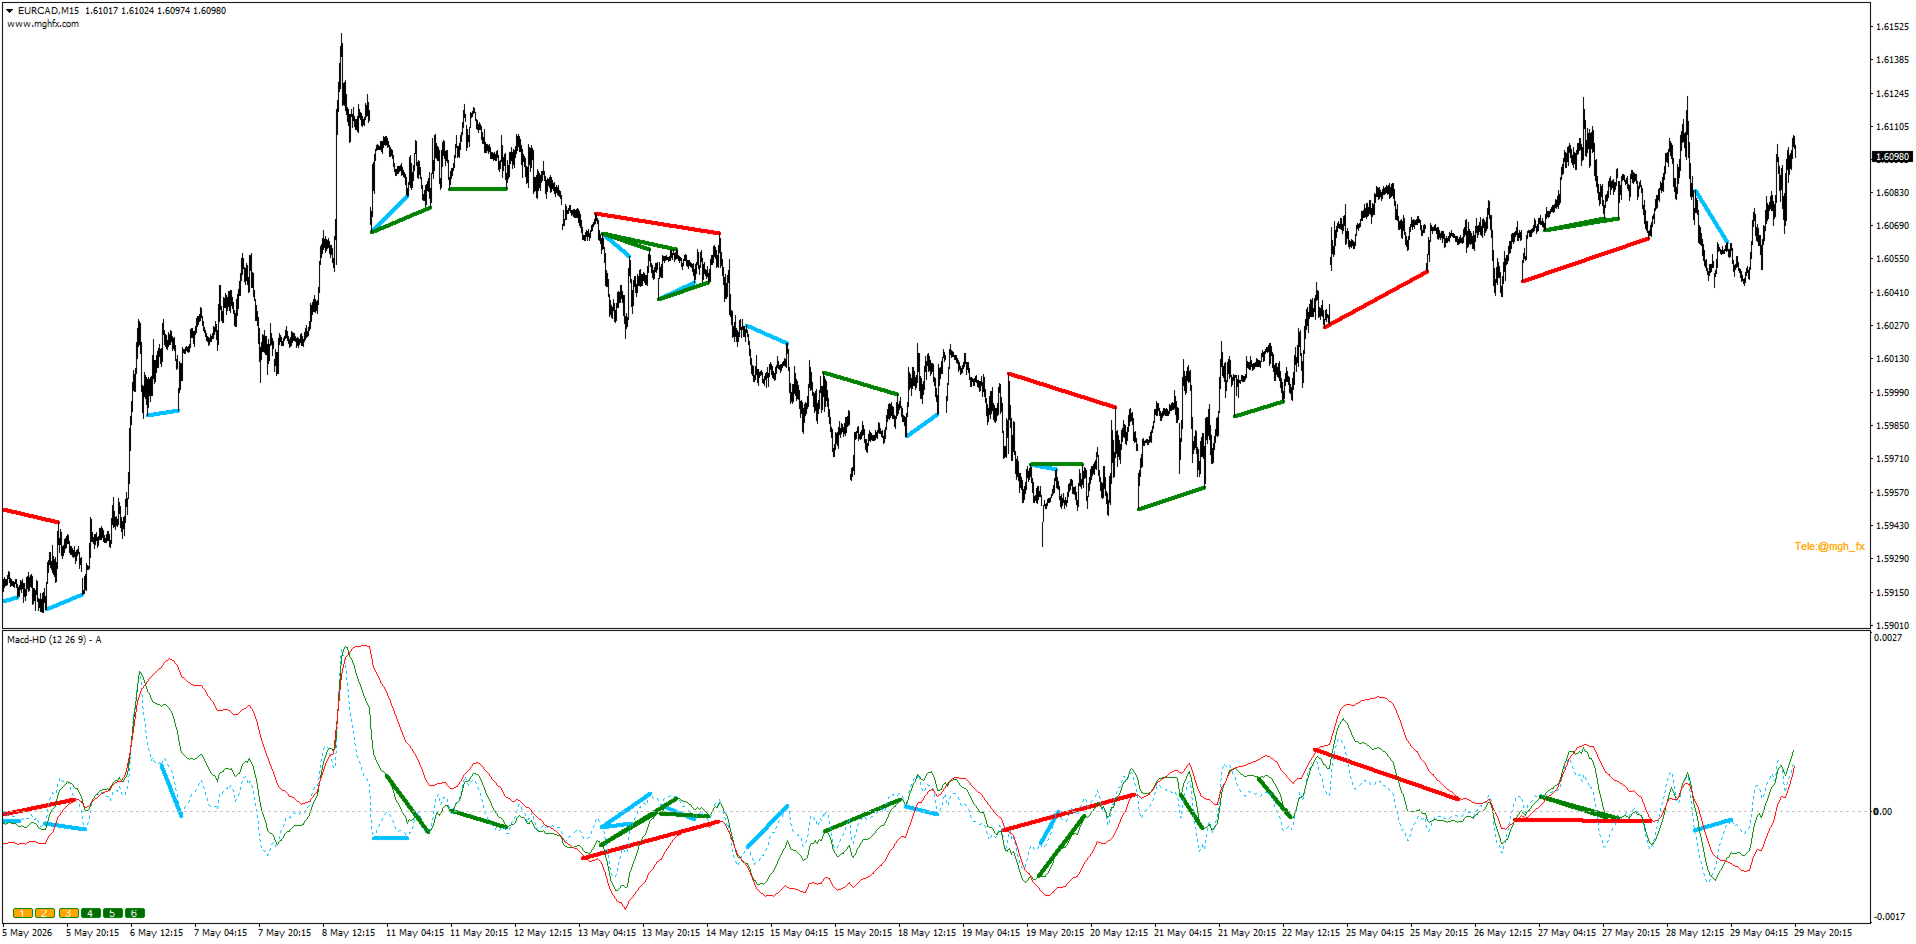
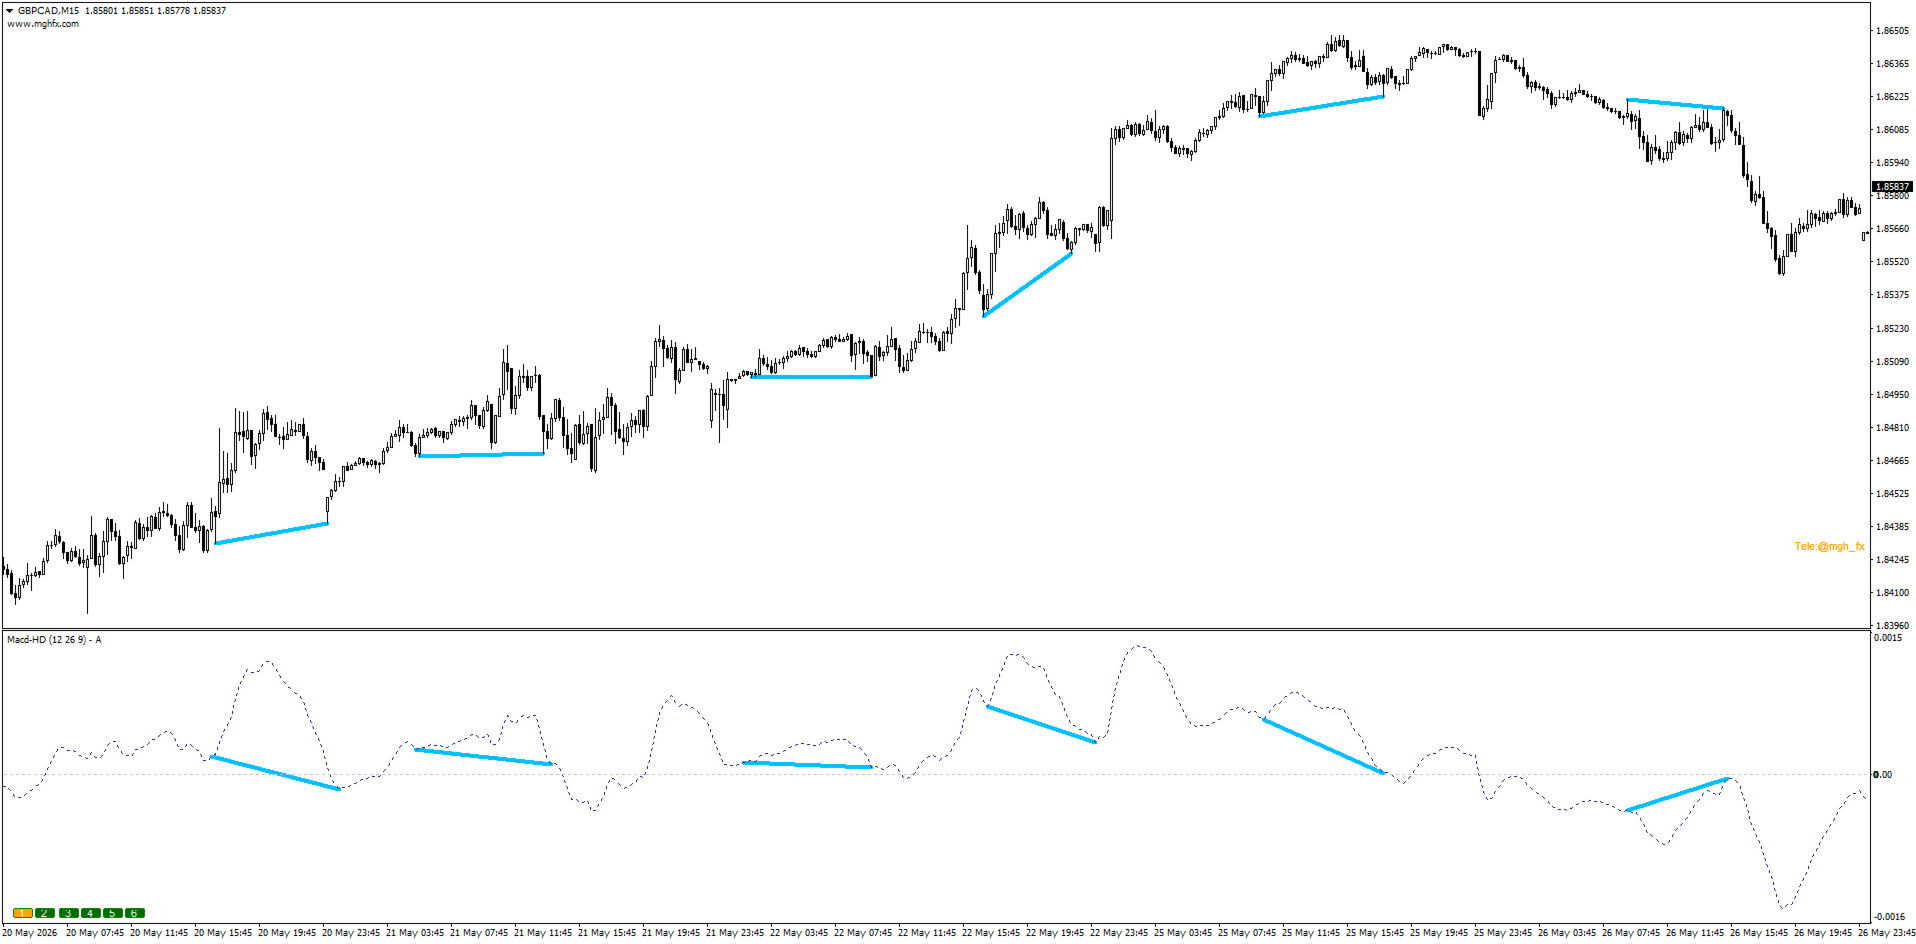
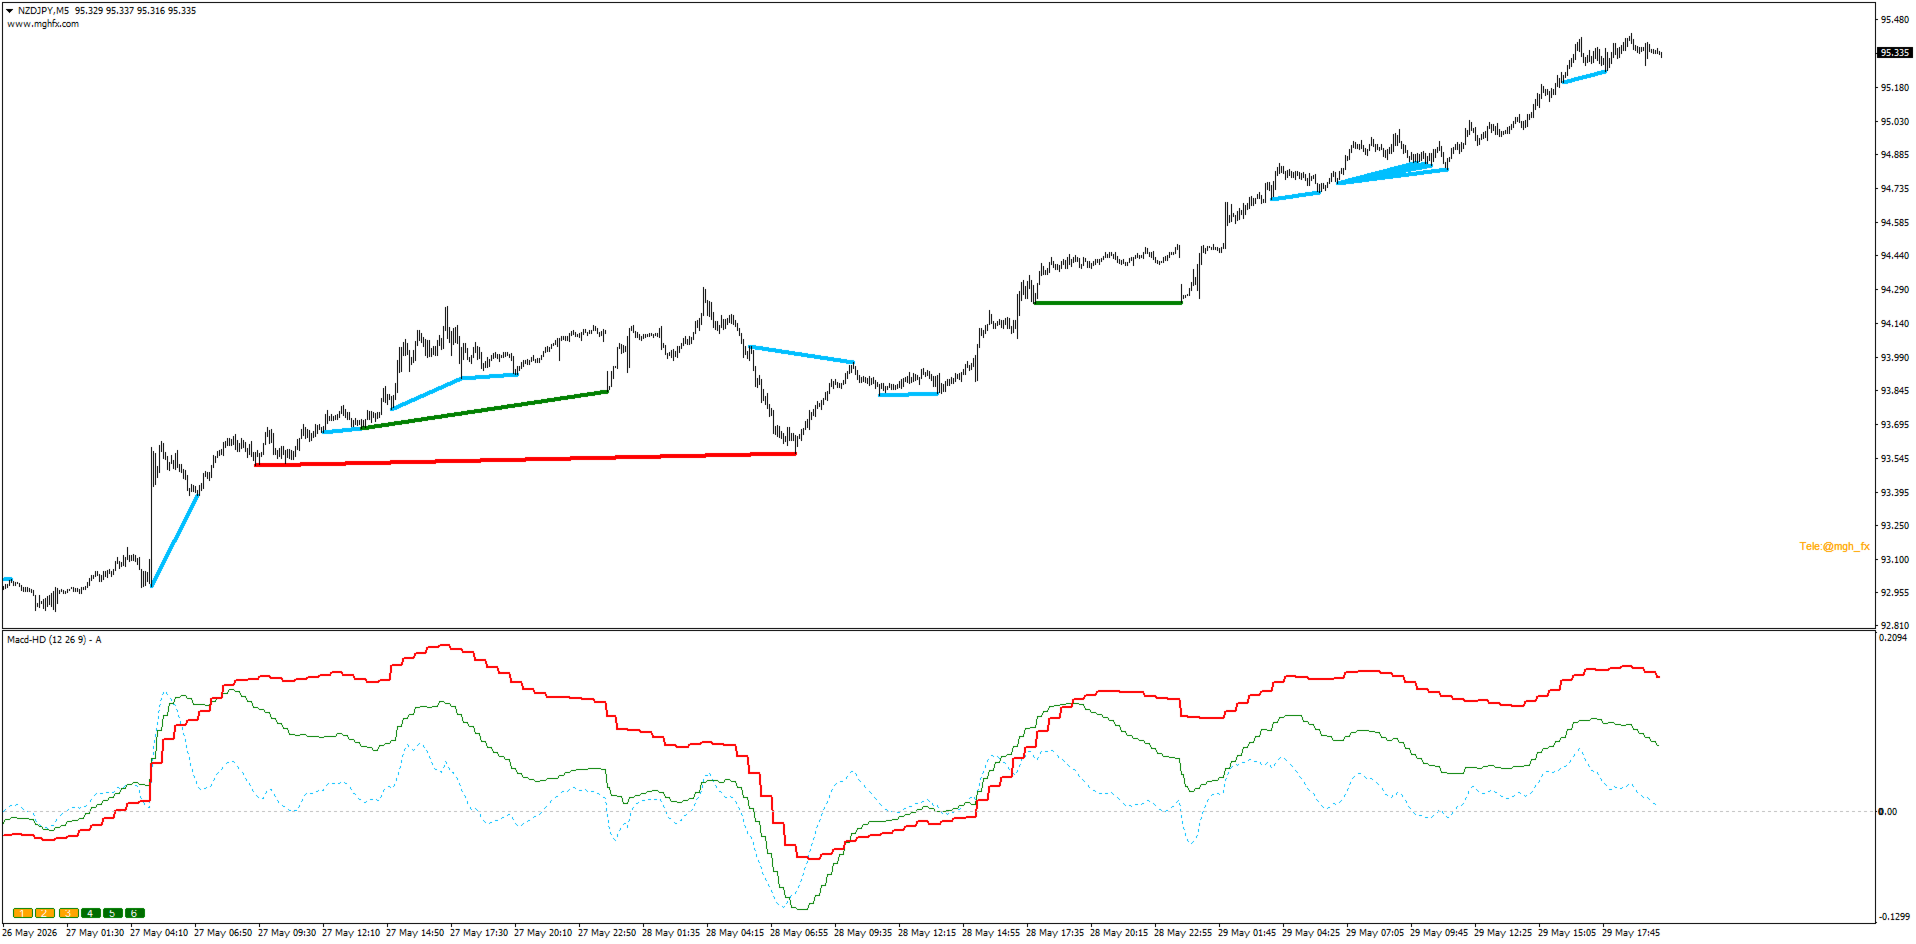
Monitor the current timeframe plus up to 5 higher timeframes at once. Each timeframe's MACD is displayed in its own distinct color, and every hidden divergence detected — on any active timeframe — is marked immediately on the chart. The color of each divergence line on the price chart matches the corresponding MACD line in the indicator window, so the relationship between chart signal and oscillator context is always clear.
The six layers automatically map to your current chart timeframe plus the 5 standard higher timeframes above it — so simply changing your chart timeframe shifts the entire set of monitored timeframes accordingly. You can toggle any layer on or off instantly using the on-chart buttons (1–6) or from the Inputs panel — no need to re-open settings to switch your active timeframe combination. (Manual selection of any arbitrary timeframe per layer is available in the MT5 version, which supports a wider range of timeframes.)
Zero Repaint — Trade With Confidence
Signal Candle Shift gives you full control: set it to 1 for confirmed, closed-candle signals that will never be redrawn, or 0 for real-time signals on the forming candle if you prefer faster entry. When set to 1, every signal you see is final — the indicator cannot and will not alter historical output.
Precision Swing Detection
The core algorithm identifies the precise swing highs and lows that define valid hidden divergence — not approximations, not lookahead bias, not cosmetic lines drawn after the fact. The divergence lines connect the exact pivot points where price and MACD disagree, giving you a clear, accurate picture of the structural relationship between price action and momentum.
Extended Divergence Range
The Increase Divergence Range parameter extends the lookback window, allowing detection of hidden divergences formed between swing points that are far apart in time. Standard indicators miss these entirely. MGH-MultiMACD-HD finds them.
Display Flexibility
Choose to display divergence lines on the price chart only, the indicator window only, or both simultaneously. The "Only Price" mode produces the cleanest chart layout — divergence structure is visible directly on price without any indicator clutter below.
Full Alert System
- Divergence alert — fires the moment a hidden divergence is confirmed on any active timeframe
- Phase change alert — fires when MACD crosses the zero line
- Histogram/Signal cross alert — fires on momentum crossovers
- Delivery via popup, sound (.wav), email, and push notification — all independently configurable
Hidden Divergence Across Timeframes — The Confluence Advantage
A hidden divergence on a single timeframe is already a meaningful signal. When the same directional bias appears as hidden divergence simultaneously on two or three timeframes — for example, on M15, H1, and H4 at the same time — the probability of trend continuation increases substantially.
MGH-MultiMACD-HD makes these confluence zones visible and alerts you when they form. This multi-timeframe alignment is one of the highest-conviction setups in technical analysis, and it is something no single-timeframe indicator can ever show you.
As a practical framework: use single-timeframe hidden divergences as trend-continuation confirmation within your existing strategy. Use multi-timeframe confluence zones — where two or more timeframes show hidden divergence simultaneously in the same price area — as standalone, high-probability trend-continuation entries.
Practical Use Cases
Intraday trend trading — Trading M5 or M15 in a clear trend and unsure whether a pullback is a reversal or a continuation opportunity? Enable H1 or H4 as a second layer. When M15 price makes a higher low and H1 MACD also shows hidden bullish divergence, the pullback is almost certainly a continuation setup.
Daily timeframe trend following — Enable the Daily and Weekly layers to catch hidden divergences on major structural levels. These signals appear infrequently but consistently precede significant trend continuation moves.
Scalping with higher-TF context — Run M1 or M5 as Layer 1 and H1 as Layer 2. When the higher timeframe confirms the trend direction via hidden divergence, scalp entries in that direction carry a structural edge.
Filtering out reversal traps — Hidden divergence in the direction of the prevailing trend is a direct confirmation that the trend is intact. Use it to avoid counter-trend trades and stay on the right side of momentum.
Interpolation Mode
Enable Interpolate in MTF Mode to smooth the MACD lines from higher timeframes into clean, continuous curves rather than step-function plots. This is a visual preference — the underlying signal logic is identical — but it produces significantly cleaner chart output when multiple timeframes are displayed simultaneously.
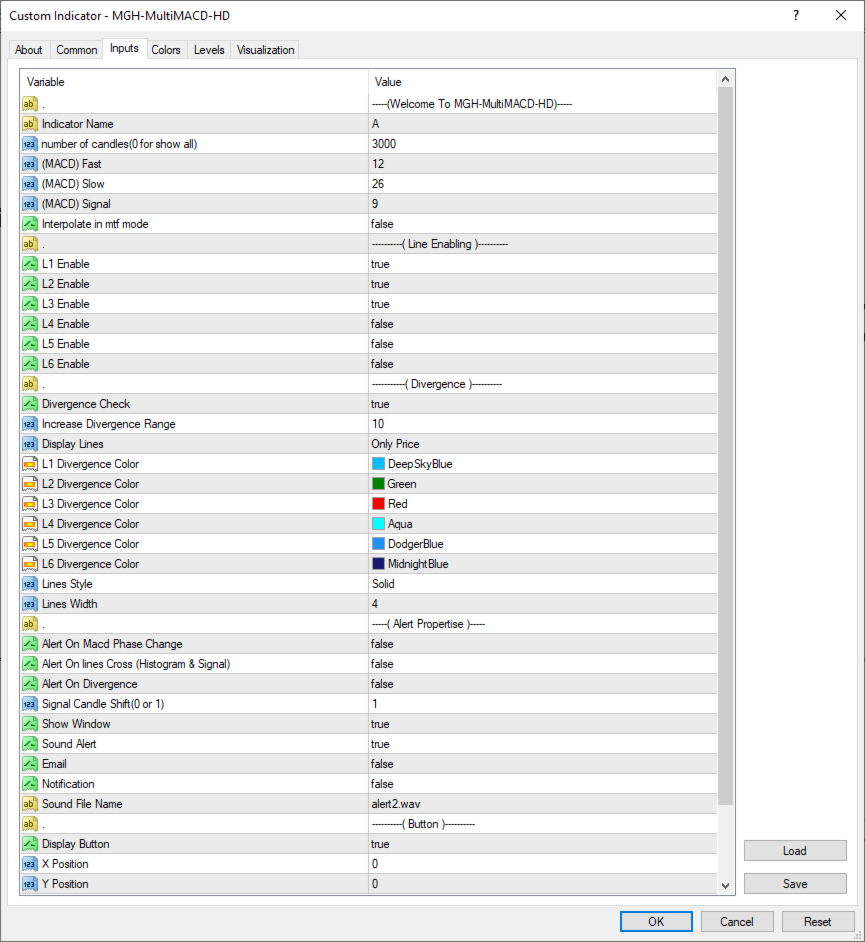
Settings Reference
| Parameter | Description |
|---|---|
| Indicator Name | Label shown in the indicator sub-window header |
| Number of Candles | Lookback period (0 = full history) |
| MACD Fast / Slow / Signal | Standard MACD parameters — defaults are 12, 26, 9 |
| Interpolate in MTF Mode | Smooth higher-TF MACD lines for cleaner visual output |
| L1 – L6 Enable | Independently enable or disable each timeframe layer. Layers map automatically to the current chart timeframe and the 5 higher timeframes above it (MT4). Manual per-layer timeframe selection is available in the MT5 version. |
| Divergence Check | Master on/off switch for hidden divergence detection |
| Increase Divergence Range | Extends lookback for detecting wide-range hidden divergences |
| Display Lines | Price chart only / indicator window only / both |
| L1 – L6 Divergence Color | Individual divergence line color per active timeframe |
| Lines Style / Width | Visual style and thickness of all divergence lines |
| Alert On Phase Change | Alert when MACD crosses the zero line |
| Alert On Lines Cross | Alert on histogram / signal line crossover |
| Alert On Divergence | Alert on confirmed hidden divergence detection |
| Signal Candle Shift (0 or 1) | 0 = real-time; 1 = confirmed, no-repaint |
| Show Window | Toggle the indicator sub-window on or off |
| Sound Alert / Email / Notification | Alert delivery method(s) |
| Sound File Name | Custom .wav file path for sound alerts |
| Display Button | Show or hide on-chart timeframe toggle buttons |
| X / Y Position | Position of the on-chart button panel |
The MGH MultiMACD Ecosystem
MGH-MultiMACD-HD is part of a two-indicator system designed to give traders complete divergence coverage:
| Indicator | Type | Purpose |
|---|---|---|
| MGH-MultiMACD-RD | Regular Divergence | Identifies potential trend reversals |
| MGH-MultiMACD-HD | Hidden Divergence | Confirms trend continuation setups |
Used together, these two indicators provide a complete picture of MACD divergence across all timeframes — reversal signals when the trend is ending, continuation signals when it is resuming. No other indicator combination on MQL5 Market offers this level of multi-timeframe divergence coverage in a unified, color-coded visual system.
Technical Specifications
- Platform: MetaTrader 4
- Indicator Type: MACD-based hidden divergence, multi-timeframe
- Repaint: No (when Signal Candle Shift = 1)
- Alerts: Sound, Email, Push Notification, Popup
- Default MACD Settings: 12 / 26 / 9
- Timeframes Supported: Current TF + 5 higher TFs simultaneously (automatic mapping). Manual per-layer timeframe selection available in the MT5 version.
Try It Free
A demo version is available for download directly from MQL5 Market. Attach it to any chart, enable two or three timeframes, and watch how many hidden divergences — trend continuation signals your current tools have been missing — appear across your active pairs. The difference is visible within minutes of loading the indicator.
If you trade with the trend, this is the indicator that keeps you in it.
Developed by MGHFX | Telegram: @mgh_fx
MT5 Version : https://www.mql5.com/en/market/product/179985
























































L'utente non ha lasciato alcun commento sulla valutazione.