MACD Crossfire

✅ MACD Crossfire

MACD-based indicator designed to help traders filter crossover signals using risk context, momentum, and volume.

Instead of showing raw signals only, MACD Crossfire evaluates the quality of each setup and highlights when market conditions are not favorable for trading.

🎯 What the indicator does

  • Detects MACD crossovers
  • Scores signal quality (0 to 5 stars)
  • Measures market risk (0–100%)
  • Shows whether momentum is gaining or losing strength
  • Detects divergences between price and indicator
  • Displays real-time trading context in an information panel

🧭 How to use

Buy:

  • MACD crosses above the signal line
  • Signal quality ≥ ★★★
  • Risk is low or medium
  • Momentum is accelerating

Sell:

  • MACD crosses below the signal line
  • Signal quality ≥ ★★★

Avoid trading when:

  • Risk is high or extreme
  • Momentum is decelerating
  • There is divergence against the signal

📊 Main components

⭐ Signal Quality Score

Each crossover is evaluated based on:

  • Momentum direction
  • Volatility condition
  • Trend state
  • Momentum acceleration
  • Volume

🛡️ Risk Analysis (0–100%)

The indicator calculates risk by combining:

  • Volatility (ATR)
  • Trend persistence
  • Momentum variation
  • Price compression

This helps identify when to avoid trades.

⚡ Momentum

Shows whether the move is:

  • Accelerating
  • Decelerating

Helps identify loss of strength before signals fail.

📡 Divergence Detection

Detects divergences between:

  • Price
  • MACD histogram

Optional volume filter available.

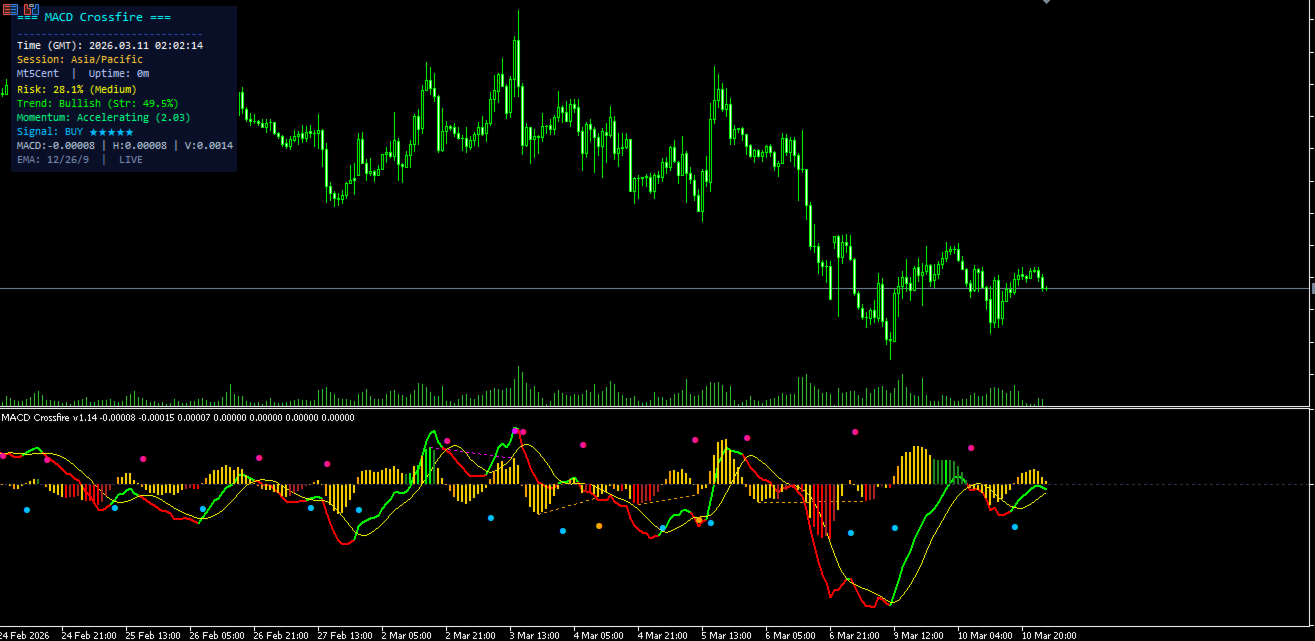
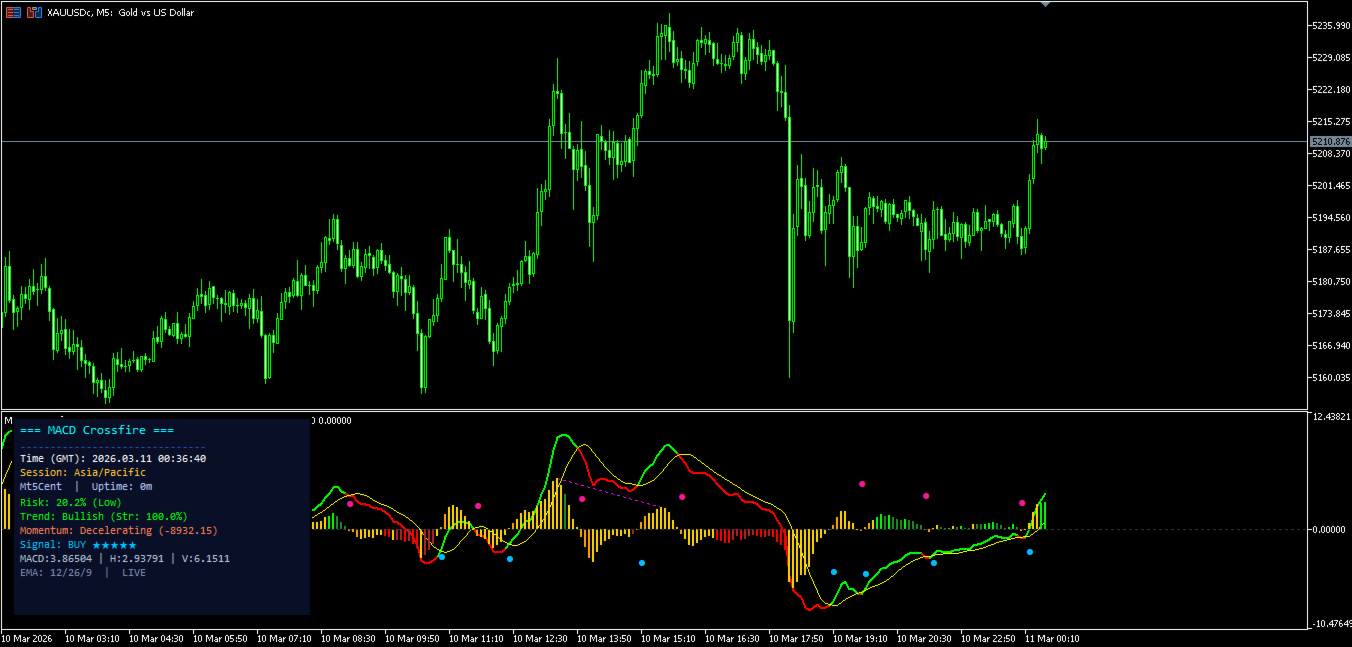
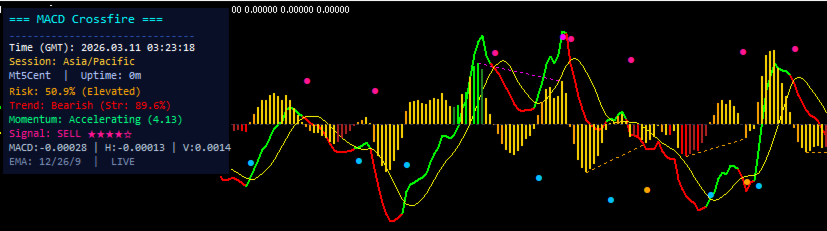
🖥️ Information Panel

Displays in real time:

  • Market session
  • Risk level
  • Trend direction
  • Momentum status
  • Last signal and quality
  • Indicator values

🔔 Alerts

Optional alerts for:

  • MACD crossover
  • Zero line crossover
  • Divergences
  • High volatility
  • Elevated risk levels
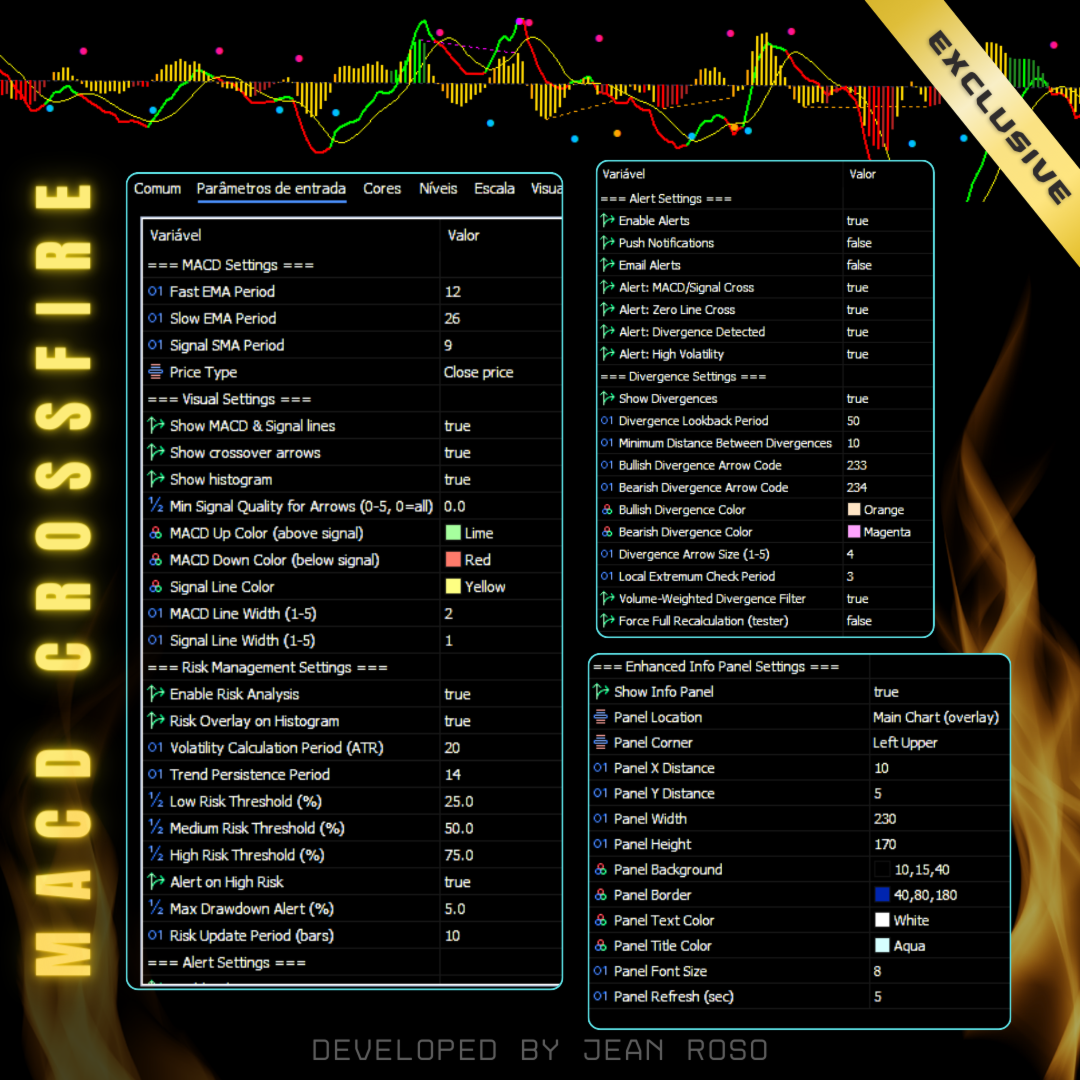
⚙️ Key parameters

  • MACD periods (fast, slow, signal)
  • Minimum signal quality filter
  • Risk analysis settings
  • Divergence settings
  • Visual controls (lines, arrows, histogram)
  • Panel and alert configuration

💡 Suggested settings

  • Scalping: quality ≥ 3
  • Intraday: quality ≥ 2
  • Swing: quality ≥ 1
  • Conservative: quality ≥ 4

⚠️ Limitations

  • The indicator does not predict the market
  • May produce false signals in ranging conditions
  • Should be used with proper risk management
  • Results may vary depending on symbol and timeframe

🔧 Technical details

  • Works on all symbols and timeframes
  • Compatible with Strategy Tester
  • No DLL required
  • Low resource usage

📧 Support

Jean Roso
https://www.mql5.com/pt/users/jeancarl


Prodotti consigliati
Stackable VWAP
Flavio Javier Jarabeck
3.5 (4)
Volume Weighted Average Price (VWAP) is a trading benchmark commonly used by Big Players that gives the average price a Symbol has traded throughout the day. It is based on both Volume and price. Additionally we put in this indicator the MVWAP (Moving Volume Weighted Average Price). For those who do not know the usage and the importance od this indicator I recommend a great article about this subject at Investopedia ( https://www.investopedia.com/articles/trading/11/trading-with-vwap-mvwap.asp
FREE
MACD Enhanced
Nikita Berdnikov
5 (3)
Introducing the MACD  Enhanced – an advanced MACD (Moving Average Convergence Divergence) indicator that provides traders with extended capabilities for trend and momentum analysis in financial markets. The indicator uses the difference between the fast and slow exponential moving averages to determine momentum, direction, and strength of the trend, creating clear visual signals for potential entry and exit points. Attention! To achieve the best results, it is recommended to adapt the indicator
FREE
Girassol Sunflower MT5 Indicator
Saullo De Oliveira Pacheco
3.86 (7)
This is the famous Sunflower indicator for Metatrader5. This indicator marks possible tops and bottoms on price charts. The indicator identifies tops and bottoms in the asset's price history, keep in mind that the current sunflower of the last candle repaints, as it is not possible to identify a top until the market reverses and it is also not possible to identify a bottom without the market stop falling and start rising. If you are looking for a professional programmer for Metatrader5, please
FREE
VolumeBasedColorsBars
Henrique Magalhaes Lopes
VolumeBasedColorsBars — Free Powerful Volume Analysis for All Traders Unlock the hidden story behind every price bar! VolumeBasedColorsBars is a professional-grade, 100% FREE indicator that colorizes your chart candles based on real, adaptive volume analysis. Instantly spot surges in market activity, identify exhaustion, and catch the moves that matter. This indicator gives you:    • Dynamic color-coded bars for instant volume context    • Adaptive thresholds based on historical, session-awar
FREE
Waves Sizer
Flavio Javier Jarabeck
3.86 (7)
Wyckoff fans, enjoy! Ideally to be used with the Weis Waves indicator, but it can be easily used alone, the Waves Sizer puts the range (in resulting Price movement) done by the Price on its market swings. You can control how accurate or loose will be the swings. This tool is very helpful for visually know how much the Price has traveled in your Timeframe. This way you can confront this level of effort with the resulting Volume, etc... Weis Waves indicator: https://www.mql5.com/en/market/produc
FREE
OmniSignal Navigator – Smart Entries at Key Levels Trade Like a Professional  with this daily/weekly High-Low-Close indicator, designed for   scalping or intraday short term trading   and precision breakout trading. Suggested Timeframes to trade with: M5 |  DONT USE THE INDICATOR ON THE M1 TIMEFRAME!!! Why It Works   Perfect for Scalping/Intraday:   Targets key zones ( PDH/PDL/PDC & PWH/PWL/PWC ) on   M2, M3, M5, M15   timeframes. (Lower Timeframes = More Signals, Higher Timeframes = Le
FREE
YOU CAN NOW DOWNLOAD FREE VERSIONS OF OUR PAID INDICATORS . IT'S OUR WAY OF GIVING BACK TO THE COMMUNITY ! >>>    GO HERE TO DOWNLOAD This system is an Heiken Ashi system based on RSI calculations . The system is a free open source script originally published on TradingView by JayRogers . We have taken the liberty of converting the pine script to Mq4 indicator . We have also added a new feature which enables to filter signals and reduces noise on the arrow signals. Background HEIKEN ASHI Th
FREE
This indicator sums up the difference between the sells aggression and the buys aggression that occurred in each Candle, graphically plotting the waves of accumulation of the aggression volumes.   Through these waves an exponential average is calculated that indicates the direction of the business flow. Note: This indicator DOES NOT WORK for Brokers and/or Markets WITHOUT the type of aggression (BUY or SELL).   Be sure to try our Professional version with configurable features and alerts:  Agre
FREE
Tabajara V5
Flavio Javier Jarabeck
4.83 (36)
Metatrader 5 version of the famous Andre Machado's Tabajara indicator. If you don't know Andre Machado's Technical Analysis work you don't need this indicator... For those who need it and for those several friend traders who asked this porting from other platforms, here it is... FEATURES 8-period Moving Average 20-period Moving Average 50-period Moving Average 200-period Moving Average Colored candles according to the inflexion of the 20-period MA SETTINGS You can change the Period of all MA's
FREE
Weis Waves è un indicatore tecnico sviluppato da David Weis, ispirato ai principi di Richard Wyckoff. A differenza del volume tradizionale, mostrato barra per barra, Weis Waves accumula il volume in “onde” rialziste o ribassiste, ricominciando il conteggio ogni volta che il prezzo cambia direzione. Questo metodo consente al trader di vedere chiaramente la vera forza del movimento di mercato, poiché ogni onda riflette l’intensità del volume che sostiene la sequenza di candele. Caratteristiche
FREE
Weis Waves RSJ
JETINVEST
4.56 (9)
The Weis Waves RSJ Indicator sums up volumes in each wave. This is how we receive a bar chart of cumulative volumes of alternating waves. Namely the cumulative volume makes the Weis wave charts unique. It allows comparing the relation of the wave sequence characteristics, such as correspondence of the applied force (expressed in the volume) and received result (the price progress). If you still have questions, please contact me by direct message:  https://www.mql5.com/en/users/robsjunqueira/
FREE
Wave Box Market Frenquency
Jean Jacques Huve Ribeiro
4.75 (4)
Totally linked to the result of a movement and the duration he had. Its height records how many ticks the asset walked during a given movement, its width shows us the duration that movement had. Its configuration must be in line with the Weis Wave Indicator configuration to observe the movement force and can indicate a possible accumulation or distribution of the movement;
FREE
Phoenix Delta Volume
Nigel Nii Darku Narnor Darko
This is the Phoenix Institutional SMC Dashboard (Emerald-Teal Edition). It is engineered to provide retail traders with the same "Volume-at-Price" clarity used by institutional desks. Below is a full breakdown of the benefits, the high-confluence logic for entries, and how to manage your trades using the current visual engine. Strategic Benefits to the User Sentiment over Price: Most indicators only look at where the price is. This dashboard tells you how much effort (Volume Delta) was required
FREE
Value Chart Candlesticks
Flavio Javier Jarabeck
4.69 (13)
The idea of a Value Chart indicator was presented in the very good book I read back in 2020 , " Dynamic Trading Indicators: Winning with Value Charts and Price Action Profile ", from the authors Mark Helweg and David Stendahl. The idea is simple and the result is pure genius: Present candlestick Price analysis in a detrended way! HOW TO READ THIS INDICATOR Look for Overbought and Oversold levels. Of course, you will need to test the settings a lot to find the "correct" one for your approach. It
FREE
Follow The Line MT5
Oliver Gideon Amofa Appiah
4.6 (35)
This indicator obeys the popular maxim that: "THE TREND IS YOUR FRIEND" It paints a GREEN line for BUY and also paints a RED line for SELL. (you can change the colors). It gives alarms and alerts of all kinds. IT DOES NOT REPAINT and can be used for all currency pairs and timeframes. Yes, as easy and simple as that. Even a newbie can use it to make great and reliable trades. NB: For best results, get my other premium indicators for more powerful and reliable signals. Get them here: https://www.m
FREE
ThreeM Quantum Tunneling
Nguyen Duc Quy
3.6 (10)
There is a science, named Quantitative Finance, that allows to study the financial derivative pricing models using the methods of theoretical and mathematical physics. Lately I came across a paper that describes a new indicator for technical analysis that combines ideas from quantum physics and brings them to finance. I got interested in it and decided I would teach how to implement indicators based on a scientific papers in MQL5.  The original Moving Mini-Max paper [2] is written by Z.K. Silaga
FREE
RSI abcd
Francisco Gomes Da Silva
4.33 (3)
RSI ABCD Pattern Finder: Strategia Tecnica 1. Come Funziona l'Indicatore Combina il RSI classico con il rilevamento automatico di pattern armonici ABCD . Componenti Principali RSI standard (periodo regolabile) Marcatori di massimi e minimi (frecce) Pattern ABCD (linee verdi/rosse) Filtri ipercomprato (70) e ipervenduto (30) 2. Configurazione su MT5 period = 14 ; // Periodo RSI size = 4 ; // Dimensione massima del pattern OverBought = 70 ; // Livello ipercomprato OverSold = 30 ; // Livello iperve
FREE
Weis Waves
Flavio Javier Jarabeck
2.83 (18)
The original author is David Weis, an expert in the Wyckoff Method. The Weis Wave is a modern adaptation of the 1930's Wyckoff Method, another expert in Tape Reading techniques and Chart Analysis. Weis Waves takes market volume and stacks it into waves according to price conditions giving the trader valuable insights about the market conditions. If you want to learn more about this subject you can find tons of videos in YouTube. Just look for "The Wickoff Method", "Weis Wave" and "Volume Spread
FREE
VWAP and MVWAP
Flavio Javier Jarabeck
3.88 (8)
Volume Weighted Average Price (VWAP) is a trading benchmark commonly used by Big Players that gives the average price a Symbol has traded throughout the day. It is based on both Volume and price. Additionally we put in this indicator the MVWAP (Moving Volume Weighted Average Price). For those who do not know the usage and the importance od this indicator I recommend a great article about this subject at Investopedia ( https://www.investopedia.com/articles/trading/11/trading-with-vwap-mvwap.asp )
FREE
RSI Alpha Candles
Aiman Saeed Salem Dahbag
5 (1)
RSI Alpha Candles – Advanced RSI Visualization Using OHLC Candlesticks RSI Alpha Candles is a professional and innovative indicator that displays the Relative Strength Index (RSI) in the form of OHLC candlesticks in a separate window, providing a clearer and more precise view of market momentum and strength. The indicator calculates RSI values based on Open, High, Low, and Close prices, then converts them into candlesticks that visually represent market strength and weakness instead of the t
FREE
Coral Indi
Dinh Duong Luong
Coral trend is   a trend-following indicator that is widely popular among FOREX traders . It is usually used as a confluence with other indicators. It uses combinations of moving averages with complex smoothing formulas! It has two configurable parameters: Coefficient   - smoothing ratio (*) Applied price Calculation: Coral = (-0.064) * B6 + 0.672 * B5 - 2.352 * B4 + 2.744 * B3
FREE
WaveTrend Plus
Nguyen Thanh Cong
5 (6)
Introduction WaveTrend Plus is an amazing oscillator that can detect optimal entry points in the market with high precision using complex computations of price and momentum. This version packs many improvements compared to the original WaveTrend such as cleaner visuals, oversold/overbought signals and divergence detection Signal Buy when oversold signal appear (green dot below) or when a bullish divergence is detected (green dashed line) Sell when overbought signal appear (red dot above) or
FREE
Weis Wave Scouter Basic
Jean Carlos Martins Roso
5 (1)
Il Weis Wave Scouter Basic è la versione essenziale del nostro rinomato indicatore per MetaTrader 5, progettato per i trader che desiderano esplorare i concetti del metodo Wyckoff e dell'analisi VSA (Volume Spread Analysis) in modo accessibile ed efficiente. Basato sulla lettura delle onde di volume, questo indicatore semplificato consente di identificare chiaramente i movimenti di mercato, concentrandosi sui principi di sforzo vs risultato e domanda e offerta, come insegnato da Richard Wyckoff.
FREE
ST Flow Context
Jean Carlos Souza
ST Flow Context: The Professional Trader’s Compass ST Flow Context is a macro analysis tool developed to identify the predominant direction of institutional money. It filters out intraday noise and delivers the real market context, helping the trader never to trade against the main tide. Key Features: Trend Alignment: Identifies whether the daily flow is bullish or bearish based on multiple timeframes. Interest Zones: Maps where institutional volume is defending positions. Entry Filter: Use Flow
FREE
The Pivot Indicator is a vital tool for technical analysis used by traders in the financial markets. Designed to assist in identifying potential reversal points or trend changes, this indicator provides valuable insights into key levels in the market. Key features of the Pivot Indicator include: Automatic Calculations: The Pivot Indicator automatically calculates Pivot Point, Support, and Resistance levels based on the previous period's high, low, and close prices. This eliminates the complexity
FREE
Candle Countdown — Tempo preciso fino alla chiusura della candela per MT4 Candle Countdown è uno strumento semplice e preciso che mostra il tempo rimanente fino alla chiusura della candela corrente direttamente sul grafico. Quando l’ingresso dipende dalla chiusura della candela, anche pochi secondi possono fare la differenza. Questo indicatore ti permette di vedere il tempo esatto e prendere decisioni senza fretta o supposizioni. Un indicatore per il controllo preciso della chiusura della cande
FREE
Daily High Low Danilo Monteiro
Danilo Hudson Couto Monteiro
4 (1)
# Indicador Daily High - Danilo Monteiro - MT5 ## Descrição O Daily High/Low Labels é um indicador personalizado para MetaTrader 5 que exibe automaticamente as máximas e mínimas diárias no gráfico, facilitando a identificação rápida dos níveis importantes de preço. O indicador marca os preços com etiquetas e linhas horizontais, permitindo uma visualização clara dos níveis críticos do dia atual e anterior. ## Principais Características ### 1. Marcação Automática - Exibe automaticamente as máxi
FREE
Force Candle Pro
Samuel Henrique Almeida Ferreira
Force Candle Pro is an advanced indicator designed to identify strong momentum candles in the market, helping traders detect high-probability movements and institutional activity. This tool analyzes candle strength based on body size, volatility, and directional consistency, filtering out weak and indecisive movements. Unlike common indicators, Force Candle Pro focuses on market impulse, allowing traders to identify when the market is truly moving with strength. MAIN FEATURES: - Detection o
FREE
BarX
HENRIQUE ARAUJO
BarX — Indicatore di Massimi e Minimi di una Candela Specifica BarX è un indicatore tecnico che evidenzia automaticamente il massimo e il minimo di una candela specifica del giorno , definita dall’utente (ad esempio candela 0 rappresenta la prima candela dopo l’apertura del mercato ). Questo strumento è particolarmente utile per i trader che utilizzano livelli di prezzo fissi come supporto, resistenza, breakout o inversione . Segnando visualmente questi punti sul grafico, BarX semplifica l’anali
FREE
Super Trend Strategy
Minh Khoa Nguyen
5 (3)
The SuperTrend Strategy is a widely-used technical indicator based on the Average True Range (ATR), primarily employed as a trailing stop tool to identify prevailing market trends. The indicator is designed for ease of use while providing reliable insights into the current market trend. It operates based on two key parameters: the period and the multiplier . By default, it uses a period of 15  for the ATR calculation and a multiplier of 3 . The Average True Range (ATR) plays a crucial role in th
FREE
Gli utenti di questo prodotto hanno anche acquistato
ARIPoint
Temirlan Kdyrkhan
ARIPoint is a powerful trading companion designed to generate high-probability entry signals with dynamic TP/SL/DP levels based on volatility. Built-in performance tracking shows win/loss stats, PP1/PP2 hits, and success rates all updated live. Key Features: Buy/Sell signals with adaptive volatility bands Real-time TP/SL/DP levels based on ATR Built-in MA Filter with optional ATR/StdDev volatility Performance stats panel (Success, Profit/Loss, PP1/PP2) Alerts via popup, sound, push, or email Cu
SuperScalp Pro
Van Minh Nguyen
4.57 (21)
SuperScalp Pro – Sistema avanzato di indicatore scalping multi-filtro SuperScalp Pro è un indicatore di scalping avanzato che combina il classico Supertrend con molteplici filtri intelligenti di conferma per aiutare a identificare opportunità di trading. Funziona in modo efficiente su diversi timeframe da M1 a H4, con prestazioni ottimizzate su XAUUSD, BTCUSD e principali coppie Forex. L’indicatore fornisce chiari segnali Buy e Sell, insieme a livelli di ingresso, stop loss e take profit calcola
Divergence Bomber
Ihor Otkydach
4.9 (87)
Ogni acquirente dell’indicatore riceverà inoltre gratuitamente: L’utilità esclusiva “Bomber Utility”, che gestisce automaticamente ogni operazione, imposta i livelli di Stop Loss e Take Profit e chiude le posizioni secondo le regole della strategia I file di configurazione (set file) per adattare l’indicatore a diversi asset I set file per configurare il Bomber Utility in tre modalità: “Rischio Minimo”, “Rischio Bilanciato” e “Strategia di Attesa” Una guida video passo-passo per installare, conf
Entry In The Zone and SMC Multi Timeframe is a real-time 2-in-1 market analysis tool that combines market structure analysis and a No Repaint BUY / SELL signal system into a single indicator, built on Smart Money Concepts (SMC) — a widely adopted framework used by professional traders to understand market structure. This indicator helps you see the market more clearly, make decisions based on structure rather than guesswork, and focus on high-probability zones where price is more likely to react
Power Candles MT5
Daniel Stein
4.75 (8)
Power Candles V3 - Il primo indicatore di forza auto-ottimizzante Power Candles V3 trasforma l'analisi della forza di mercato in un sistema di trading immediatamente operativo. L'indicatore non si limita più a colorare il grafico in base alla forza: esegue in background un'auto-ottimizzazione in tempo reale e ti consegna il miglior Stop Loss, Take Profit e soglia di segnale per il tuo simbolo. Un clic lo adotta per il trading live. Questo strumento fa parte dell'ecosistema Stein Investments.  S
Grabber System MT5
Ihor Otkydach
4.83 (23)
Ti presento un eccellente indicatore tecnico: Grabber, che funziona come una strategia di trading "tutto incluso", pronta all’uso. In un solo codice sono integrati strumenti potenti per l’analisi tecnica del mercato, segnali di trading (frecce), funzioni di allerta e notifiche push. Ogni acquirente di questo indicatore riceve anche gratuitamente: L’utility Grabber: per la gestione automatica degli ordini aperti Video tutorial passo dopo passo: per imparare a installare, configurare e utilizzare
Se acquisti questo indicatore, riceverai il mio Trade Manager Professionale + EA  GRATUITAMENTE. Innanzitutto è importante sottolineare che questo sistema di trading è un indicatore Non-Repainting, Non-Redrawing e Non-Lagging, il che lo rende ideale sia per il trading manuale che per quello automatico. Corso online, manuale e download di preset. Il "Sistema di Trading Smart Trend MT5" è una soluzione completa pensata sia per i trader principianti che per quelli esperti. Combina oltre 10 indicat
Quantum TrendPulse
Bogdan Ion Puscasu
5 (23)
Ecco   Quantum TrendPulse   , lo strumento di trading definitivo che combina la potenza di   SuperTrend   ,   RSI   e   Stocastico   in un unico indicatore completo per massimizzare il tuo potenziale di trading. Progettato per i trader che cercano precisione ed efficienza, questo indicatore ti aiuta a identificare con sicurezza le tendenze di mercato, i cambiamenti di momentum e i punti di entrata e uscita ottimali. Caratteristiche principali: Integrazione SuperTrend:   segui facilmente l'andame
Azimuth Pro
Ottaviano De Cicco
5 (7)
Azimuth Pro V2: Synthetic Fractal Structure and Confirmed Entries for MT5 Overview Azimuth Pro is a multi-level swing structure indicator by Merkava Labs . Four nested swing layers, swing-anchored VWAP, ABC pattern detection, three-timeframe structural filtering, and closed-bar confirmed entries — one chart, one workflow from micro-swings to macro-cycles. This is not a blind signal product. It is a structure-first workflow for traders who care about location, context, and timing. V2 Launch Offe
FX Trend MT5 NG
Daniel Stein
5 (4)
FX Trend NG: La Nuova Generazione di Intelligenza di Trend Multi-Mercato Panoramica FX Trend NG è uno strumento professionale di analisi del trend multi-timeframe e monitoraggio dei mercati. Ti consente di comprendere la struttura completa del mercato in pochi secondi. Invece di passare tra numerosi grafici, puoi identificare immediatamente quali strumenti sono in trend, dove il momentum sta diminuendo e dove esiste un forte allineamento tra i timeframe. Offerta di Lancio – Ottieni FX Trend NG
SignalTech MT5 is a trading system for EURUSD, USDCHF, USDJPY, AUDUSD, NZDUSD, EURJPY, AUDJPY, NZDJPY, CADJPY H2 and H3 Timeframe.  It can generate signals with Buy/Sell Arrows and Pop-Up/Sound Alerts. Each signal has clear Entry and Stop Loss levels, which should be automatically flagged on the chart, as well as potential Targets 1, 2, and 3. The Entry and TP levels are fixed after the trade is taken. The exit level is dynamic. If there are signs of a potential short-term trend reversal, the
Gann Made Easy è un sistema di trading Forex professionale e facile da usare che si basa sui migliori principi del trading utilizzando la teoria di mr. WD Gann. L'indicatore fornisce segnali ACQUISTA e VENDI accurati, inclusi i livelli di Stop Loss e Take Profit. Puoi fare trading anche in movimento utilizzando le notifiche PUSH. CONTATTAMI DOPO L'ACQUISTO PER RICEVERE GRATUITAMENTE LE ISTRUZIONI DI TRADING E OTTIMI INDICATORI EXTRA! Probabilmente hai già sentito parlare molte volte dei metodi d
Meravith MT5
Ivan Stefanov
5 (1)
Strumento per market maker. Meravith: Analizzerà tutti i timeframe e mostrerà il trend attualmente in corso. Evidenzierà le zone di liquidità (equilibrio dei volumi) dove i volumi rialzisti e ribassisti sono uguali. Mostrerà tutti i livelli di liquidità dei diversi timeframe direttamente sul grafico. Genererà e presenterà un’analisi di mercato testuale a scopo di riferimento. Calcolerà obiettivi, livelli di supporto e punti di stop-loss in base al trend attuale. Calcolerà il rapporto rischio/ren
Atomic Analyst MT5
Issam Kassas
3.94 (31)
Innanzitutto, vale la pena sottolineare che questo indicatore di trading non è repaint, non è ridisegno e non presenta ritardi, il che lo rende ideale sia per il trading manuale che per quello automatico. Manuale utente: impostazioni, input e strategia. L'Analista Atomico è un indicatore di azione del prezzo PA che utilizza la forza e il momentum del prezzo per trovare un miglior vantaggio sul mercato. Dotato di filtri avanzati che aiutano a rimuovere rumori e segnali falsi, e aumentare il pote
Bill Williams Advanced
Siarhei Vashchylka
5 (11)
Bill Williams Advanced is designed for automatic chart analysis using Bill Williams' "Profitunity" system. The indicator analyzes four timeframes at once. Manual (Be sure to read before purchasing) Advantages 1. Analyzes the chart using Bill Williams' "Profitunity" system. Signals are displayed in a table in the corner of the screen and on the price chart. 2. Finds all known AO and AC signals, as well as zone signals. Equipped with a trend filter based on the Alligator. 3. Finds "Divergence Bar
Trend Screener Pro MT5
STE S.S.COMPANY
4.85 (104)
Indicatore di tendenza, soluzione unica rivoluzionaria per il trading di tendenze e il filtraggio con tutte le importanti funzionalità di tendenza integrate in un unico strumento! È un indicatore multi-timeframe e multi-valuta al 100% non ridipingibile che può essere utilizzato su tutti i simboli/strumenti: forex, materie prime, criptovalute, indici e azioni. Trend Screener è un indicatore di tendenza che segue un indicatore efficiente che fornisce segnali di tendenza a freccia con punti nel gra
Top indicator for MT5   providing accurate signals to enter a trade without repainting! It can be applied to any financial assets:   forex, cryptocurrencies, metals, stocks, indices .  Watch  the video  (6:22) with an example of processing only one signal that paid off the indicator! MT4 version is here It will provide pretty accurate trading signals and tell you when it's best to open a trade and close it. Most traders improve their trading results during the first trading week with the help of
Presentazione       Quantum Breakout PRO   , l'innovativo indicatore MQL5 che sta trasformando il modo in cui scambi le zone di breakout! Sviluppato da un team di trader esperti con un'esperienza di trading di oltre 13 anni,       Quantum Breakout PRO       è progettato per spingere il tuo viaggio di trading a nuovi livelli con la sua strategia innovativa e dinamica della zona di breakout. Quantum Breakout Indicator ti fornirà frecce di segnalazione sulle zone di breakout con 5 zone target di
Btmm state engine pro
Garry James Goodchild
5 (4)
BTMM State Engine Pro is a MetaTrader 5 indicator for traders who use the Beat The Market Maker approach: Asian session context, kill zone timing, level progression, peak formation detection, and a multi-pair scanner from a single chart. It combines cycle state logic with a built-in scanner dashboard so you do not need the same tool on many charts at once. What it does Draws the Asian session range; session times can follow broker server offset or be set in inputs. Tracks level progression (L
OmniSync Projection
Antonio-alin Teculescu
5 (1)
Chronos Fractal Engine is an innovative price projection indicator for MetaTrader 5, designed to transform your technical analysis by intelligently identifying and projecting historical price patterns. Built upon an advanced correlation algorithm and the fractal principles of the market, this powerful tool visualizes potential future price movements, giving you a unique edge in your trading decisions. What is Chronos Fractal Engine? At its core, the Chronos Fractal Engine employs a sophisticat
FX Power MT5 NG
Daniel Stein
5 (31)
FX Power: Analizza la Forza delle Valute per Decisioni di Trading Più Intelligenti Panoramica FX Power è lo strumento essenziale per comprendere la reale forza delle principali valute e dell'oro in qualsiasi condizione di mercato. Identificando le valute forti da comprare e quelle deboli da vendere, FX Power semplifica le decisioni di trading e rivela opportunità ad alta probabilità. Che tu segua le tendenze o anticipi inversioni utilizzando valori estremi di Delta, questo strumento si adatta
Scopri quale strategia funziona davvero sul tuo simbolo - prima di rischiare denaro reale. Power Bar rileva le barre di prezzo estreme su qualsiasi simbolo e qualsiasi timeframe, poi esegue istantaneamente il backtest di 3 diverse strategie di trading per confrontare tassi di vincita, fattori di profitto e P&L fianco a fianco. Tutto in un unico pannello interattivo. Niente supposizioni. Niente curve-fitting. Solo dati. Cosa rende Power Bar unico? La maggior parte degli indicatori fornisce un se
Berma Bands
Muhammad Elbermawi
5 (8)
L'indicatore Berma Bands (BBs) è uno strumento prezioso per i trader che cercano di identificare e capitalizzare i trend di mercato. Analizzando la relazione tra il prezzo e le BBs, i trader possono discernere se un mercato è in una fase di trend o di range. Visita il [ Berma Home Blog ] per saperne di più. Le Berma Bands sono composte da tre linee distinte: la Upper Berma Band, la Middle Berma Band e la Lower Berma Band. Queste linee sono tracciate attorno al prezzo, creando una rappresentazion
Crystal Heikin Ashi Signals
Muhammad Jawad Shabir
5 (2)
Crystal Heikin Ashi Signals - Professional Trend & Signal Detection Indicator Advanced Heikin Ashi Visualization with Intelligent Signal System for Manual & Automated Trading Final Price: $149 ---------> Price goes up $10 after every 10 sales . Limited slots available — act fast . Overview Crystal Heikin Ashi Signals is a professional-grade MetaTrader 5 indicator that combines pure Heikin Ashi candle visualization with an advanced momentum-shift detection system. Designed for both manual traders
Gartley Hunter Multi
Siarhei Vashchylka
5 (11)
Gartley Hunter Multi - An indicator for searching for harmonic patterns simultaneously on dozens of trading instruments and on all possible timeframes. Manual (Be sure to read before purchasing) | Version for MT4 Advantages 1. Patterns: Gartley, Butterfly, Shark, Crab. Bat, Alternate Bat, Deep Crab, Cypher 2. Simultaneous search for patterns on dozens of trading instruments and on all possible timeframes 3. Search for patterns of all possible sizes. From the smallest to the largest 4. All fou
Punti META PRO     — è uno strumento di trend following che elimina le incertezze dal trading e mostra dove il mercato ha già preso la sua decisione. L'indicatore identifica i punti chiave in cui cambiano trend, tendenze e strutture, ed evidenzia le aree in cui il prezzo ritorna, consentendo ai principali operatori di prendere posizione. Non solo visualizzi il movimento, ma ne comprendi anche la logica sottostante. Tutti i segnali vengono registrati dopo la chiusura della candela, non vengono ri
L'indicatore " Dynamic Scalper System MT5 " è progettato per il metodo di scalping, ovvero per il trading all'interno di onde di trend. Testato sulle principali coppie di valute e sull'oro, è compatibile con altri strumenti di trading. Fornisce segnali per l'apertura di posizioni a breve termine lungo il trend, con ulteriore supporto al movimento dei prezzi. Il principio dell'indicatore. Le frecce grandi determinano la direzione del trend. Un algoritmo per generare segnali per lo scalping sott
Meridian Pro
Ottaviano De Cicco
5 (1)
Meridian Pro: Professional Multi-Timeframe Trend Matrix for MT5 Overview Meridian Pro is a multi-timeframe trend matrix by Merkava Labs that compresses directional state, strength, momentum condition and matrix agreement into one compact panel. One adaptive engine, applied consistently from M1 to W1. No per-symbol tuning. No indicator stacking. One structured readout across every asset and every timeframe. Launch Offer — Get Meridian Pro for USD 99 (introductory). Regular price: USD 149. 1. Why
Trend indicator AI mt5
Ramil Minniakhmetov
5 (17)
Trend Ai indicator è un ottimo strumento che migliorerà l'analisi di mercato di un trader combinando l'identificazione della tendenza con punti di ingresso utilizzabili e avvisi di inversione. Questo indicatore consente agli utenti di navigare nelle complessità del mercato forex con fiducia e precisione Oltre ai segnali primari, l'indicatore Ai di tendenza identifica i punti di ingresso secondari che si presentano durante i pullback o i ritracciamenti, consentendo ai trader di capitalizzare le
Auto Optimized Parabolic RSI: Motore di Momentum 3D Avanzato La maggior parte degli indicatori per trader privati fallisce perché si affida a parametri statici che smettono di funzionare nel momento in cui la volatilità del mercato cambia. Auto Optimized Parabolic RSI risolve il problema dell'"obsolescenza dell'indicatore" ricalcolando continuamente il proprio vantaggio matematico, portando un adattamento quantitativo di livello istituzionale direttamente sul tuo terminale MT5. Il Vantaggio Prin
Altri dall’autore
Weis Wave Scouter Basic
Jean Carlos Martins Roso
5 (1)
Il Weis Wave Scouter Basic è la versione essenziale del nostro rinomato indicatore per MetaTrader 5, progettato per i trader che desiderano esplorare i concetti del metodo Wyckoff e dell'analisi VSA (Volume Spread Analysis) in modo accessibile ed efficiente. Basato sulla lettura delle onde di volume, questo indicatore semplificato consente di identificare chiaramente i movimenti di mercato, concentrandosi sui principi di sforzo vs risultato e domanda e offerta, come insegnato da Richard Wyckoff.
FREE
WeisWaveScouter
Jean Carlos Martins Roso
WeisWaveScouter is a powerful and accurate indicator designed to help traders detect key market movements based on price and volume waves. Built for the MetaTrader 4 platform, WeisWaveScouter provides detailed analysis of bullish and bearish waves, as well as highlighting volume spikes, giving you a clear view of market conditions. Key Features: Bullish and Bearish Waves: Easily identify bullish and bearish movements with waves clearly differentiated by customizable colors. Volume Spikes: Det
EmaCloud
Jean Carlos Martins Roso
Get ready to trade with real strategy using EmaCloud — the indicator built for traders who demand clarity, speed, and smarter decisions. Map market trends with precision using moving-average clouds (EMA, SMA, SMMA, and LWMA) and spot directional shifts before the crowd. Customize your workspace with 8 tactical-inspired visual themes, from “Classic” mode to “Forest,” adapting the environment to your trading style. Receive clear buy and sell signals with complete alerts: chart arrows, pop-ups, pus
Volume Thermal Vision Basic
Jean Carlos Martins Roso
Volume Thermal Vision Basic è la versione semplificata del rinomato indicatore Volume Thermal Vision, progettata per i trader che desiderano analizzare l’intensità del volume con praticità ed efficienza. Con 6 livelli di colori vivaci, scegli tra le modalità StealthMode, NightVision e FrostVision per visualizzare i dati di volume in modo chiaro e strategico. Perfetto per i principianti o come complemento alla tua analisi, questo indicatore è leggero, intuitivo e ideale per ottimizzare le tue dec
FREE
Volume ThermalVision
Jean Carlos Martins Roso
Volume Thermal Vision - Advanced Volume Analysis for MetaTrader 4 Unlock the power of volume analysis with Volume Thermal Vision, a sophisticated indicator designed to enhance your trading decisions. Developed by Jean Roso, this tool provides a dynamic visualization of volume intensity through a customizable heatmap, empowering traders to identify market trends and potential reversals with precision. Key Features: Multi-Protocol Visualization: Choose from five distinct protocols—Tactical, Steal
Volume Thermal Vision
Jean Carlos Martins Roso
Scopri il Potere del Volume con Volume Thermal Vision Sei pronto a portare il tuo trading al livello successivo? Presentiamo Volume Thermal Vision, l’indicatore di volume definitivo per MetaTrader 5 che trasforma l’analisi del volume in un vantaggio strategico. Sviluppato per trader che vogliono identificare opportunità ad alta probabilità, questo indicatore è perfetto per metodologie come VSA (Volume Spread Analysis), ICT (Inner Circle Trader), SMC (Smart Money Concepts) e Wyckoff, aiutandoti a
Weis Wave Scouter
Jean Carlos Martins Roso
Scopri la potenza dell'analisi avanzata del volume con Weis Wave Scouter, un indicatore rivoluzionario per MetaTrader 5 che combina i principi comprovati del metodo Wyckoff e dell'analisi VSA (Volume Spread Analysis). Progettato per trader che cercano precisione e profondità nelle loro operazioni, questo indicatore offre una lettura tattica del mercato attraverso l'analisi delle onde di volume cumulativo, aiutando a individuare punti chiave di inversione e continuazione di tendenza. Weis Wave Sc
Result Wave Recon
Jean Carlos Martins Roso
Result Wave Recon Indicator Description Overview The Result Wave Recon indicator for MetaTrader 5 (MT5) is a sophisticated technical analysis tool designed to visualize accumulated price movements in the form of waves, combined with volume peak analysis. It offers customizable visual themes to suit various trading styles and preferences, making it a versatile addition to any trader's toolkit. The indicator plots bullish and bearish waves as histograms in a separate window, with volume peaks hig
VSA Smart Engine
Jean Carlos Martins Roso
VSASmartEngine - VSA Volume Intelligence System VSASmartEngine is a technical indicator for MetaTrader 5 based on VSA (Volume Spread Analysis) methodology. The system is designed to provide an objective reading of market activity, helping traders identify aggression, absorption, and exhaustion states by analyzing the relationship between volume and price action. The indicator features a dual-processing architecture, allowing the user to switch between the full VSA logic engine or a simplified h
Filtro:
Nessuna recensione
Rispondi alla recensione