Result Wave Recon

Result Wave Recon Indicator Description
Overview
The Result Wave Recon indicator for MetaTrader 5 (MT5) is a sophisticated technical analysis tool designed to visualize accumulated price movements in the form of waves, combined with volume peak analysis. It offers customizable visual themes to suit various trading styles and preferences, making it a versatile addition to any trader's toolkit. The indicator plots bullish and bearish waves as histograms in a separate window, with volume peaks highlighted to identify significant market movements.
Key Features

Wave Detection: Identifies bullish and bearish price waves based on pivot points and price change sensitivity, providing a clear view of market trends.
Volume Peaks: Highlights the two highest volume bars within each wave, scaled by a user-defined factor, to emphasize key market activity points.
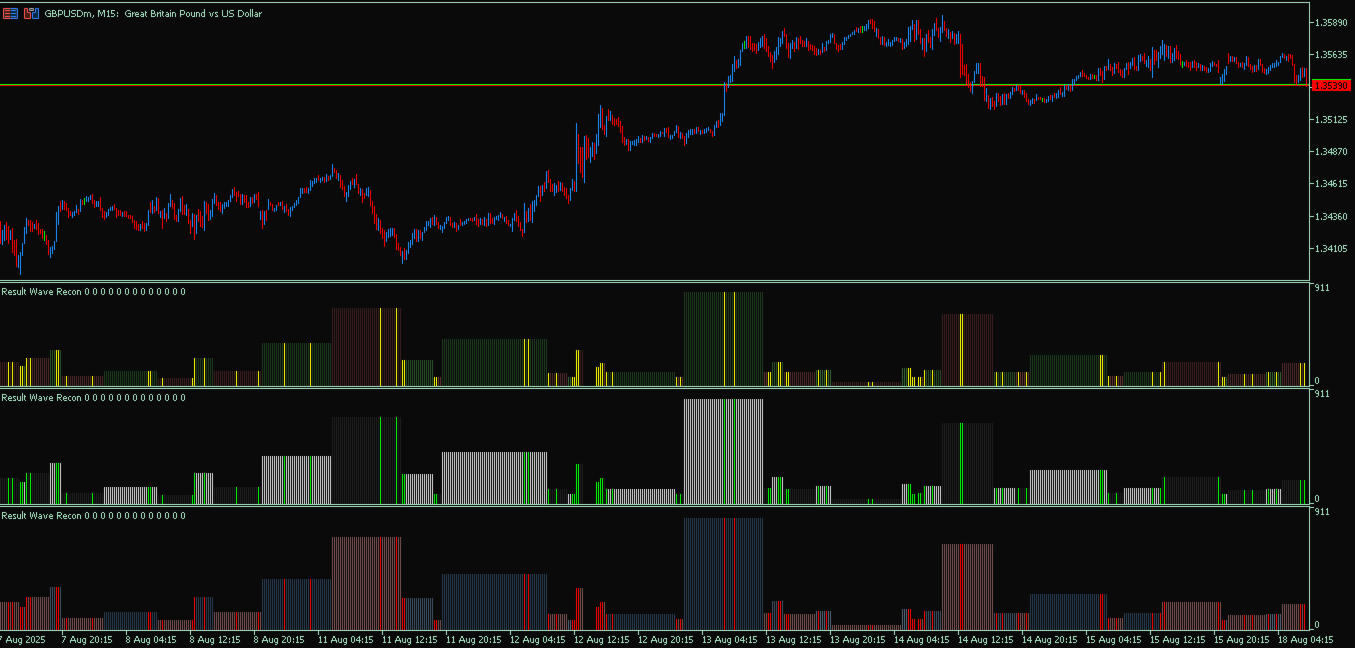
Customizable Themes: Offers six distinct visual themes (Classic, NightVision, OceanBreeze, FireAndIce, MidnightBlue, and Stealth) with unique color schemes for bullish and bearish waves.
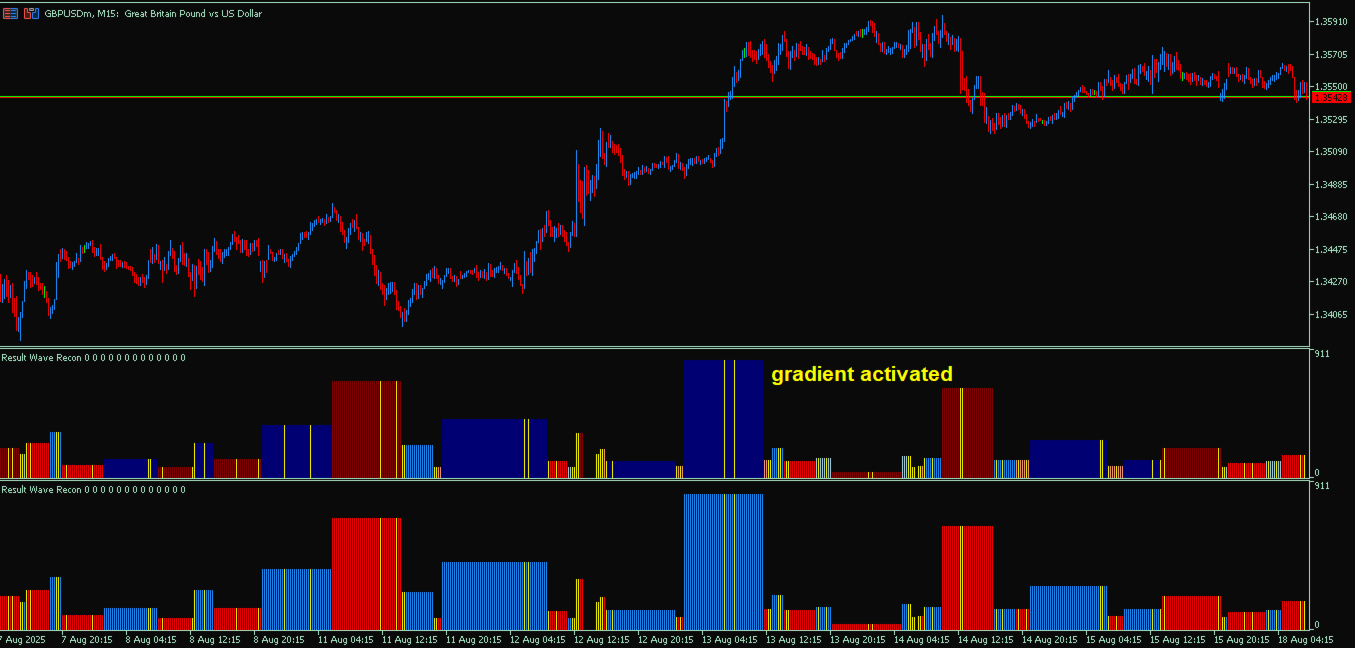
Color Gradient: Supports dynamic color gradients based on cumulative volume thresholds, enhancing visual differentiation of wave intensity (optional).
Performance Optimization: Includes an option to limit the number of bars calculated, improving performance on large datasets.
Flexible Parameters: Allows customization of pivot lookback, wave sensitivity, volume scaling, bar widths, and more.
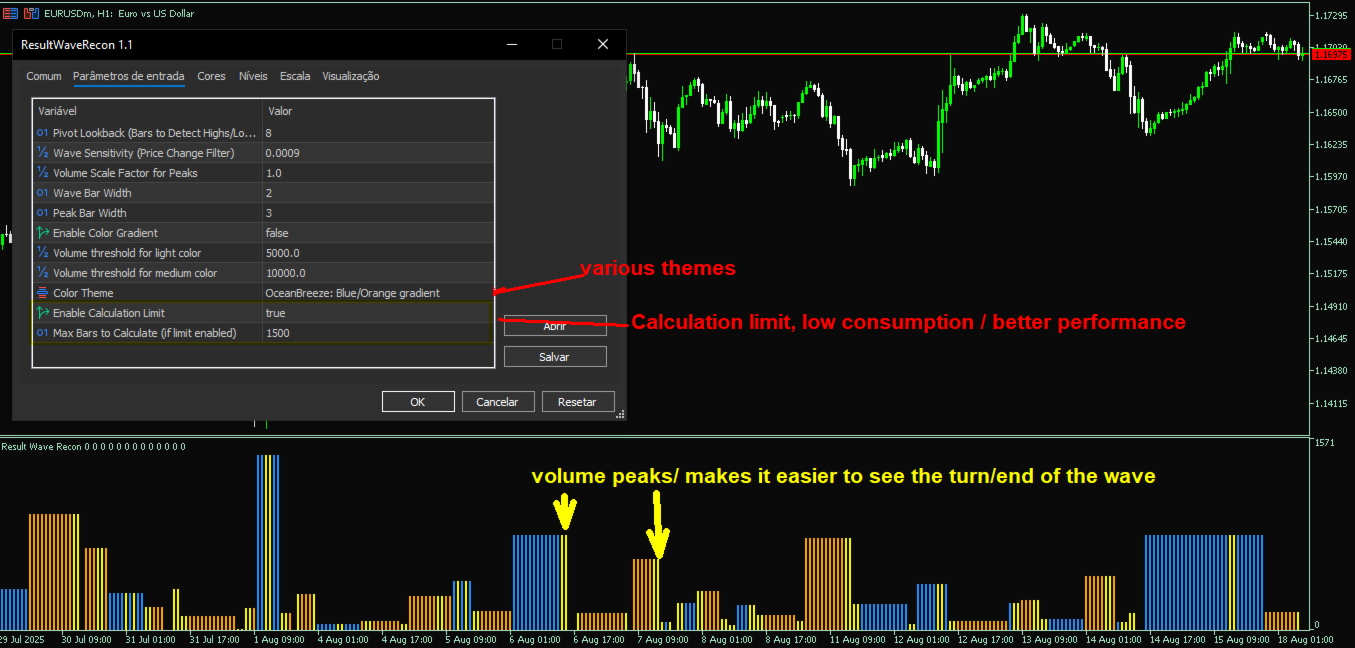
Input Parameters

Pivot Lookback (Bars to Detect Highs/Lows): Number of bars to consider for detecting pivot highs and lows (default: 8).
Wave Sensitivity (Price Change Filter): Minimum price change required to trigger a wave reversal (default: 0.0009).
Volume Scale Factor for Peaks: Scales the height of volume peak bars (default: 1.0).
Wave Bar Width: Width of wave histogram bars (default: 2).
Peak Bar Width: Width of volume peak bars (default: 3).
Enable Color Gradient: Toggles volume-based color gradients for waves (default: true).
Volume Low Threshold: Volume threshold for light color in gradients (default: 5000).
Volume Medium Threshold: Volume threshold for medium color in gradients (default: 10000).
Color Theme: Selects the visual theme (default: Classic). Options:
Classic: Green/Red gradient
NightVision: Dark green/gray-red gradient
OceanBreeze: Blue/Orange gradient
FireAndIce: Red/Blue gradient
MidnightBlue: Grayish-blue tones with red volume peaks
Stealth: Light gray/dark gray with green volume peaks


Enable Calculation Limit: Limits the number of bars processed for performance (default: true).
Max Bars to Calculate: Maximum number of bars to calculate when the limit is enabled (default: 1500).

Visual Elements

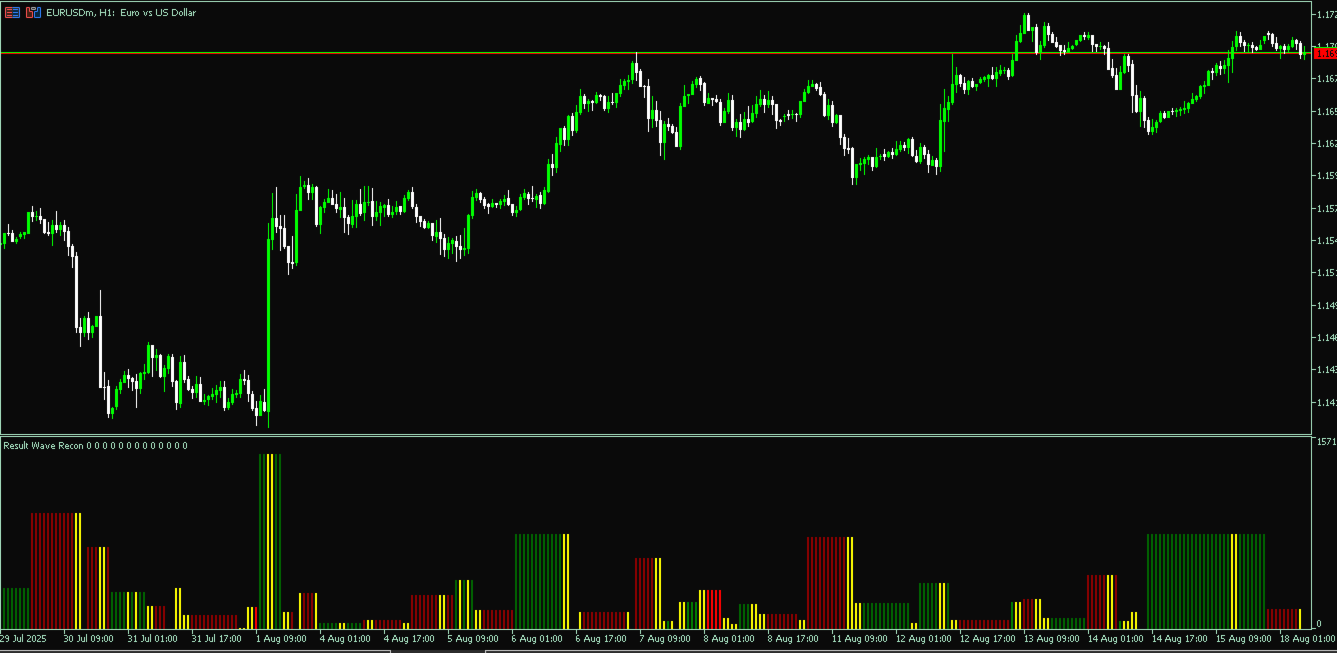
Bullish and Bearish Waves: Displayed as histograms in a separate window, with distinct colors for each theme. Each theme has dedicated buffers for bullish and bearish waves, with optional color gradients based on volume.
Volume Peaks: Plotted as histograms to highlight the two highest volume bars within each wave. Peak color varies by theme (yellow for most themes, red for MidnightBlue, green for Stealth).
Themed Visuals:
Classic: Light green to dark green for bullish waves, light coral to dark red for bearish waves.
NightVision: Dark green shades for bullish waves, gray-red shades for bearish waves.
OceanBreeze: Light blue to navy for bullish waves, light salmon to dark orange for bearish waves.
FireAndIce: Light blue to navy for bullish waves, light salmon to dark red for bearish waves.
MidnightBlue: Grayish-blue tones for bullish waves, red tones for bearish waves, with red volume peaks.
Stealth: White to gray for bullish waves, dark gray shades for bearish waves, with green volume peaks.


How It Works

Wave Detection: The indicator identifies pivot highs and lows using the specified lookback period. A wave is considered bullish or bearish based on price direction and sensitivity thresholds.
Wave Plotting: Accumulated price movement (in points) is plotted as a histogram for each wave, with separate buffers for bullish and bearish waves per theme.
Volume Analysis: The indicator tracks cumulative volume within each wave and highlights the two bars with the highest volume as peaks, scaled by the volume scale factor.
Color Management: Colors are dynamically assigned based on the selected theme and volume thresholds (if gradient is enabled). Fixed colors are used when the gradient is disabled.
Performance Control: The calculation can be limited to a user-defined number of bars to optimize performance on large charts.

Usage

Apply to Chart: Add the indicator to any MT5 chart. It appears in a separate window below the main price chart.
Customize Settings: Adjust input parameters to match your trading style, such as changing the theme, sensitivity, or volume thresholds.
Interpret Waves: Use bullish and bearish waves to identify trend direction and strength. Volume peaks indicate significant market activity, potentially signaling reversals or continuations.
Switch Themes: Experiment with different themes to find the most visually comfortable option for your trading environment.

Notes

The indicator uses tick volume for volume calculations, as real volume data may not be available for all symbols in MT5.
Ensure the chart has sufficient historical data for accurate pivot detection, especially with larger lookback values.
For optimal performance, enable the calculation limit on charts with extensive historical data.

Author

Jean Roso
Contact: jeantw7@gmail.com
Copyright: © 2025 Jean Roso. All rights reserved.

Prodotti consigliati
This indicator allows you to enjoy the two most popular products for analyzing request volumes and market deals at a favorable price: Actual Depth of Market Chart Actual Tick Footprint Volume Chart This product combines the power of both indicators and is provided as a single file. The functionality of Actual COMBO Depth of Market AND Tick Volume Chart is fully identical to the original indicators. You will enjoy the power of these two products combined into the single super-indicator! Below is
TRI Visualizer
Yoshimi Mon 三 Ura
TRI Visualizer MT5 – Thermodynamic Market Analysis Overview The TRI (Thermal Range Indicator) Visualizer Enhanced is a rare market analysis indicator that goes beyond conventional technical analysis, applying principles of thermodynamics from physics. It interprets market price fluctuations as “thermodynamic energy,” enabling the highly accurate detection of subtle market changes that are often overlooked. Innovative Mechanisms 1. Dual Calculation Engines Classic TRI Mode Formula: |Close
HiLo Activator Plus
Rodrigo Galeote
5 (1)
HiLo Activator is one of the most used indicators to determine trend. Find it here with the ability to customize period and colors. This indicator also plots up and down arrows when there is a change on the trend, indicating very strong entry and exit points. HiLo fits well to different types of periods for day trading. You can easily understand when it is time to buy or sell. It works pretty good also for other periods like daily and monthly signalizing long-term trends. The use of the indicato
PipFinite Binary Options PRO MT5
Karlo Wilson Vendiola
4.29 (14)
This LEGIT Indicator Can Accurately Predict the Outcome of One Bar. Imagine adding more filters to further increase your probability! Unlike other products, Binary Options PRO can analyze past signals giving you the statistical edge. How Increase Your Probability Information revealed here www.mql5.com/en/blogs/post/727038 NOTE: The selection of a Good Broker is important for the overall success in trading Binary Options. Benefits You Get Unique algorithm that anticipates price weakness. Gene
VeloTicker PRO — Real-Time Flow Reading VeloTicker PRO is an advanced indicator designed for traders looking to interpret market dynamics beyond just price. With an intuitive visual interface based on dual gauges (BUY vs. SELL), it transforms market flow into clear signals, enabling faster and more precise decision-making. What It Delivers Instant reading of buying and selling pressure Clear visualization in a gauge (speedometer) format Rapid response to market changes Intelligent smoot
SMC Confluence Dashboard
Guido Ambiorix Amparo Alcantara
SMC Confluence Dashboard Pro - Elite The most complete Smart Money Concepts indicator for MetaTrader 5. All ICT concepts unified in a professional dashboard. NON-REPAINTING. ALL-IN-ONE. BUILT FOR SERIOUS TRADERS. SMC Confluence Dashboard Pro combines all institutional trading concepts into a single real-time confluence engine that scores market setups from 0 to 12, so you always know exactly the strength of a trading opportunity before entering. WHAT YOU GET 6-Module Confluence Scoring System (
Signal Strike
Murtadha Majid Jeyad Al-Khuzaie
Signal Strike is a professional trading indicator designed for MetaTrader 5 that delivers clear, high‑confidence entry signals directly on your chart. Built with advanced logic that combines trend, momentum, volatility, and volume confirmation, this tool helps traders identify precise BUY and SELL opportunities with confidence. Unlike generic indicators, Signal Strike is engineered to filter out indecision candles and weak setups. When conditions align, the indicator plots entry, stop loss, an
Elliott Wave Drawing Tool for MT5 – The Ultimate Professional Wave Mapping System Take your market analysis to the next level with the Elliott Wave Drawing Tool for MT5 , an advanced charting solution designed for traders who demand precision, speed, and complete control in wave labeling. Engineered for both beginners and expert Elliotticians, this tool transforms manual wave marking into a smooth, intuitive, and highly accurate experience. Built with a smart drawing engine , this indicator lets
Zone di Volume Domanda/Offerta — Livelli Istituzionali di Supporto/Resistenza con Pressione Rialzista/Ribassista Supply Demand Volume   uno strumento di precisione progettato per rilevare automaticamente le principali zone di domanda e offerta basate sulla struttura del prezzo, analisi del volume e volatilità in tempo reale. Perfetto per i trader che utilizzano livelli accurati di supporto/resistenza, flussi d’ordine istituzionali, schemi Wyckoff o concetti Smart Money. Caratteristiche Princi
MACD + ADX Confluence Indicator (Short English description)Purpose Highlights strong trending candles where MACD and ADX give a confluence signal. Colors candles and places arrows only when both conditions are met.Main logic & signalsBullish signal (blue candle + blue ↑ arrow) MACD main line > 0 and ADX > selected level Bearish signal (red candle + red ↓ arrow) MACD main line < 0 **and** ADX > selected level Neutral candles When confluence is absent → candles keep default chart colors (no overl
EZ Trends
Guillermo Pineda
EZ Trends è un indicatore di rilevamento delle tendenze progettato per individuare in tempo reale i cambiamenti della struttura di mercato. Con un sistema ibrido EMA–HMA, evidenzia la direzione del trend tramite la colorazione adattiva delle candele e segna i livelli di reazione all’avvio di ogni nuova tendenza. Il risultato è uno strumento pratico che mantiene il trader allineato al momentum riducendo il rumore di mercato. CARATTERISTICHE PRINCIPALI Logica di rilevamento trend: Canale a tre lin
CS Bollinger
MIKHAIL VINOGRADOV
CS Bollinger – è un indicatore di segnali basato sulle Bande di Bollinger, sviluppato per identificare rapidamente livelli chiave di supporto e resistenza con segnali di trading visivi. Grazie a una logica migliorata per il cambio dei livelli, l'indicatore regola automaticamente i livelli sul grafico, mostrando frecce di segnale quando viene confermata un'inversione del prezzo. Ciò consente ai trader di individuare rapidamente i momenti favorevoli per l'ingresso e l'uscita dal mercato. L'indicat
Unlock the power of Smart Money Concepts (SMC) with precision and financial clarity. OTRX SMC is not just a technical indicator; it is a complete professional trading system designed for traders who follow institutional footprints. Unlike standard indicators that clutter your chart with noise, OTRX SMC focuses on the three pillars of Price Action: Structure (BOS) , Flow (FVG) , and Origin (OB) . The unique advantage of OTRX SMC is its Real-Time Risk Calculator . For every mapped structure or zon
Dual Confirmation PMAX-Supertrend Indicator: The Ultimate Trading Edge The Dual Confirmation PMAX-Supertrend Indicator represents a significant advancement in technical analysis tools for serious traders. This premium indicator combines two powerful trend-following systems into a single, streamlined solution that generates signals only when both systems agree, dramatically reducing false signals and improving trading precision. Superior Signal Accuracy Through Dual Confirmation Trading success d
Trendline Targets Dashboard MT5 Trendline Targets Dashboard MT5 è un indicatore per MetaTrader 5 che visualizza un piano di trading completo: segnale , Ingresso (Entry) , Stop Loss e Take Profits calcolati automaticamente in multipli di R (rischio). Questo indicatore non esegue ordini. È uno strumento di analisi e gestione visiva, non un robot di trading. Offerta di lancio: Ogni acquisto dà diritto a 1 indicatore in omaggio a scelta dal mio profilo MQL5. Eccezione: Il bonus non si applica al pr
WickAndBody Volume Flow
Henry Armando Baltazar
WickAndBody Volume Flow v5.2 Order Flow Analysis through Candle Segmentation The WickAndBody Volume Flow is an advanced diagnostic tool for MetaTrader that allows traders to "see" inside every Japanese candlestick. Unlike conventional volume indicators, this algorithm utilizes Multi-Timeframe (MTF) technology to break down real volume and determine exactly how much capital was traded in the wicks versus the candle body . Key Features Volume Detection: Uses lower timeframe data (M1/M5) to reconst
FREE
The indicator produces signals according to the methodology VSA (Volume Spread Analysis) - the analysis of trade volume together with the size and form of candlesticks. The signals are displayed at closing of bars on the main chart in the form of arrows. The arrows are not redrawn. Input Parameters: DisplayAlert - enable alerts, true on default; Pointer - arrow type (three types), 2 on default; Factor_distance - distance rate for arrows, 0.7 on default. Recommended timeframe - М15. Currency pair
**SPECIAL LAUNCH PRICING:** **REGULAR PRICE:** ~~$200~~ **PROMO LAUNCH PRICE:** **$100** **YOU SAVE:** $100 (50% OFF) **PRICE INCREASE WILL INCREASE EVERY 10 SALE :** *$100 increases with every sale!* --- Smart Boxes Indicator: Multi‑Session Breakout, Wick Rejection & Smart Signal System Smart Boxes  is a professional‑grade market structure indicator engineered for traders who rely on precision, session timing, and clean intraday levels. It automatically maps the Opening Range, Yeste
The professional tool of stock traders in now available on MetaTrader 5 . The Actual depth of market chart indicator visualizes the depth of market in the form of a histogram displayed on a chart, which refreshes in the real-time mode. Meet new updates according to user requests! Now Actual Depth of Market indicator displays the current ratio of volume of buy and sell requests (B/S ratio). It shows the share of volume of each type of requests in the entire flow of requests as well as the absolu
VolumeDeltaMT5
Stanislav Korotky
This indicator provides the analysis of tick volume deltas. It calculates tick volumes for buys and sells separately, and their delta on every bar, and displays volumes by price clusters (cells) within a specified bar (usually the latest one). This is a limited substitution of market delta analysis based on real volumes, which are not available on Forex. The indicator displays the following data in its sub-window: light-blue histogram - buy (long) volumes; orange histogram - sell (short) volumes
Volume Profile V6
Andrey Kolesnik
4.67 (3)
Indicatore del profilo di volume del mercato + oscillatore intelligente. Funziona su quasi tutti gli strumenti: coppie di valute, azioni, futures, criptovalute, sia su volumi reali che su tick. È possibile impostare la definizione automatica dell'intervallo di costruzione del profilo (ad esempio, per una settimana o un mese, ecc.), oppure impostare l'intervallo manualmente spostando i confini (due linee verticali: rossa e blu). Viene visualizzato sotto forma di istogramma. La larghezza dell'isto
##   ONLY GOLD ##   Тiльки Золото ## **Mercaria Professional Trading Zones - Complete Guide** ## **Mercaria Professional Trading Zones - Повний посібник** ### **How Mercaria Zones Work / Як працюють зони Mercaria** **English:** Mercaria Zones is an advanced trading indicator that identifies high-probability support and resistance areas using ZigZag extremes combined with mathematical zone calculations. The indicator works on multiple timeframes simultaneously, providing a comprehensive view
EKIT Fib Trend
Eklon Eleuterio De Sousa
EKIT FibTrend Prime is a trend-confirmation indicator built for traders who prefer structured entries over noisy signals. It is designed to help identify cleaner participation points in directional markets while keeping the workflow simple, readable, and execution-focused. The indicator prioritizes confirmation, market structure alignment, and selective timing. Instead of encouraging constant participation, it is built to help traders wait for higher-quality setups and reduce unnecessary exposur
MTF-Candlestick (Traders Club) 特徴: このインジケータは上位足のローソク足を表示します。 この上位足のローソク足を表示のインジケータは特に1分足や 5分足トレーダ用に開発されたものになります。 現在のローソク足で上位足のローソク足を作成する部分 と過去の上位足のローソク足を作成する部分を 分けています。また、更新はティックごとではなく 指定した時間ごとになるので急な価格変動があった場合でも チャートがフリーズした状態には非常になりにくいということになります。 陽線や陰線の色を変更出来たり髭の太さを変更できるので非常に 見やすと思います。 各パラメータの説明: Indicator No:インジケータNoを設定します。もし同じチャートに複数適用したい場合には個々の数字を変更してください。 TimeFrame:表示する時間足を設定します。 Bullish candlestick color:陽線のローソク足の色の指定します。 Bearish candlestick color:陰線のローソク足の色の指定します。 Doji candles
RENKO PRICE ACTION ATR is an "Expert Advisor" developed through the construction of the Renko Chart where each BRICK has the size calculated through the ATR of the period selected by the user. Renko charts are designed to filter out minor price movements, thus making it easier for traders to focus on important trends. Due to its efficiency in detecting price trends, it is also possible to clearly identify supports and resistances as well as top and bottom divergences, thus making better use of t
US30NinjaMT5
Satyaseelan Shankarananda Moodley
US30 Ninja is a 5 minute scalping indicator that will let know you when there is a trade set up (buy or sell). Once the indicator gives the trade direction, you can open a trade and use a 30 pip stop loss and a 30 pip to 50 pip take profit. Please trade at own own risk. This indicator has been created solely for the US30 market and may not yield positive results on any other pair. 
Institutional Flow Dashboard is a comprehensive technical analysis tool that combines two powerful methodologies: Volume Profiling and Relative Currency Strength . This all-in-one interface is designed to help traders identify high-liquidity price levels and market momentum in real-time. Key Features: Volume Profile Analysis: Visualizes the distribution of volume across price levels, identifying the Point of Control (POC) and Value Area (VA) . Multi-Currency Strength Meter: Analyses 8 major curr
Heikin Ashi candlesticks are a powerful tool for traders, offering a clear and smooth visualization of market trends. Unlike traditional candlesticks, they filter out market noise, providing a cleaner view of the market's direction and strength, which helps traders make more informed decisions. The Hull Heikin Ashi Smoothed indicator from Minions Labs takes this a step further by integrating the Hull Moving Average for enhanced smoothing and precision. This indicator not only simplifies trend id
Mette in evidenza le sessioni di trading sul grafico Versione a pagamento del prodotto Trading_Sessions_Indicator_Free con la possibilità di personalizzare l'inizio/fine delle sessioni. L'indicatore delle sessioni di trading evidenzia l'inizio e la fine di ogni sessione di trading. [OPTION:] Asian session Open Asian session Close Asian session OpenSummertime Asian session CloseSummertime European session Open European session Close European session Open European session Close Timeshift Si p
Weis Wave Result MT5
Sant Clear Ali Costa
Features 3 types of waves: bullish, bearish and unknown. The unknown tower comes when prices move in opposite the direction of the current tower. Label that shows the percentage remaining for the next tower. Allows you set the type of volume that will be accumulated in the towers, either real or tick volumes. Thus, the indicator works in any market, for example: stocks, futures, forex, commodities, etc. Allows you to set the required score for the tower exchange. Allows you to set the font size
Gli utenti di questo prodotto hanno anche acquistato
ARIPoint
Temirlan Kdyrkhan
ARIPoint is a powerful trading companion designed to generate high-probability entry signals with dynamic TP/SL/DP levels based on volatility. Built-in performance tracking shows win/loss stats, PP1/PP2 hits, and success rates all updated live. Key Features: Buy/Sell signals with adaptive volatility bands Real-time TP/SL/DP levels based on ATR Built-in MA Filter with optional ATR/StdDev volatility Performance stats panel (Success, Profit/Loss, PP1/PP2) Alerts via popup, sound, push, or email Cu
SuperScalp Pro
Van Minh Nguyen
4.57 (21)
SuperScalp Pro – Sistema avanzato di indicatore scalping multi-filtro SuperScalp Pro è un indicatore di scalping avanzato che combina il classico Supertrend con molteplici filtri intelligenti di conferma per aiutare a identificare opportunità di trading. Funziona in modo efficiente su diversi timeframe da M1 a H4, con prestazioni ottimizzate su XAUUSD, BTCUSD e principali coppie Forex. L’indicatore fornisce chiari segnali Buy e Sell, insieme a livelli di ingresso, stop loss e take profit calcola
Divergence Bomber
Ihor Otkydach
4.9 (86)
Ogni acquirente dell’indicatore riceverà inoltre gratuitamente: L’utilità esclusiva “Bomber Utility”, che gestisce automaticamente ogni operazione, imposta i livelli di Stop Loss e Take Profit e chiude le posizioni secondo le regole della strategia I file di configurazione (set file) per adattare l’indicatore a diversi asset I set file per configurare il Bomber Utility in tre modalità: “Rischio Minimo”, “Rischio Bilanciato” e “Strategia di Attesa” Una guida video passo-passo per installare, conf
Entry In The Zone and SMC Multi Timeframe is a real-time 2-in-1 market analysis tool that combines market structure analysis and a No Repaint BUY / SELL signal system into a single indicator, built on Smart Money Concepts (SMC) — a widely adopted framework used by professional traders to understand market structure. This indicator helps you see the market more clearly, make decisions based on structure rather than guesswork, and focus on high-probability zones where price is more likely to react
Quantum TrendPulse
Bogdan Ion Puscasu
5 (23)
Ecco   Quantum TrendPulse   , lo strumento di trading definitivo che combina la potenza di   SuperTrend   ,   RSI   e   Stocastico   in un unico indicatore completo per massimizzare il tuo potenziale di trading. Progettato per i trader che cercano precisione ed efficienza, questo indicatore ti aiuta a identificare con sicurezza le tendenze di mercato, i cambiamenti di momentum e i punti di entrata e uscita ottimali. Caratteristiche principali: Integrazione SuperTrend:   segui facilmente l'andame
Power Candles MT5
Daniel Stein
4.75 (8)
Power Candles – Segnali di ingresso basati sulla forza per tutti i mercati Power Candles porta l’analisi di forza collaudata di Stein Investments direttamente sul grafico dei prezzi. Invece di reagire solo al prezzo, ogni candela viene colorata in base alla reale forza di mercato, consentendo di identificare immediatamente accumuli di momentum, accelerazioni della forza e transizioni di trend pulite. Un’unica logica per tutti i mercati Power Candles funziona automaticamente su tutti i simboli di
Azimuth Pro
Ottaviano De Cicco
5 (7)
Azimuth Pro V2: Synthetic Fractal Structure and Confirmed Entries for MT5 Overview Azimuth Pro is a multi-level swing structure indicator by Merkava Labs . Four nested swing layers, swing-anchored VWAP, ABC pattern detection, three-timeframe structural filtering, and closed-bar confirmed entries — one chart, one workflow from micro-swings to macro-cycles. This is not a blind signal product. It is a structure-first workflow for traders who care about location, context, and timing. V2 Launch Offe
Gann Made Easy è un sistema di trading Forex professionale e facile da usare che si basa sui migliori principi del trading utilizzando la teoria di mr. WD Gann. L'indicatore fornisce segnali ACQUISTA e VENDI accurati, inclusi i livelli di Stop Loss e Take Profit. Puoi fare trading anche in movimento utilizzando le notifiche PUSH. CONTATTAMI DOPO L'ACQUISTO PER RICEVERE GRATUITAMENTE LE ISTRUZIONI DI TRADING E OTTIMI INDICATORI EXTRA! Probabilmente hai già sentito parlare molte volte dei metodi d
Se acquisti questo indicatore, riceverai il mio Trade Manager Professionale + EA  GRATUITAMENTE. Innanzitutto è importante sottolineare che questo sistema di trading è un indicatore Non-Repainting, Non-Redrawing e Non-Lagging, il che lo rende ideale sia per il trading manuale che per quello automatico. Corso online, manuale e download di preset. Il "Sistema di Trading Smart Trend MT5" è una soluzione completa pensata sia per i trader principianti che per quelli esperti. Combina oltre 10 indicat
FX Trend MT5 NG
Daniel Stein
5 (4)
FX Trend NG: La Nuova Generazione di Intelligenza di Trend Multi-Mercato Panoramica FX Trend NG è uno strumento professionale di analisi del trend multi-timeframe e monitoraggio dei mercati. Ti consente di comprendere la struttura completa del mercato in pochi secondi. Invece di passare tra numerosi grafici, puoi identificare immediatamente quali strumenti sono in trend, dove il momentum sta diminuendo e dove esiste un forte allineamento tra i timeframe. Offerta di Lancio – Ottieni FX Trend NG
SignalTech MT5 is a trading system for EURUSD, USDCHF, USDJPY, AUDUSD, NZDUSD, EURJPY, AUDJPY, NZDJPY, CADJPY H2 and H3 Timeframe.  It can generate signals with Buy/Sell Arrows and Pop-Up/Sound Alerts. Each signal has clear Entry and Stop Loss levels, which should be automatically flagged on the chart, as well as potential Targets 1, 2, and 3. The Entry and TP levels are fixed after the trade is taken. The exit level is dynamic. If there are signs of a potential short-term trend reversal, the
Cominciamo con la verità. Nessun indicatore da solo ti renderà profittevole. Se qualcuno ti dice il contrario, ti sta vendendo un sogno. Qualsiasi indicatore che mostra frecce perfette di acquisto/vendita può essere reso impeccabile — basta ingrandire la giusta sezione della storia e catturare solo i trade vincenti. Noi non lo facciamo.  SMC Intraday Formula è uno strumento. Legge la struttura del mercato per te, identifica le zone a più alta probabilità e ti mostra esattamente come appare la t
Presentazione       Quantum Breakout PRO   , l'innovativo indicatore MQL5 che sta trasformando il modo in cui scambi le zone di breakout! Sviluppato da un team di trader esperti con un'esperienza di trading di oltre 13 anni,       Quantum Breakout PRO       è progettato per spingere il tuo viaggio di trading a nuovi livelli con la sua strategia innovativa e dinamica della zona di breakout. Quantum Breakout Indicator ti fornirà frecce di segnalazione sulle zone di breakout con 5 zone target di
Grabber System MT5
Ihor Otkydach
4.83 (23)
Ti presento un eccellente indicatore tecnico: Grabber, che funziona come una strategia di trading "tutto incluso", pronta all’uso. In un solo codice sono integrati strumenti potenti per l’analisi tecnica del mercato, segnali di trading (frecce), funzioni di allerta e notifiche push. Ogni acquirente di questo indicatore riceve anche gratuitamente: L’utility Grabber: per la gestione automatica degli ordini aperti Video tutorial passo dopo passo: per imparare a installare, configurare e utilizzare
Meravith MT5
Ivan Stefanov
5 (1)
Strumento per market maker. Meravith: Analizzerà tutti i timeframe e mostrerà il trend attualmente in corso. Evidenzierà le zone di liquidità (equilibrio dei volumi) dove i volumi rialzisti e ribassisti sono uguali. Mostrerà tutti i livelli di liquidità dei diversi timeframe direttamente sul grafico. Genererà e presenterà un’analisi di mercato testuale a scopo di riferimento. Calcolerà obiettivi, livelli di supporto e punti di stop-loss in base al trend attuale. Calcolerà il rapporto rischio/ren
Trend Screener Pro MT5
STE S.S.COMPANY
4.85 (104)
Indicatore di tendenza, soluzione unica rivoluzionaria per il trading di tendenze e il filtraggio con tutte le importanti funzionalità di tendenza integrate in un unico strumento! È un indicatore multi-timeframe e multi-valuta al 100% non ridipingibile che può essere utilizzato su tutti i simboli/strumenti: forex, materie prime, criptovalute, indici e azioni. Trend Screener è un indicatore di tendenza che segue un indicatore efficiente che fornisce segnali di tendenza a freccia con punti nel gra
CGE Trading Suite
Carl Gustav Johan Ekstrom
5 (2)
Institutional-Grade Analytics for MT5 C GE Trading Suite delivers the analytical edge typically reserved for professional trading desks. The platform integrates a full suite of analytical tools into one seamless workflow: dynamic grid mapping, liquidity behavior analysis, ECM, trend lines, MIDAS, trade cycles, and directional channel projections. Together, these provide a unified view of market structure and momentum. Directional clarity is further enhanced by the capital flow index, which meas
Scopri quale strategia funziona davvero sul tuo simbolo - prima di rischiare denaro reale. Power Bar rileva le barre di prezzo estreme su qualsiasi simbolo e qualsiasi timeframe, poi esegue istantaneamente il backtest di 3 diverse strategie di trading per confrontare tassi di vincita, fattori di profitto e P&L fianco a fianco. Tutto in un unico pannello interattivo. Niente supposizioni. Niente curve-fitting. Solo dati. Cosa rende Power Bar unico? La maggior parte degli indicatori fornisce un se
Btmm state engine pro
Garry James Goodchild
5 (4)
BTMM State Engine Pro is a MetaTrader 5 indicator for traders who use the Beat The Market Maker approach: Asian session context, kill zone timing, level progression, peak formation detection, and a multi-pair scanner from a single chart. It combines cycle state logic with a built-in scanner dashboard so you do not need the same tool on many charts at once. What it does Draws the Asian session range; session times can follow broker server offset or be set in inputs. Tracks level progression (L
Atomic Analyst MT5
Issam Kassas
3.94 (31)
Innanzitutto, vale la pena sottolineare che questo indicatore di trading non è repaint, non è ridisegno e non presenta ritardi, il che lo rende ideale sia per il trading manuale che per quello automatico. Manuale utente: impostazioni, input e strategia. L'Analista Atomico è un indicatore di azione del prezzo PA che utilizza la forza e il momentum del prezzo per trovare un miglior vantaggio sul mercato. Dotato di filtri avanzati che aiutano a rimuovere rumori e segnali falsi, e aumentare il pote
FX Power MT5 NG
Daniel Stein
5 (31)
FX Power: Analizza la Forza delle Valute per Decisioni di Trading Più Intelligenti Panoramica FX Power è lo strumento essenziale per comprendere la reale forza delle principali valute e dell'oro in qualsiasi condizione di mercato. Identificando le valute forti da comprare e quelle deboli da vendere, FX Power semplifica le decisioni di trading e rivela opportunità ad alta probabilità. Che tu segua le tendenze o anticipi inversioni utilizzando valori estremi di Delta, questo strumento si adatta
OmniSync Projection
Antonio-alin Teculescu
5 (1)
Chronos Fractal Engine is an innovative price projection indicator for MetaTrader 5, designed to transform your technical analysis by intelligently identifying and projecting historical price patterns. Built upon an advanced correlation algorithm and the fractal principles of the market, this powerful tool visualizes potential future price movements, giving you a unique edge in your trading decisions. What is Chronos Fractal Engine? At its core, the Chronos Fractal Engine employs a sophisticat
Bill Williams Advanced
Siarhei Vashchylka
5 (11)
Bill Williams Advanced is designed for automatic chart analysis using Bill Williams' "Profitunity" system. The indicator analyzes four timeframes at once. Manual (Be sure to read before purchasing) Advantages 1. Analyzes the chart using Bill Williams' "Profitunity" system. Signals are displayed in a table in the corner of the screen and on the price chart. 2. Finds all known AO and AC signals, as well as zone signals. Equipped with a trend filter based on the Alligator. 3. Finds "Divergence Bar
Berma Bands
Muhammad Elbermawi
5 (8)
L'indicatore Berma Bands (BBs) è uno strumento prezioso per i trader che cercano di identificare e capitalizzare i trend di mercato. Analizzando la relazione tra il prezzo e le BBs, i trader possono discernere se un mercato è in una fase di trend o di range. Visita il [ Berma Home Blog ] per saperne di più. Le Berma Bands sono composte da tre linee distinte: la Upper Berma Band, la Middle Berma Band e la Lower Berma Band. Queste linee sono tracciate attorno al prezzo, creando una rappresentazion
Market Structure Order Block Dashboard MT5 è un indicatore MT5 progettato per i trader che vogliono leggere la struttura di mercato e le principali zone di reazione del prezzo direttamente sul grafico. Combina BOS, ChoCH, Order Blocks, Fair Value Gaps (FVG), Liquidità, Kill Zones, Volume Profile e un pannello compatto per un'analisi rapida. Questo indicatore è rivolto ai trader che utilizzano la struttura di mercato, i concetti ICT e Smart Money come quadro decisionale. Può aiutare a individuare
Auto Optimized Parabolic RSI: Motore di Momentum 3D Avanzato La maggior parte degli indicatori per trader privati fallisce perché si affida a parametri statici che smettono di funzionare nel momento in cui la volatilità del mercato cambia. Auto Optimized Parabolic RSI risolve il problema dell'"obsolescenza dell'indicatore" ricalcolando continuamente il proprio vantaggio matematico, portando un adattamento quantitativo di livello istituzionale direttamente sul tuo terminale MT5. Il Vantaggio Prin
Crystal Heikin Ashi Signals
Muhammad Jawad Shabir
5 (2)
Crystal Heikin Ashi Signals - Professional Trend & Signal Detection Indicator Advanced Heikin Ashi Visualization with Intelligent Signal System for Manual & Automated Trading Final Price: $149 ---------> Price goes up $10 after every 10 sales . Limited slots available — act fast . Overview Crystal Heikin Ashi Signals is a professional-grade MetaTrader 5 indicator that combines pure Heikin Ashi candle visualization with an advanced momentum-shift detection system. Designed for both manual traders
Meridian Pro
Ottaviano De Cicco
5 (1)
Meridian Pro: Professional Multi-Timeframe Trend Matrix for MT5 Overview Meridian Pro is a multi-timeframe trend matrix by Merkava Labs that compresses directional state, strength, momentum condition and matrix agreement into one compact panel. One adaptive engine, applied consistently from M1 to W1. No per-symbol tuning. No indicator stacking. One structured readout across every asset and every timeframe. Launch Offer — Get Meridian Pro for USD 99 (introductory). Regular price: USD 149. 1. Why
Top indicator for MT5   providing accurate signals to enter a trade without repainting! It can be applied to any financial assets:   forex, cryptocurrencies, metals, stocks, indices .  Watch  the video  (6:22) with an example of processing only one signal that paid off the indicator! MT4 version is here It will provide pretty accurate trading signals and tell you when it's best to open a trade and close it. Most traders improve their trading results during the first trading week with the help of
Trend indicator AI mt5
Ramil Minniakhmetov
5 (16)
Trend Ai indicator è un ottimo strumento che migliorerà l'analisi di mercato di un trader combinando l'identificazione della tendenza con punti di ingresso utilizzabili e avvisi di inversione. Questo indicatore consente agli utenti di navigare nelle complessità del mercato forex con fiducia e precisione Oltre ai segnali primari, l'indicatore Ai di tendenza identifica i punti di ingresso secondari che si presentano durante i pullback o i ritracciamenti, consentendo ai trader di capitalizzare le
Altri dall’autore
Weis Wave Scouter Basic
Jean Carlos Martins Roso
5 (1)
Il Weis Wave Scouter Basic è la versione essenziale del nostro rinomato indicatore per MetaTrader 5, progettato per i trader che desiderano esplorare i concetti del metodo Wyckoff e dell'analisi VSA (Volume Spread Analysis) in modo accessibile ed efficiente. Basato sulla lettura delle onde di volume, questo indicatore semplificato consente di identificare chiaramente i movimenti di mercato, concentrandosi sui principi di sforzo vs risultato e domanda e offerta, come insegnato da Richard Wyckoff.
FREE
WeisWaveScouter
Jean Carlos Martins Roso
WeisWaveScouter is a powerful and accurate indicator designed to help traders detect key market movements based on price and volume waves. Built for the MetaTrader 4 platform, WeisWaveScouter provides detailed analysis of bullish and bearish waves, as well as highlighting volume spikes, giving you a clear view of market conditions. Key Features: Bullish and Bearish Waves: Easily identify bullish and bearish movements with waves clearly differentiated by customizable colors. Volume Spikes: Det
EmaCloud
Jean Carlos Martins Roso
Get ready to trade with real strategy using EmaCloud — the indicator built for traders who demand clarity, speed, and smarter decisions. Map market trends with precision using moving-average clouds (EMA, SMA, SMMA, and LWMA) and spot directional shifts before the crowd. Customize your workspace with 8 tactical-inspired visual themes, from “Classic” mode to “Forest,” adapting the environment to your trading style. Receive clear buy and sell signals with complete alerts: chart arrows, pop-ups, pus
Volume Thermal Vision Basic
Jean Carlos Martins Roso
Volume Thermal Vision Basic è la versione semplificata del rinomato indicatore Volume Thermal Vision, progettata per i trader che desiderano analizzare l’intensità del volume con praticità ed efficienza. Con 6 livelli di colori vivaci, scegli tra le modalità StealthMode, NightVision e FrostVision per visualizzare i dati di volume in modo chiaro e strategico. Perfetto per i principianti o come complemento alla tua analisi, questo indicatore è leggero, intuitivo e ideale per ottimizzare le tue dec
FREE
Volume ThermalVision
Jean Carlos Martins Roso
Volume Thermal Vision - Advanced Volume Analysis for MetaTrader 4 Unlock the power of volume analysis with Volume Thermal Vision, a sophisticated indicator designed to enhance your trading decisions. Developed by Jean Roso, this tool provides a dynamic visualization of volume intensity through a customizable heatmap, empowering traders to identify market trends and potential reversals with precision. Key Features: Multi-Protocol Visualization: Choose from five distinct protocols—Tactical, Steal
Volume Thermal Vision
Jean Carlos Martins Roso
Scopri il Potere del Volume con Volume Thermal Vision Sei pronto a portare il tuo trading al livello successivo? Presentiamo Volume Thermal Vision, l’indicatore di volume definitivo per MetaTrader 5 che trasforma l’analisi del volume in un vantaggio strategico. Sviluppato per trader che vogliono identificare opportunità ad alta probabilità, questo indicatore è perfetto per metodologie come VSA (Volume Spread Analysis), ICT (Inner Circle Trader), SMC (Smart Money Concepts) e Wyckoff, aiutandoti a
Weis Wave Scouter
Jean Carlos Martins Roso
Scopri la potenza dell'analisi avanzata del volume con Weis Wave Scouter, un indicatore rivoluzionario per MetaTrader 5 che combina i principi comprovati del metodo Wyckoff e dell'analisi VSA (Volume Spread Analysis). Progettato per trader che cercano precisione e profondità nelle loro operazioni, questo indicatore offre una lettura tattica del mercato attraverso l'analisi delle onde di volume cumulativo, aiutando a individuare punti chiave di inversione e continuazione di tendenza. Weis Wave Sc
MACD Crossfire
Jean Carlos Martins Roso
MACD Crossfire MACD-based indicator designed to help traders filter crossover signals using risk context, momentum, and volume. Instead of showing raw signals only, MACD Crossfire evaluates the quality of each setup and highlights when market conditions are not favorable for trading. What the indicator does Detects MACD crossovers Scores signal quality (0 to 5 stars) Measures market risk (0–100%) Shows whether momentum is gaining or losing strength Detects divergences between price and indi
VSA Smart Engine
Jean Carlos Martins Roso
VSASmartEngine - VSA Volume Intelligence System VSASmartEngine is a technical indicator for MetaTrader 5 based on VSA (Volume Spread Analysis) methodology. The system is designed to provide an objective reading of market activity, helping traders identify aggression, absorption, and exhaustion states by analyzing the relationship between volume and price action. The indicator features a dual-processing architecture, allowing the user to switch between the full VSA logic engine or a simplified h
Filtro:
Nessuna recensione
Rispondi alla recensione