Horizontals
- Indicatori
-
Ahmed Alaaeldin Abdulrahman Ahmed Elherzawi
 Every day is a new opportunity. You can build on yesterday's success or put its failures behind and start over again. That's the way life is, with a new game every day, and that's the way baseball is.
 - Versione: 1.0
- Attivazioni: 5
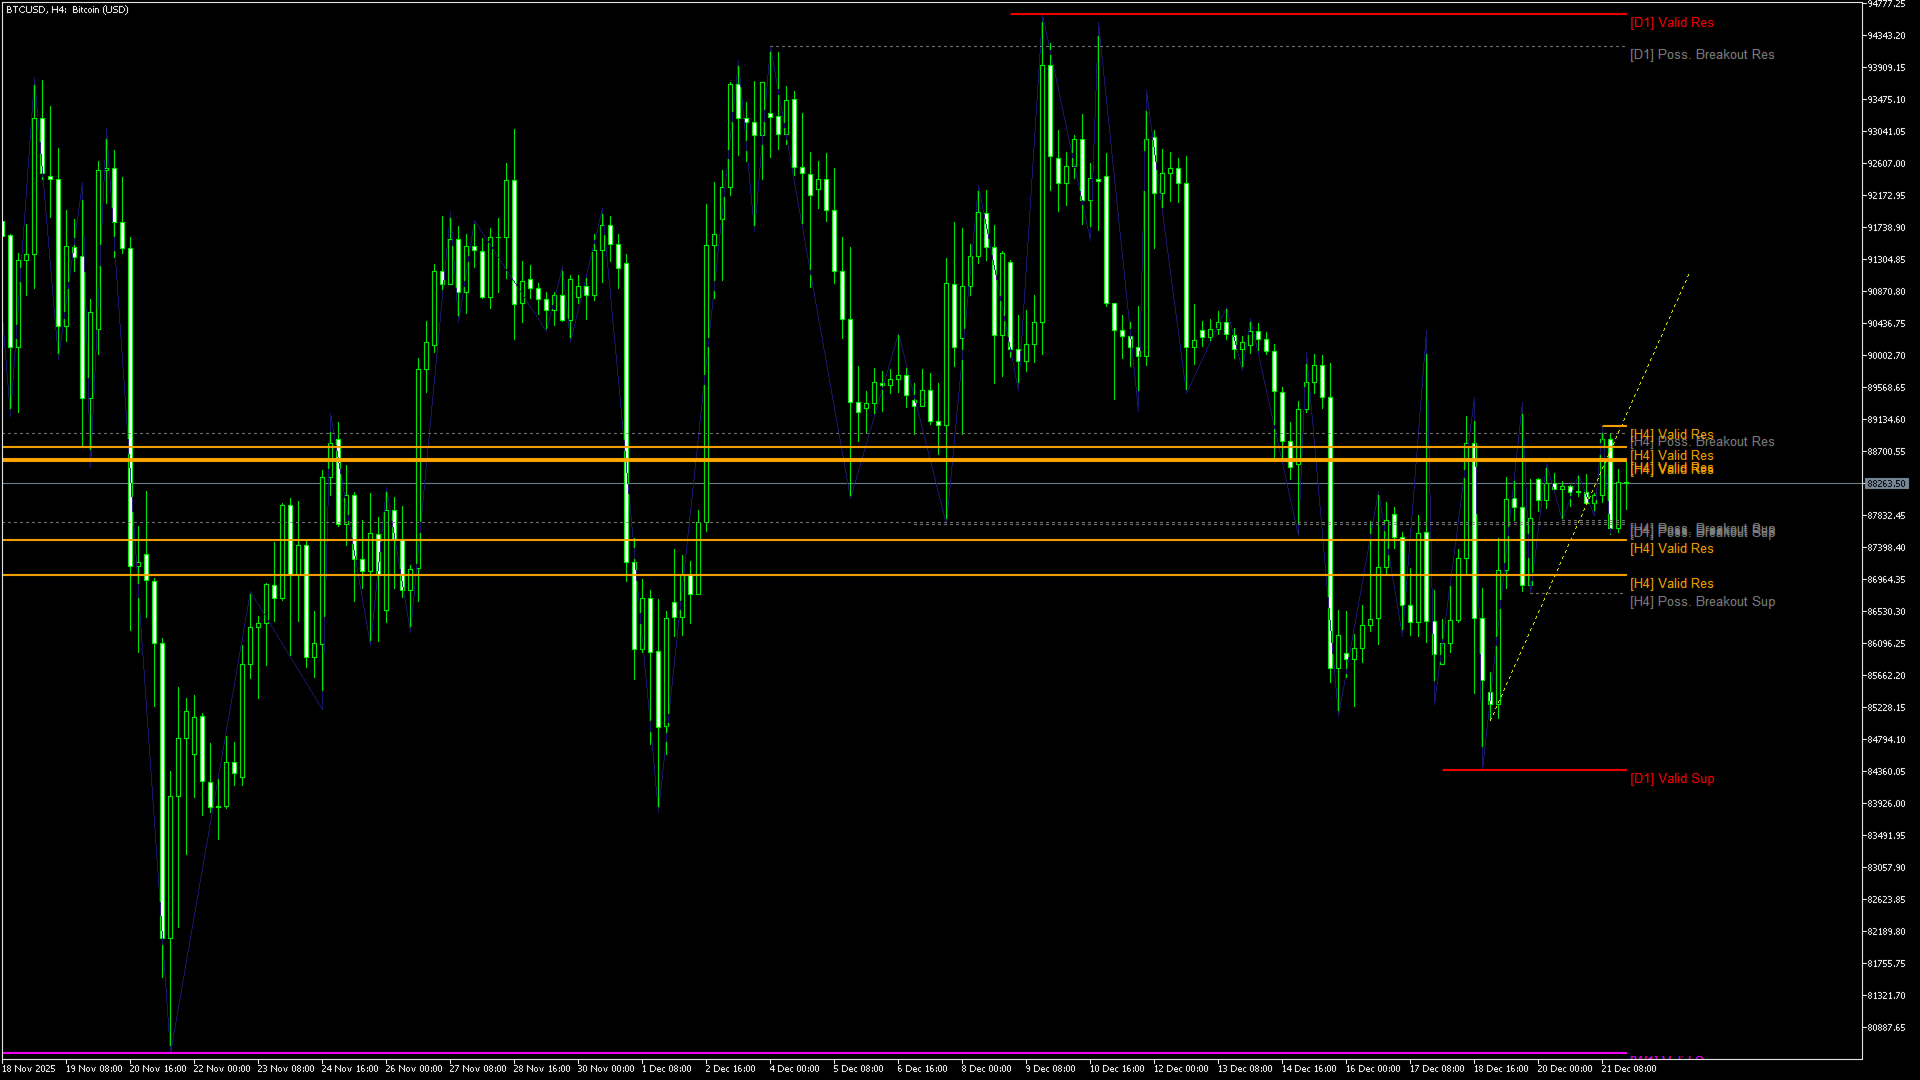
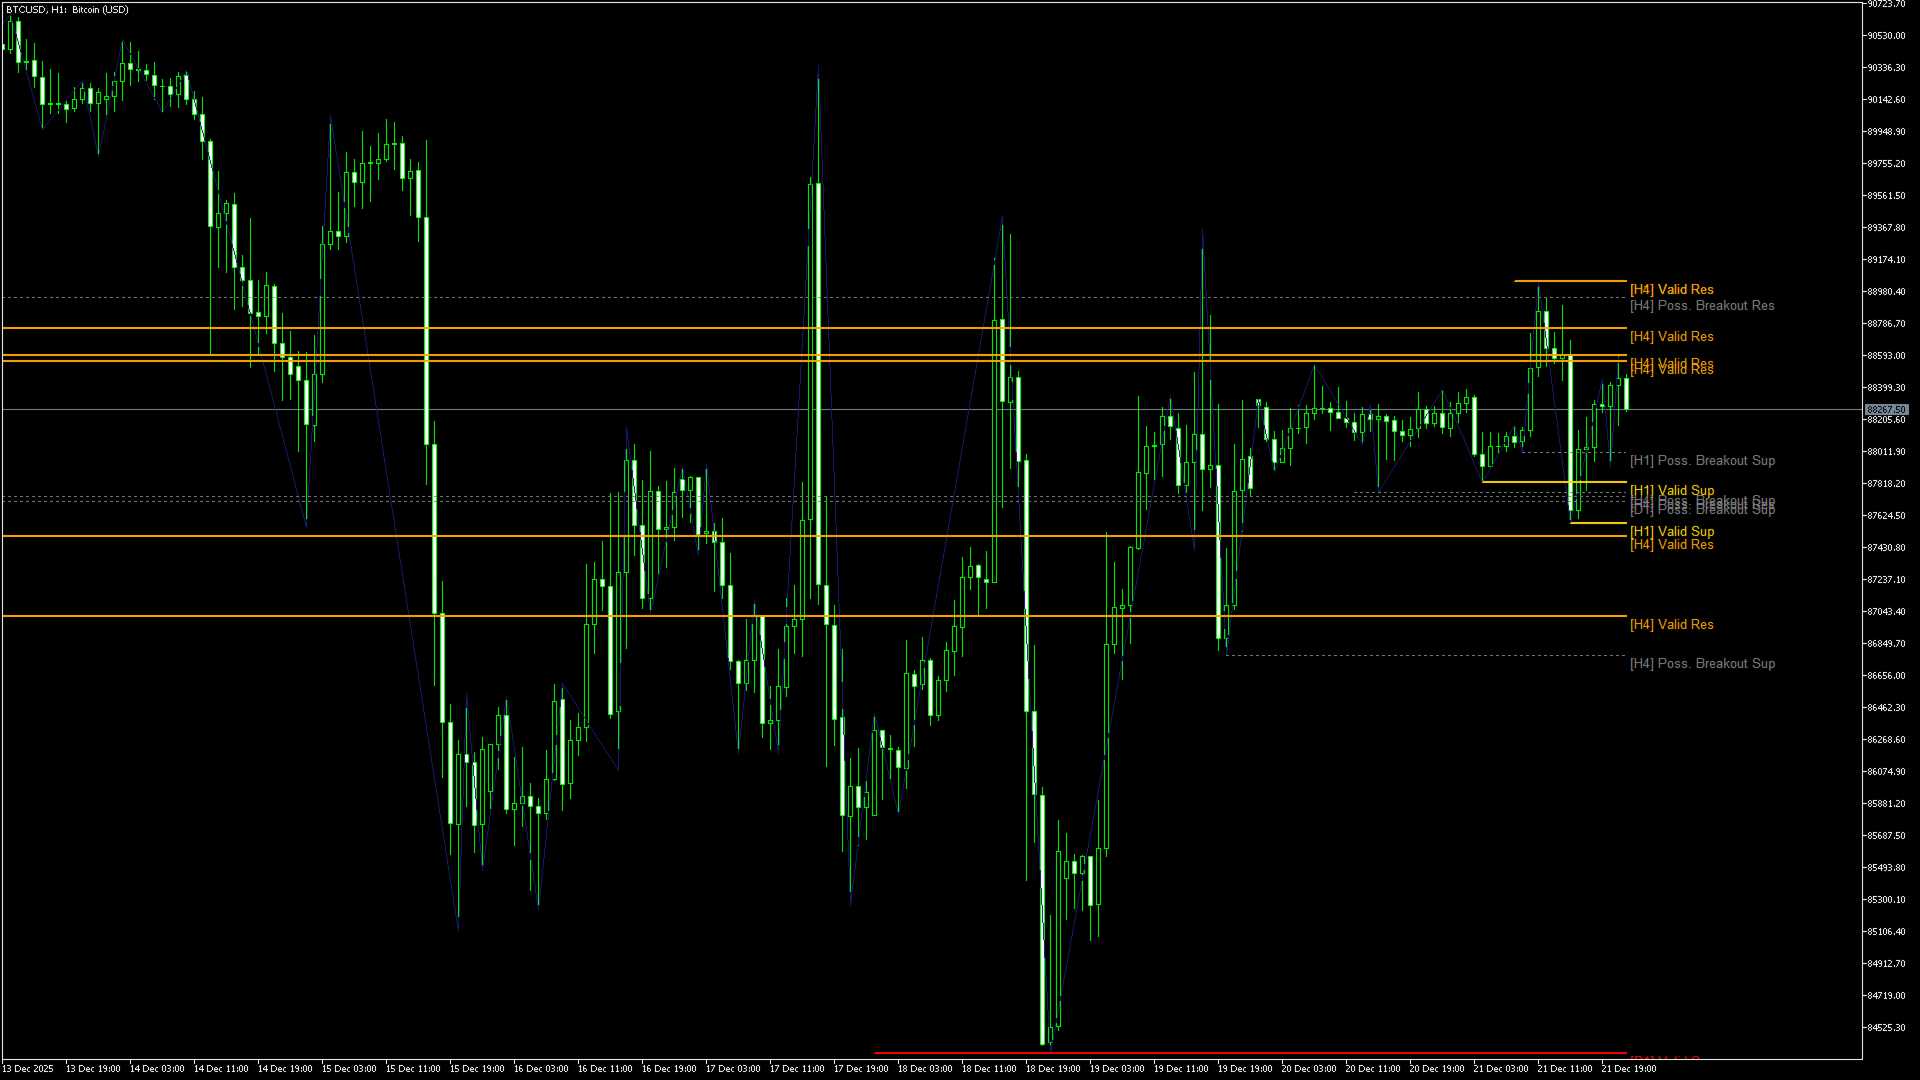
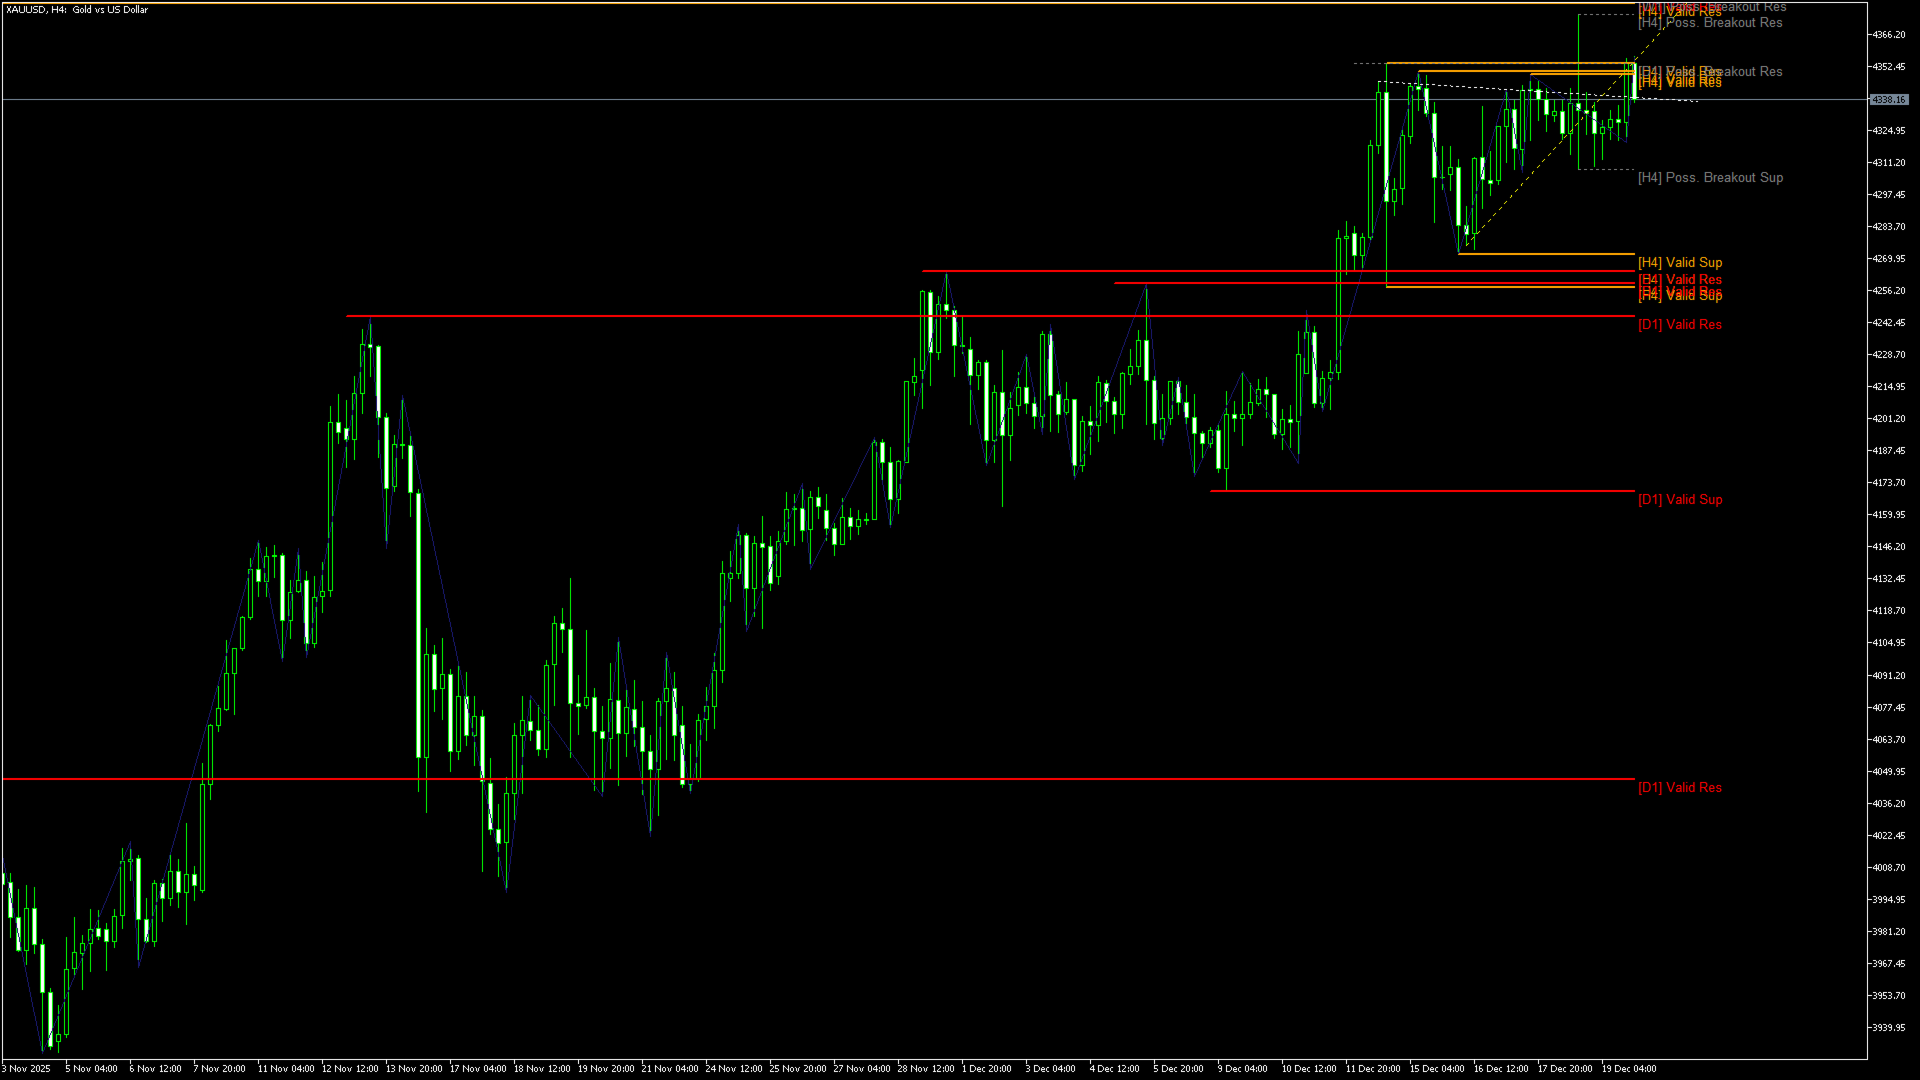
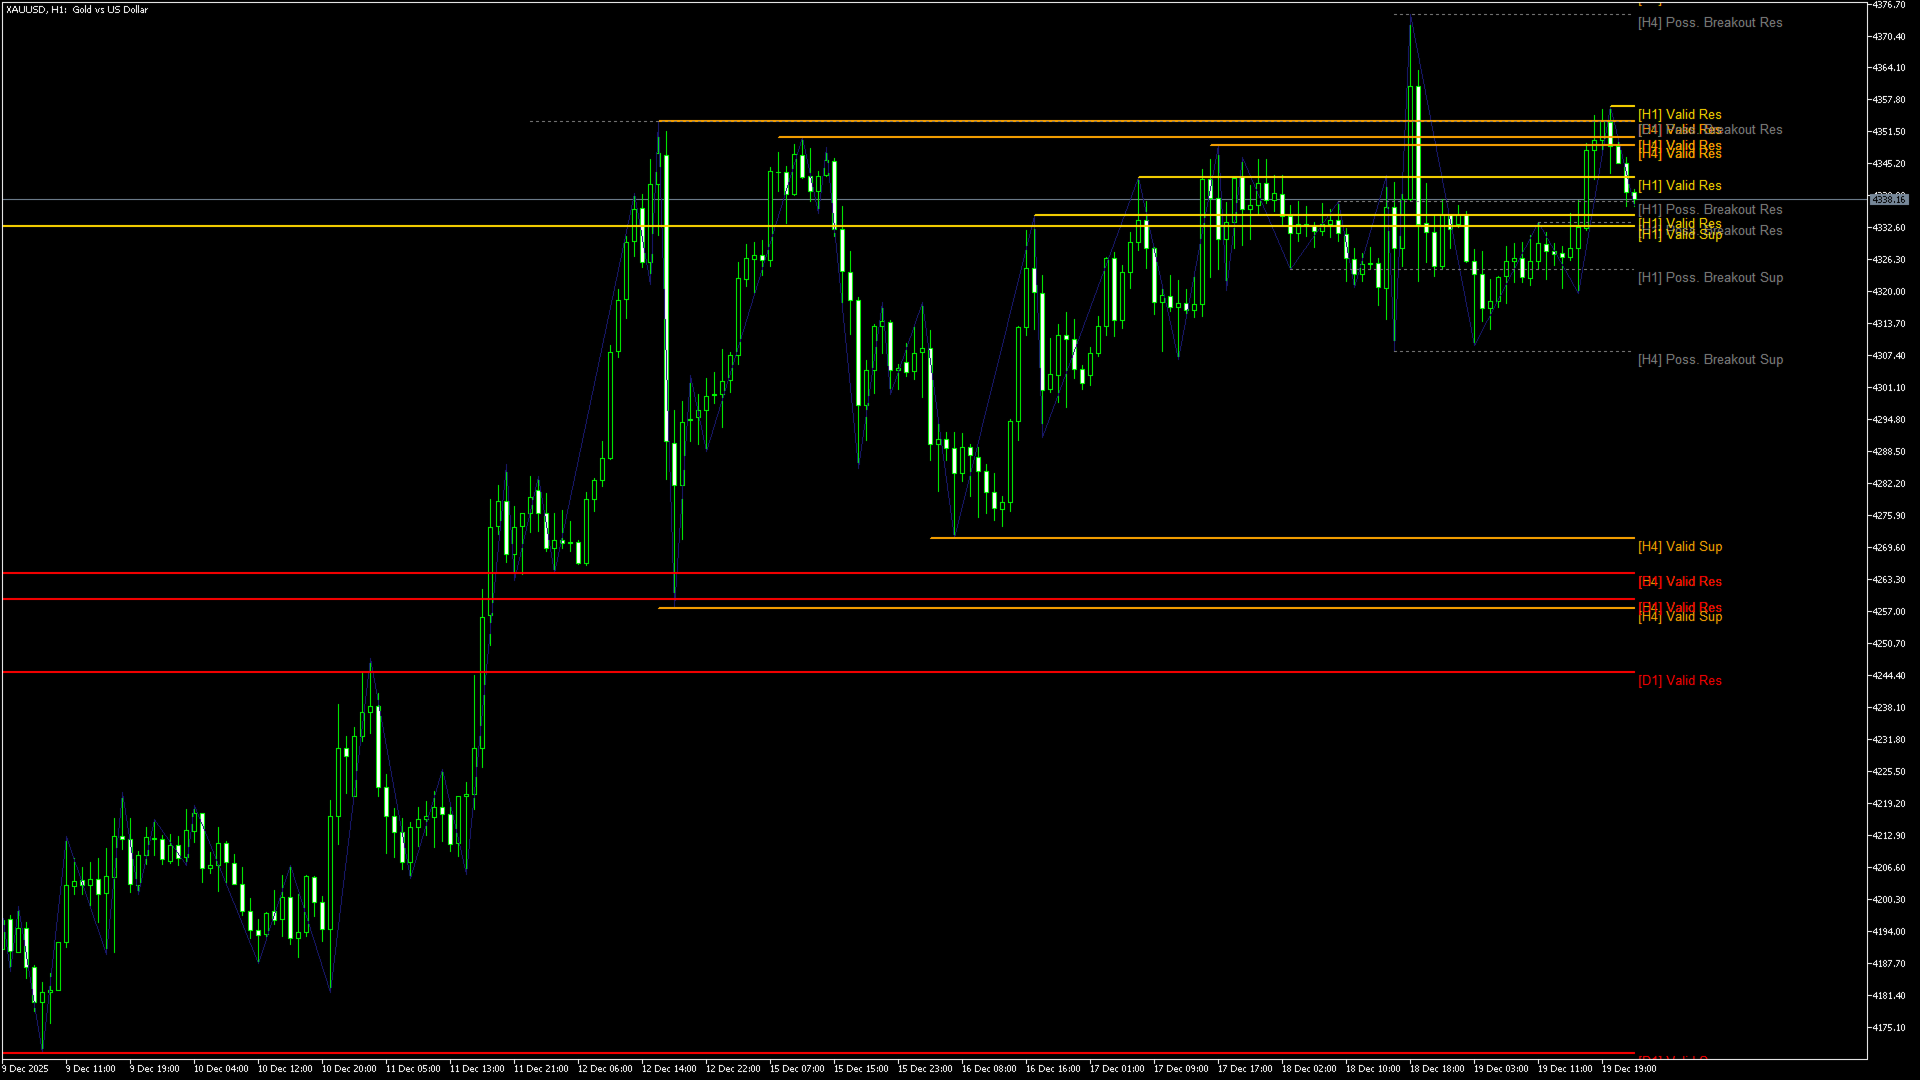
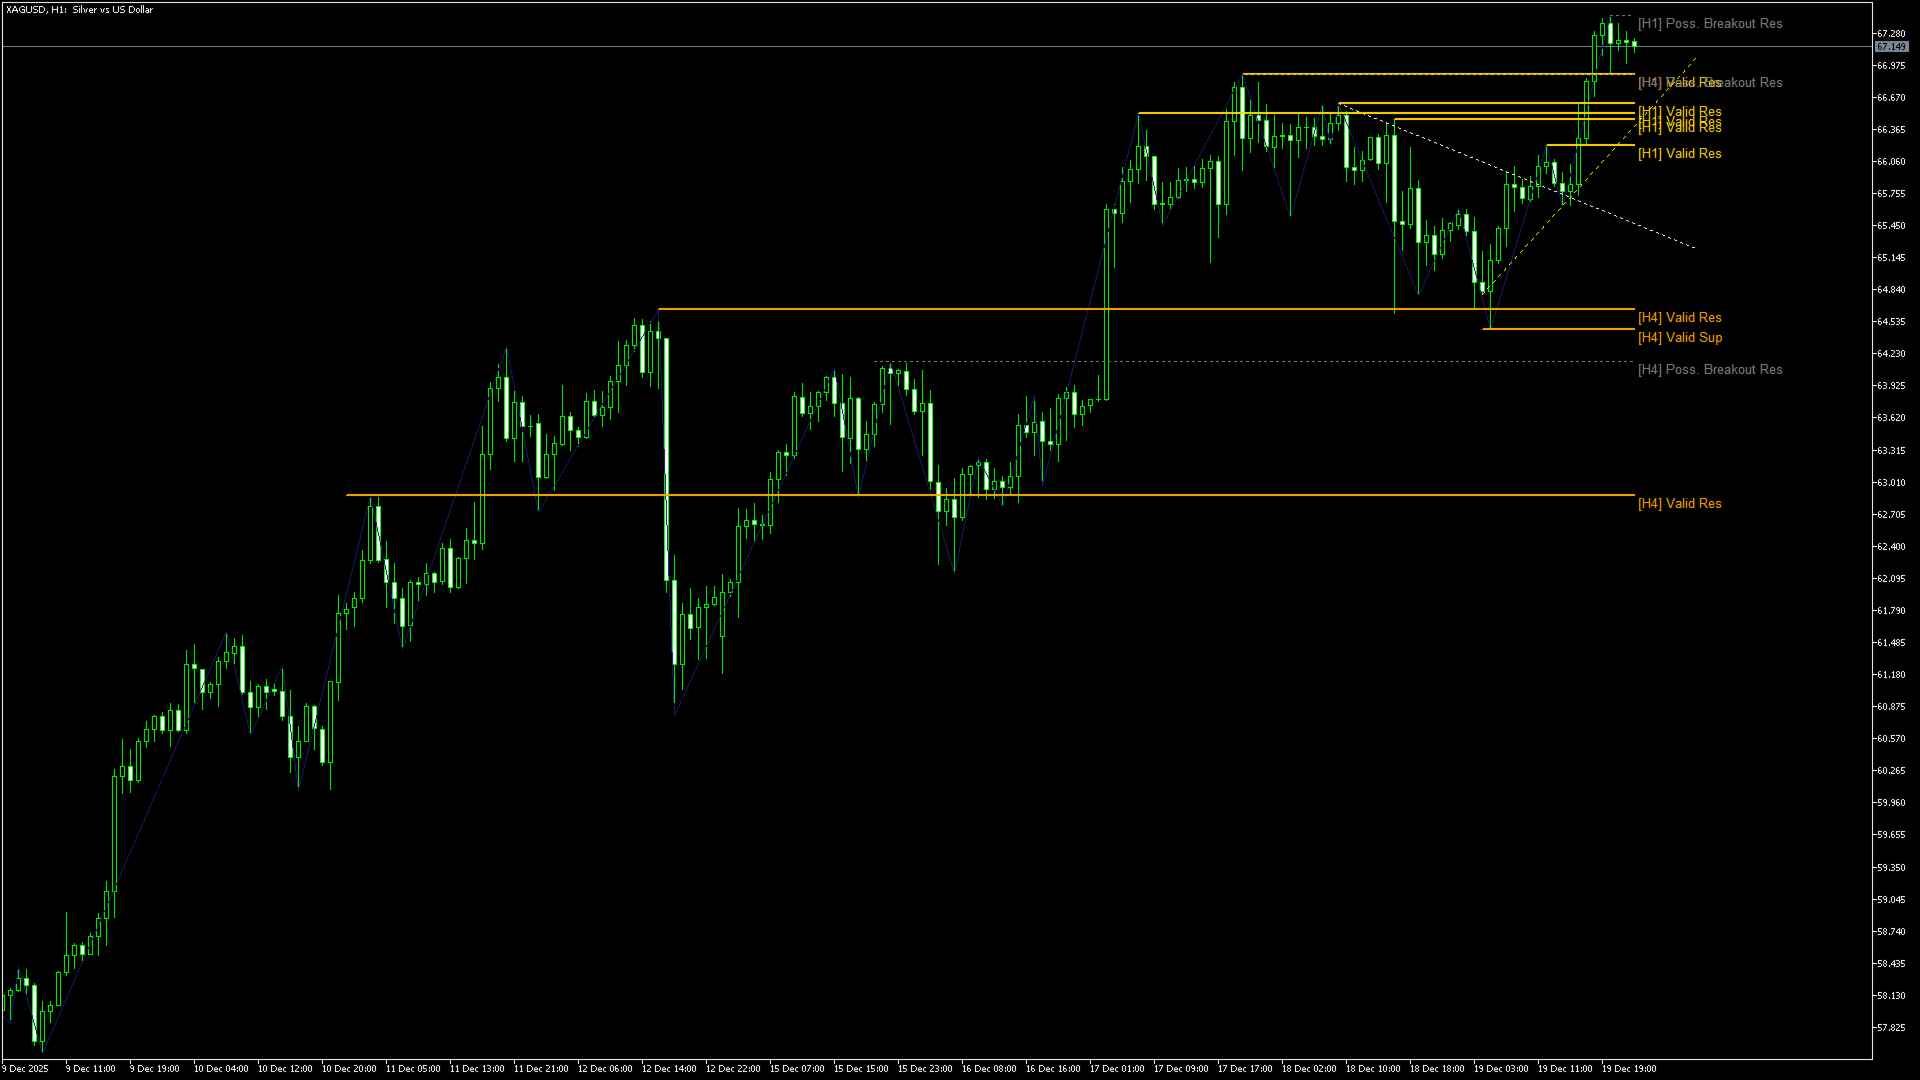
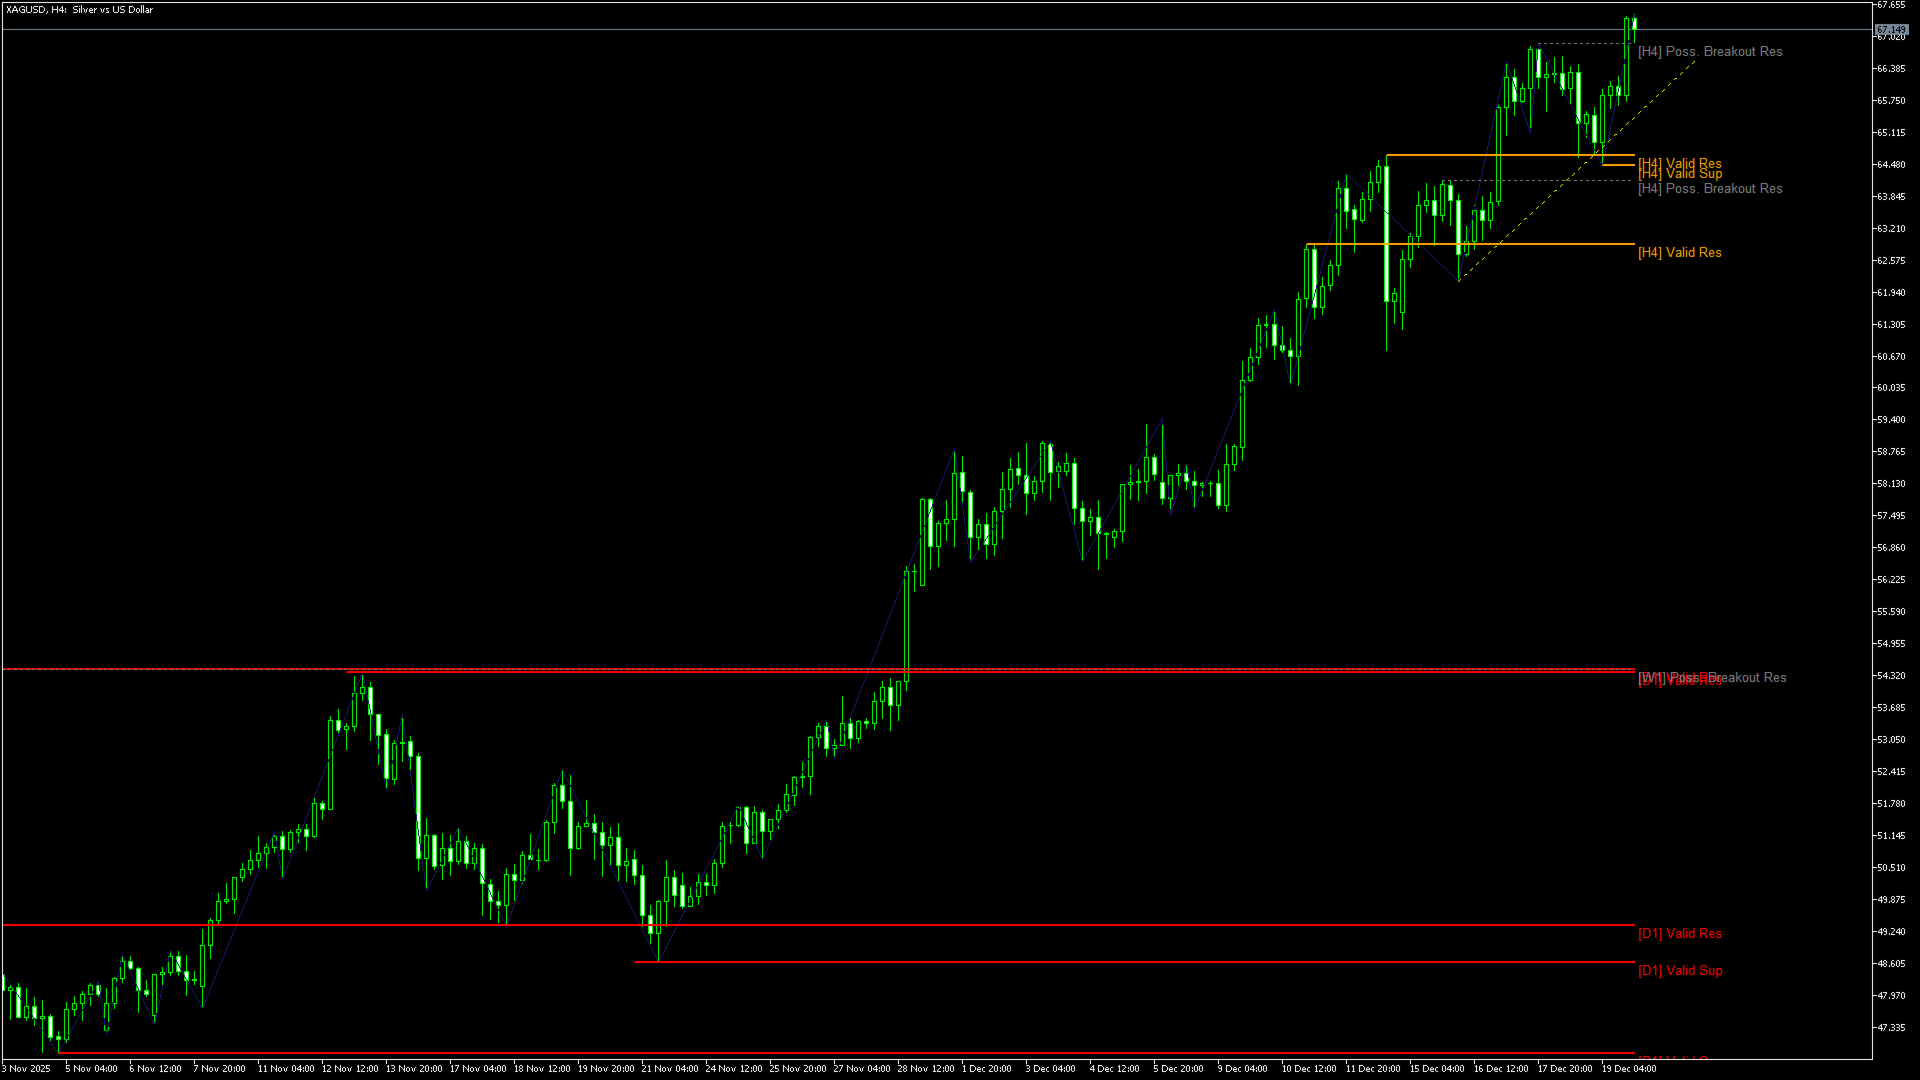
Investment Castle Horizontals — Key Levels, Mapped Clearly
The Horizontals Indicator gives you a clean, comprehensive map of the horizontal levels that matter — the prices where the market repeatedly reacts — so you can plan entries, exits and targets around real structure instead of guesswork.
What it does for you
- Key horizontal levels: the important support and resistance prices, drawn for you.
- Comprehensive yet clean: a clear map of structure without chart clutter.
- Plan with structure: set entries, exits and targets around the levels that count.
- Works everywhere: any symbol, any timeframe.
Who it is for: traders who build their plan around horizontal support and resistance.
Risk warning: trading involves substantial risk of loss. Always test on a demo account first and use risk settings you are comfortable with. Past performance does not guarantee future results.