Volume NextGen

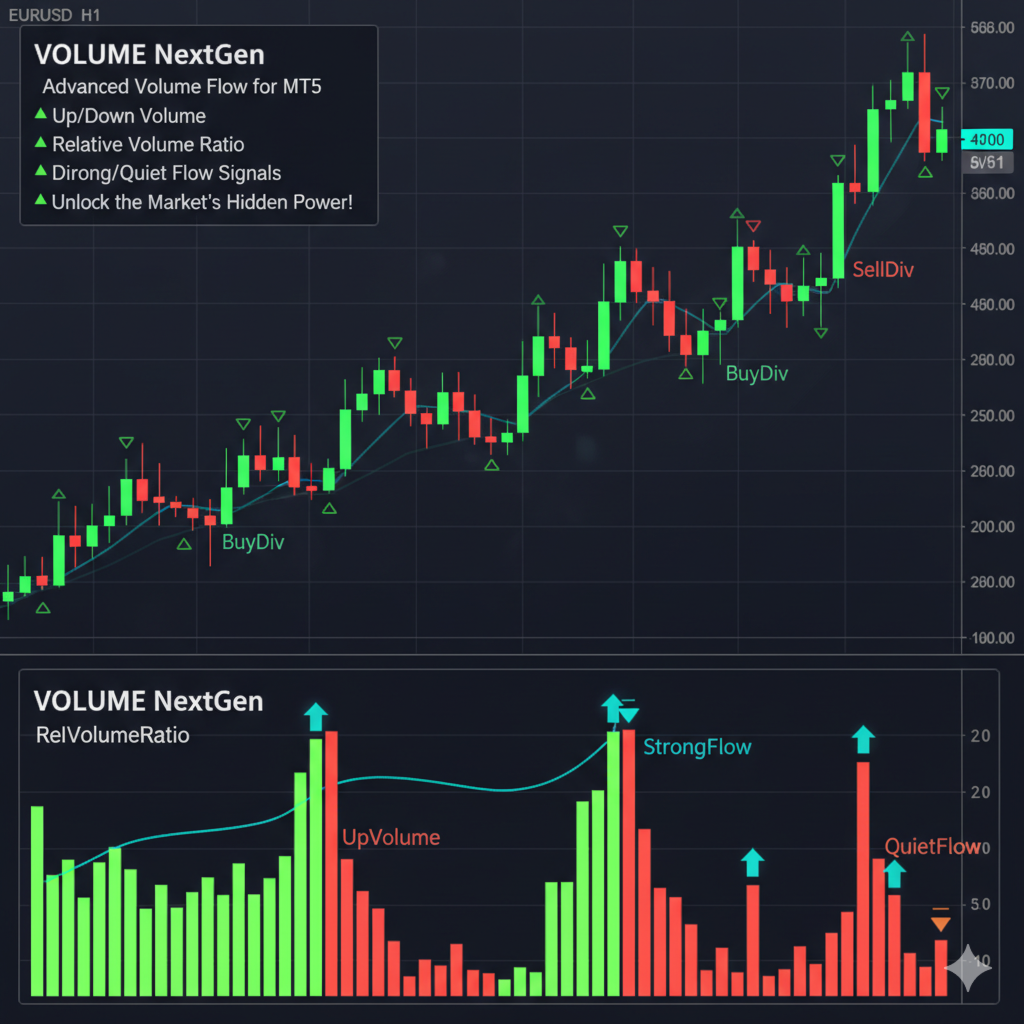
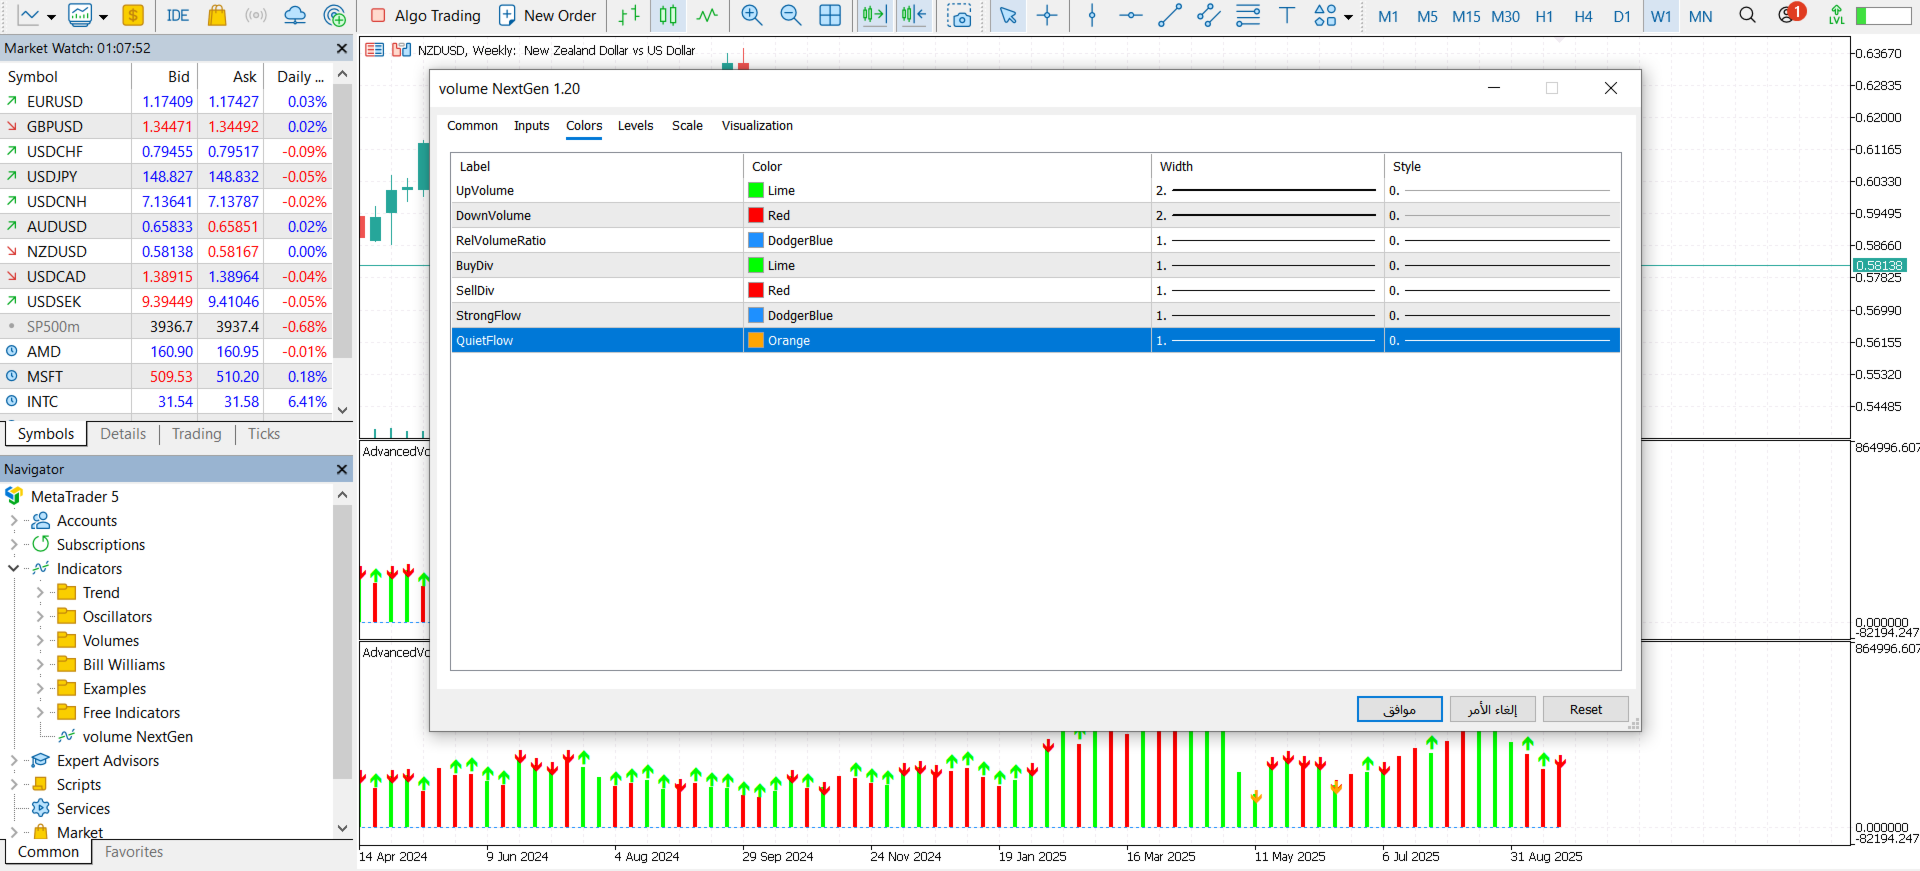
The Advanced Volume Flow Indicator is a free and practical tool  who want to clearly see the balance between buying and selling pressure in the market. Instead of just showing total volume, this indicator separates volume into Up Volume (green bars) and Down Volume (red bars), making it easy to understand which side of the market is stronger at any moment.

The indicator also calculates a Relative Volume Line (blue), which shows whether the current trading activity is higher or lower than usual. When this line rises above its normal level, it signals that the market is active and strong. When it falls below, it shows the market is quiet or losing energy.

To make it even easier for traders, the indicator adds special arrows that highlight important signals:

Green arrows for possible bullish reversals (volume supports buyers).

Red arrows for possible bearish reversals (volume supports sellers).

Blue arrows for strong volume conditions (high conviction in the move).

Orange arrows for quiet volume conditions (low conviction, possible breakout ahead).

 How to Read It

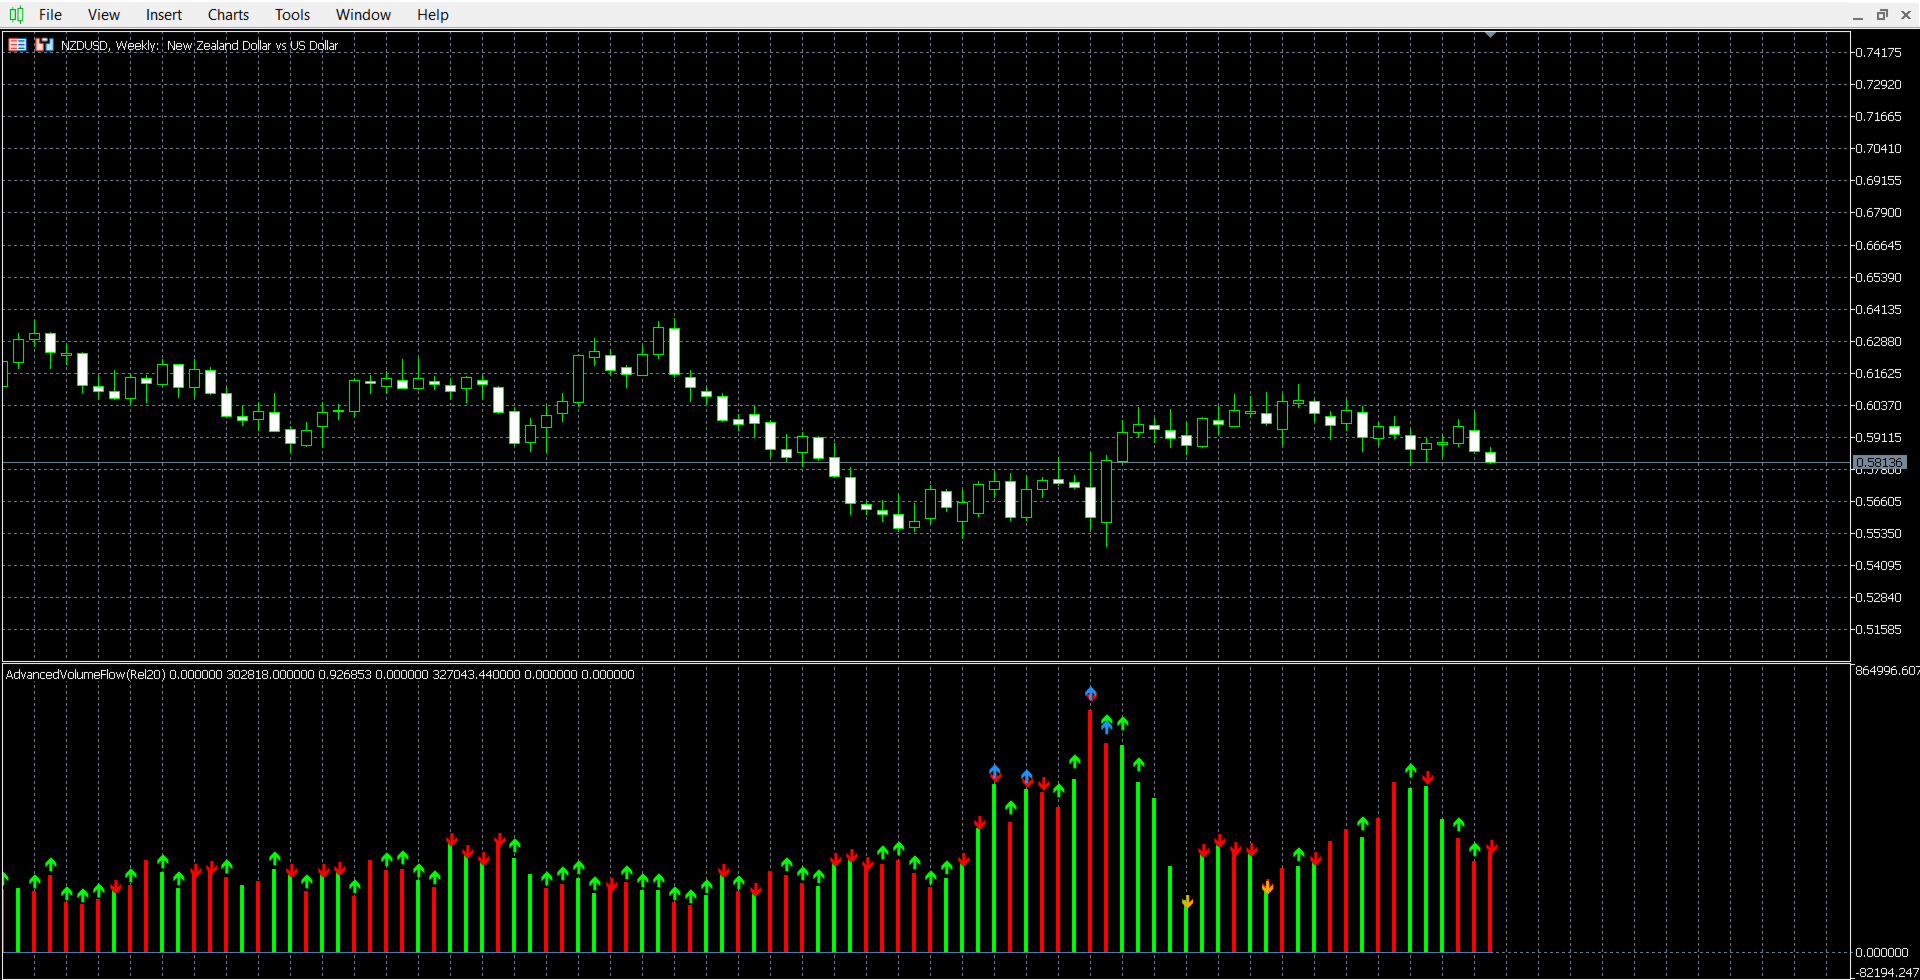
Look at the green and red bars in the separate window:

Green = buyers are stronger.

Red = sellers are stronger.

Watch the blue line (Relative Volume):

Above 1.0 → higher activity than normal.

Below 1.0 → weaker activity than normal.

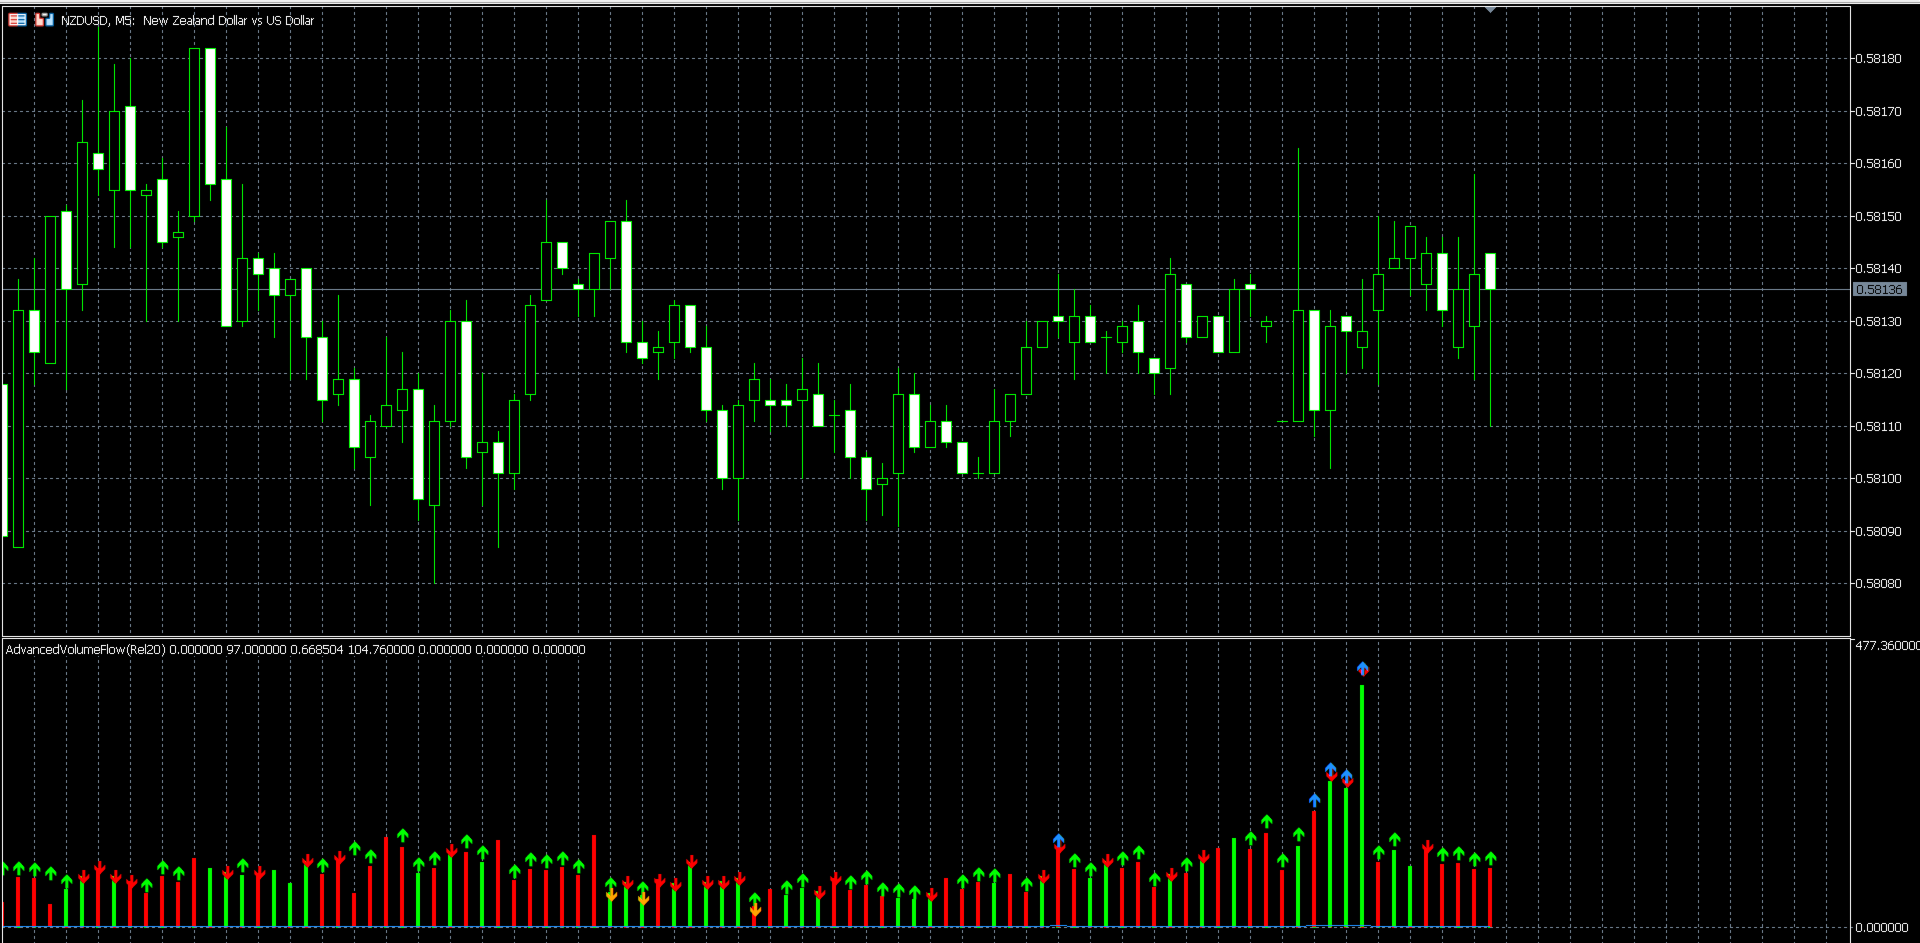
Pay attention to the colored arrows:

Green arrow = bullish signal.

Red arrow = bearish signal.

Blue arrow = strong participation, trend may continue.

Orange arrow = quiet market, prepare for possible move.

That’s all you need! In just a few seconds, you can tell whether a price move is strong and supported by real volume or weak and likely to fail.

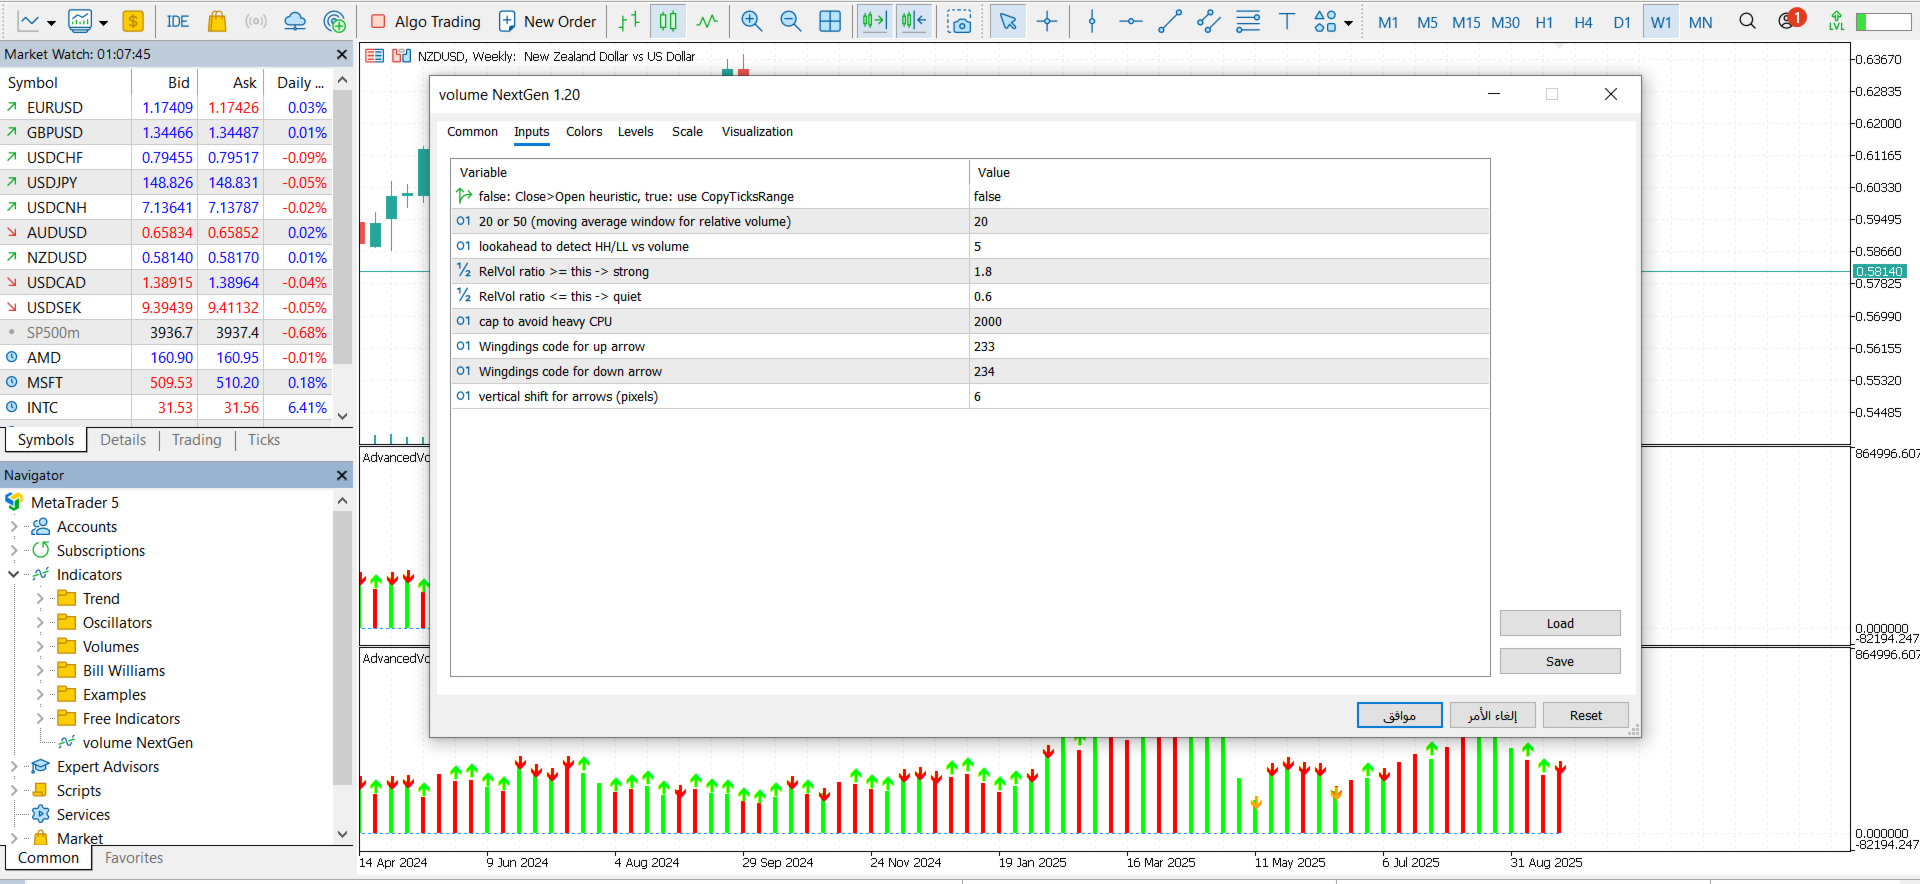
How It Works (Simplified)

The indicator checks the tick volume of each bar.

It splits that volume into “Up” (buying) and “Down” (selling).

Then it compares the current bar’s activity with the average of past bars.

If the activity is much stronger or weaker than normal, the indicator marks it with arrows and signals.

Everything is automatic — no need for complicated settings. Just attach it to your chart and trade with clearer vision.

Key Features

Clear Volume Split – See buyers vs. sellers in real-time with green and red bars.

Relative Volume Line – Quickly check if the market is active or quiet.

Automatic Divergence Alerts – Detect early reversals when price and volume disagree.

Strong & Quiet Flow Signals – Get simple arrows that show conviction or weakness.

Free & Lightweight – 100% free, fast .

Many traders struggle to understand whether price moves are real or fake. The Advanced Volume Flow Indicator makes this simple. With clear bars, an easy-to-read line, and automatic arrows, you’ll instantly know when the market has strong conviction or when it’s weak and risky.

Whether you trade trends, reversals, or breakouts, this tool gives you the confidence to act at the right time. And best of all, it’s completely free.
Prodotti consigliati
The indicator highlights the points that a professional trader sees in ordinary indicators. VisualVol visually displays different volatility indicators on a single scale and a common align. Highlights the excess of volume indicators in color. At the same time, Tick and Real Volume, Actual range, ATR, candle size and return (open-close difference) can be displayed. Thanks to VisualVol, you will see the market periods and the right time for different trading operations. This version is intended f
FREE
VFI Quantum
Nikita Berdnikov
5 (1)
Introducing VFI (Volume Flow Indicator) – a trading indicator that analyzes the relationship between volume and price movement to identify key trading opportunities. The indicator displays the strength and direction of volume flow, providing clear signals about potential entry and exit points. Signals are formed based on zero line crossovers, crossovers between the VFI line and its exponential moving average (EMA), and when the indicator exits overbought and oversold zones. Attention! This stra
FREE
Fair Value Gap Zone
Mattia Impicciatore
Descrizione Generale Il Fair Gap Value Indicator individua e mette in evidenza i “fair value gap” sul grafico di MetaTrader 5. Un fair gap si crea quando tra il minimo di una barra e il massimo di un’altra, separate da una barra intermedia, si forma un vuoto di prezzo. L’indicatore disegna rettangoli colorati (rialzisti e ribassisti) per evidenziare queste aree, offrendo un valido supporto visivo nelle strategie di price action. Principali Caratteristiche Rilevamento gap rialzisti : evidenzia ga
FREE
Follow The Line MT5
Oliver Gideon Amofa Appiah
4.6 (35)
This indicator obeys the popular maxim that: "THE TREND IS YOUR FRIEND" It paints a GREEN line for BUY and also paints a RED line for SELL. (you can change the colors). It gives alarms and alerts of all kinds. IT DOES NOT REPAINT and can be used for all currency pairs and timeframes. Yes, as easy and simple as that. Even a newbie can use it to make great and reliable trades. NB: For best results, get my other premium indicators for more powerful and reliable signals. Get them here: https://www.m
FREE
(Special New Year promotion - free price!) The indicator displays the actual 'Scale in points per bar' (identical to the manual setting in the Terminal, see screenshot) in the upper right corner of the chart. The displayed value changes INSTANTLY whenever the chart scale is changed! (This is very convenient when planning screenshots). In Settings: Change language (Russian/English), font size of the displayed text, text label offset coefficient from the graph corner, equally in X and Y directi
FREE
LT Donchian Channel
Thiago Duarte
4.83 (6)
Donchian Channel is an indicator created by Richard Donchian. It is formed by taking the highest high and the lowest low of the last specified period in candles. The area between high and low is the channel for the chosen period. Its configuration is simple. It is possible to have the average between the upper and lower lines, plus you have alerts when price hits one side. If you have any questions or find any bugs, please contact me. Enjoy!
FREE
Basic Vwap
james mugendi
4 (1)
Simple Vwap with the daily, weekly and monthly VWAP is the abbreviation for   volume-weighted average price , which is a technical analysis tool that shows the ratio of an asset's price to its total trade volume. It provides traders and investors with a measure of the average price at which a stock is traded over a given period of time. How it's used Identify entry and exit points:   Traders can use VWAP to determine when to buy or sell an asset.   Understand price trends :  Traders can use V
FREE
Descrizione generale Questo indicatore è una versione avanzata del classico Donchian Channel , arricchita con funzioni operative per il trading reale. Oltre alle tre linee tipiche (massimo, minimo e linea centrale), il sistema rileva i breakout e li segnala graficamente con frecce sul grafico, mostrando solo la linea opposta alla direzione del trend per semplificare la lettura. L’indicatore include: Segnali visivi : frecce colorate al breakout Notifiche automatiche : popup, push e email Filtro R
FREE
Value Chart Candlesticks
Flavio Javier Jarabeck
4.69 (13)
The idea of a Value Chart indicator was presented in the very good book I read back in 2020 , " Dynamic Trading Indicators: Winning with Value Charts and Price Action Profile ", from the authors Mark Helweg and David Stendahl. The idea is simple and the result is pure genius: Present candlestick Price analysis in a detrended way! HOW TO READ THIS INDICATOR Look for Overbought and Oversold levels. Of course, you will need to test the settings a lot to find the "correct" one for your approach. It
FREE
Weis Waves
Flavio Javier Jarabeck
2.83 (18)
The original author is David Weis, an expert in the Wyckoff Method. The Weis Wave is a modern adaptation of the 1930's Wyckoff Method, another expert in Tape Reading techniques and Chart Analysis. Weis Waves takes market volume and stacks it into waves according to price conditions giving the trader valuable insights about the market conditions. If you want to learn more about this subject you can find tons of videos in YouTube. Just look for "The Wickoff Method", "Weis Wave" and "Volume Spread
FREE
Friend of the Trend: Your Trend Tracker Master the market with Friend of the Trend , the indicator that simplifies trend analysis and helps you identify the best moments to buy, sell, or wait. With an intuitive and visually striking design, Friend of the Trend analyzes price movements and delivers signals through a colorful histogram: Green Bars : Signal an uptrend, indicating buying opportunities. Red Bars : Alert to a downtrend, suggesting potential selling points. Orange Bars : Represent cons
FREE
Anchored VWAP plus
Jesper Christensen
Elevate Your Trading with Advanced Anchored Volume Weighted Average Price Technology Unlock the true power of price action with our premium Anchored VWAP Indicator for MetaTrader 5 - the essential tool for precision entries, strategic exits, and high-probability trend continuation setups. Write me a DM for a 7 day free trial.  Anchored VWAP Plus gives traders unprecedented control by allowing custom anchor points for Volume Weighted Average Price calculations on any chart. With support for 4 sim
FREE
Aggression Volume
Flavio Javier Jarabeck
4.29 (17)
Aggression Volume Indicator is the kind of indicator that is rarely found in the MQL5 community because it is not based on the standard Volume data provided by the Metatrader 5 platform. It requires the scrutiny of all traffic Ticks requested on the platform... That said, Aggression Volume indicator requests all Tick Data from your Broker and processes it to build a very special version of a Volume Indicator, where Buyers and Sellers aggressions are plotted in a form of Histogram. Additionally,
FREE
MIDAS Super VWAP
Flavio Javier Jarabeck
4.4 (10)
Imagine VWAP, MVWAP and MIDAS in one place... Well, you found it! Now you can track the movement of Big Players in various ways, as they in general pursue the benchmarks related to this measuring, gauging if they had good execution or poor execution on their orders. Traders and analysts use the VWAP to eliminate the noise that occurs throughout the day, so they can measure what prices buyers and sellers are really trading. VWAP gives traders insight into how a stock trades for that day and deter
FREE
Are you tired of drawing trendlines every time you're analyzing charts? Or perhaps you would like more consistency in your technical analysis. Then this is for you. This indicator will draw trend lines automatically when dropped on a chart. How it works Works similar to standard deviation channel found on mt4 and mt5. It has 2 parameters: 1. Starting Bar 2. Number of bars for calculation The   starting bar   is the bar which drawing of the trend lines will begin, while the   number of bars for c
FREE
Daily High Low Danilo Monteiro
Danilo Hudson Couto Monteiro
# Indicador Daily High - Danilo Monteiro - MT5 ## Descrição O Daily High/Low Labels é um indicador personalizado para MetaTrader 5 que exibe automaticamente as máximas e mínimas diárias no gráfico, facilitando a identificação rápida dos níveis importantes de preço. O indicador marca os preços com etiquetas e linhas horizontais, permitindo uma visualização clara dos níveis críticos do dia atual e anterior. ## Principais Características ### 1. Marcação Automática - Exibe automaticamente as máxi
FREE
Rainbow MT5
Jamal El Alama
4 (1)
Description : Rainbow MT5 is a technical indicator based on Moving Average with period 34 and very easy to use. When price crosses above MA and MA changes color to green, then this is a signal to buy. When price crosses below MA and MA changes color to red, then this is a signal to sell. The Expert advisor ( Rainbow EA MT5 ) based on Rainbow MT5 indicator is now available here . MT4 version is available here .
FREE
Simple Weis Wave
Jean Jacques Huve Ribeiro
3.67 (3)
One of the best tools for analyzing volume, Weis Wave was idelized by David Weis, to facilitate the reading of directional flow. For the VSA method disciples it is an evolution of the practices created by Richard Wycoff, facilitating a predictive reading of the market, always seeking an accumulation and distribution of the negotiated contracts. Cumulative wave volume  Range of wave ( removed) Average Wave volume Ref "Tim Ord lectures" ( removed)
FREE
This indicator sums up the difference between the sells aggression and the buys aggression that occurred in each Candle, graphically plotting the waves of accumulation of the aggression volumes.   Through these waves an exponential average is calculated that indicates the direction of the business flow. Note: This indicator DOES NOT WORK for Brokers and/or Markets WITHOUT the type of aggression (BUY or SELL).   Be sure to try our Professional version with configurable features and alerts:  Agre
FREE
Easy Correlations Indicator The Easy Correlations Indicator is designed to help traders analyze the relationship between two correlated instruments. By monitoring the distance between their Relative Strength Index (RSI) values, the indicator highlights situations where one instrument has moved significantly further than the other. This creates potential trading opportunities: Sell the stronger instrument (overstretched RSI) Buy the weaker instrument (lagging RSI) Because the positions are opened
FREE
VolumeBasedColorsBars
Henrique Magalhaes Lopes
VolumeBasedColorsBars — Free Powerful Volume Analysis for All Traders Unlock the hidden story behind every price bar! VolumeBasedColorsBars is a professional-grade, 100% FREE indicator that colorizes your chart candles based on real, adaptive volume analysis. Instantly spot surges in market activity, identify exhaustion, and catch the moves that matter. This indicator gives you:    • Dynamic color-coded bars for instant volume context    • Adaptive thresholds based on historical, session-awar
FREE
Ratio Indicator
Rafael Gazzinelli
5 (2)
Ratio Indicator - User Guide Special Deal! Leave a review and get the indicator  Long & Short Cointegration Analyzer for free — just send me a message! This Ratio indicator between assets allows you to monitor and trade the price relationship between two assets selected by the user. It calculates the ratio between the prices of two assets, referred to as Asset1 and Asset2 (e.g., "GBPUSD" and "EURUSD"), and plots a moving average of the ratio along with Bollinger Bands . These bands are used to
FREE
Tabajara V5
Flavio Javier Jarabeck
4.83 (35)
Metatrader 5 version of the famous Andre Machado's Tabajara indicator. If you don't know Andre Machado's Technical Analysis work you don't need this indicator... For those who need it and for those several friend traders who asked this porting from other platforms, here it is... FEATURES 8-period Moving Average 20-period Moving Average 50-period Moving Average 200-period Moving Average Colored candles according to the inflexion of the 20-period MA SETTINGS You can change the Period of all MA's
FREE
MACD Mago Trader
Flavio Javier Jarabeck
4.5 (4)
For those traders and students who follow the famous brazilian trader Igor Rodrigues (Mago Trader) here it is another tool he uses: a 2-line MACD specially set with Phi ratios. This MACD is packed with a twist: a Filling Area , to easily and visually spot the corresponding trend on the chart. Obviously, you can turn On and Off this filling feature. If you don't know Igor Rodrigues and you are a brazilian trader and student, just google for him... Very simple and useful indicator. If you are loo
FREE
MACD Enhanced
Nikita Berdnikov
5 (3)
Introducing the MACD  Enhanced – an advanced MACD (Moving Average Convergence Divergence) indicator that provides traders with extended capabilities for trend and momentum analysis in financial markets. The indicator uses the difference between the fast and slow exponential moving averages to determine momentum, direction, and strength of the trend, creating clear visual signals for potential entry and exit points. Attention! To achieve the best results, it is recommended to adapt the indicator
FREE
Donchian Pro
Paulo Henrique Faquineli Garcia
5 (3)
The Donchian Channel Channels are among the most popular tools of technical analysis, as they visually convey to the analyst the limits within which most price movement tends to occur. Channel users know that valuable information can be obtained at any time, whether prices are in the central region of a band or close to one of the border lines. One of the best known techniques to explore these concepts is Bollinger Bands. However, John Bollinger was not the only one to research the application
FREE
ATR Plus is an enhanced version of the classic ATR that shows not just volatility itself, but the directional energy of the market . The indicator converts ATR into a normalized oscillator (0–100), allowing you to clearly see: who dominates the market — buyers or sellers when a trend begins when a trend loses strength when the market shifts into a range where volatility reaches exhaustion zones ATR Plus is perfect for momentum, trend-following, breakout and volatility-based systems. How ATR Plus
FREE
Dual RSI
Paul Conrad Carlson
3 (1)
Indicator alerts for Dual Relative strength index rsi. Large rsi preset at 14 is below 30 small rsi preset at 4 is below 10 for buy bullish signals . Large rsi preset are 14 is above 70 small rsi preset at 4 is above 90 for sell bearish signals . Includes mobile and terminal alerts. draws lines when alerts. This indicator can help identify extremes and then the tops or bottoms of those extremes .
FREE
Supports And Resistances Lines
Francisco Gomes Da Silva
4.66 (44)
Indicatore zone di supporto e resistenza MT5 questo indicatore sa come identificare automaticamente massimi e minimi. Questo indicatore di supporto e resistenza crea linee di supporto e linee di resistenza basate su massimi e minimi. come creare linee di supporto e resistenza. questo è un indicatore per creare linee automatiche di supporto e resistenza. come trovare il livello di supporto con l'indicatore. questo indicatore trova i massimi e i minimi automaticamente. L'indicatore crea automatica
FREE
Volume-to-Price Movement Oscillator (VP Oscillator) for MT5 The VP Oscillator highlights the balance (or imbalance) between trading volume and price movement, helping traders spot hidden accumulation, distribution, or weakening trends. How It Works: Calculates each bar’s price range (High–Low) and tick volume. Normalizes both values over a set period (default: 14). Plots the absolute difference between them ×100 — showing how closely price action aligns with trading activity. Interpretation: Hig
FREE
Gli utenti di questo prodotto hanno anche acquistato
ARIPoint
Temirlan Kdyrkhan
1 (1)
ARIPoint is a powerful trading companion designed to generate high-probability entry signals with dynamic TP/SL/DP levels based on volatility. Built-in performance tracking shows win/loss stats, PP1/PP2 hits, and success rates all updated live. Key Features: Buy/Sell signals with adaptive volatility bands Real-time TP/SL/DP levels based on ATR Built-in MA Filter with optional ATR/StdDev volatility Performance stats panel (Success, Profit/Loss, PP1/PP2) Alerts via popup, sound, push, or email Cu
Se acquisti questo indicatore, riceverai il mio Trade Manager Professionale + EA  GRATUITAMENTE. Innanzitutto è importante sottolineare che questo sistema di trading è un indicatore Non-Repainting, Non-Redrawing e Non-Lagging, il che lo rende ideale sia per il trading manuale che per quello automatico. Corso online, manuale e download di preset. Il "Sistema di Trading Smart Trend MT5" è una soluzione completa pensata sia per i trader principianti che per quelli esperti. Combina oltre 10 indicat
Divergence Bomber
Ihor Otkydach
4.9 (81)
Ogni acquirente dell’indicatore riceverà inoltre gratuitamente: L’utilità esclusiva “Bomber Utility”, che gestisce automaticamente ogni operazione, imposta i livelli di Stop Loss e Take Profit e chiude le posizioni secondo le regole della strategia I file di configurazione (set file) per adattare l’indicatore a diversi asset I set file per configurare il Bomber Utility in tre modalità: “Rischio Minimo”, “Rischio Bilanciato” e “Strategia di Attesa” Una guida video passo-passo per installare, conf
Power Candles MT5
Daniel Stein
5 (5)
Power Candles – Segnali di ingresso basati sulla forza per tutti i mercati Power Candles porta l’analisi di forza collaudata di Stein Investments direttamente sul grafico dei prezzi. Invece di reagire solo al prezzo, ogni candela viene colorata in base alla reale forza di mercato, consentendo di identificare immediatamente accumuli di momentum, accelerazioni della forza e transizioni di trend pulite. Un’unica logica per tutti i mercati Power Candles funziona automaticamente su tutti i simboli di
Entry In The Zone and SMC Multi Timeframe è uno strumento di analisi di mercato in tempo reale sviluppato sulla base degli Smart Money Concepts (SMC). È progettato per aiutare i trader ad analizzare la struttura del mercato in modo sistematico e ottenere una visione più chiara della direzione generale del mercato. Il sistema analizza automaticamente i Punti di Inversione, le Zone Chiave e la Market Structure su più timeframe, mostrando Point of Interest (POI), segnali No Repaint e Auto Fibonacci
SuperScalp Pro
Van Minh Nguyen
5 (1)
SuperScalp Pro – Sistema avanzato di indicatore per scalping con filtri multipli SuperScalp Pro è un sistema avanzato di indicatore per scalping che combina il classico Supertrend con molteplici filtri di conferma intelligenti. L’indicatore funziona in modo efficiente su tutti i timeframe da M1 a H4 ed è particolarmente adatto per XAUUSD, BTCUSD e le principali coppie Forex. Può essere utilizzato come sistema stand-alone o integrato in modo flessibile nelle strategie di trading esistenti. L’indi
Azimuth Pro
Ottaviano De Cicco
5 (1)
LAUNCH PROMO Azimuth Pro price is initially set at 299$ for the first 100 buyers. Final price will be 499$ . THE DIFFERENCE BETWEEN RETAIL AND INSTITUTIONAL ENTRIES ISN'T THE INDICATOR — IT'S THE LOCATION. Most traders enter at arbitrary price levels, chasing momentum or reacting to lagging signals. Institutions wait for price to reach structured levels where supply and demand actually shift. Azimuth Pro maps these levels automatically: swing-anchored VWAP, multi-timeframe structure lines, an
Ottieni l’indicatore AUX GRATUITO e il supporto EA Download diretto — Clicca qui [ D.I.C.E ] The DICE Indicator  Divergence in Chaos Environment è uno strumento MT5 specializzato per trader che applicano la Teoria delle Onde di Elliott nel contesto delle tecniche di Trading Chaos. Identifica divergenze nascoste e regolari nell’azione dei prezzi, sincronizzate con l’ambiente di mercato caotico descritto da Bill Williams. Caratteristiche principali Divergenza allineata alle Onde di Elliott: rilev
Game Changer è un indicatore di tendenza rivoluzionario, progettato per essere utilizzato su qualsiasi strumento finanziario, per trasformare il tuo Metatrader in un potente analizzatore di trend. L'indicatore non ridisegna e non subisce ritardi. Funziona su qualsiasi intervallo temporale e aiuta a identificare i trend, segnala potenziali inversioni, funge da meccanismo di trailing stop e fornisce avvisi in tempo reale per risposte tempestive del mercato. Che tu sia un trader esperto, un profess
Trend Screener Pro MT5
STE S.S.COMPANY
4.84 (100)
Indicatore di tendenza, soluzione unica rivoluzionaria per il trading di tendenze e il filtraggio con tutte le importanti funzionalità di tendenza integrate in un unico strumento! È un indicatore multi-timeframe e multi-valuta al 100% non ridipingibile che può essere utilizzato su tutti i simboli/strumenti: forex, materie prime, criptovalute, indici e azioni. Trend Screener è un indicatore di tendenza che segue un indicatore efficiente che fornisce segnali di tendenza a freccia con punti nel gra
Smart Stop Indicator – Precisione intelligente dello stop-loss direttamente sul grafico Panoramica Smart Stop Indicator è la soluzione ideale per i trader che desiderano posizionare il loro stop-loss in modo chiaro e metodico, senza dover indovinare o affidarsi all’intuizione. Questo strumento combina la logica classica del price action (massimi e minimi strutturali) con un moderno riconoscimento dei breakout per identificare il prossimo livello di stop realmente logico. In trend, in range o i
Atomic Analyst MT5
Issam Kassas
4.07 (28)
Innanzitutto, vale la pena sottolineare che questo indicatore di trading non è repaint, non è ridisegno e non presenta ritardi, il che lo rende ideale sia per il trading manuale che per quello automatico. Manuale utente: impostazioni, input e strategia. L'Analista Atomico è un indicatore di azione del prezzo PA che utilizza la forza e il momentum del prezzo per trovare un miglior vantaggio sul mercato. Dotato di filtri avanzati che aiutano a rimuovere rumori e segnali falsi, e aumentare il pote
FX Power MT5 NG
Daniel Stein
5 (30)
FX Power: Analizza la Forza delle Valute per Decisioni di Trading Più Intelligenti Panoramica FX Power è lo strumento essenziale per comprendere la reale forza delle principali valute e dell'oro in qualsiasi condizione di mercato. Identificando le valute forti da comprare e quelle deboli da vendere, FX Power semplifica le decisioni di trading e rivela opportunità ad alta probabilità. Che tu segua le tendenze o anticipi inversioni utilizzando valori estremi di Delta, questo strumento si adatta
Top indicator for MT5   providing accurate signals to enter a trade without repainting! It can be applied to any financial assets:   forex, cryptocurrencies, metals, stocks, indices .  Watch  the video  (6:22) with an example of processing only one signal that paid off the indicator! MT4 version is here It will provide pretty accurate trading signals and tell you when it's best to open a trade and close it. Most traders improve their trading results during the first trading week with the help of
Super Signal – Skyblade Edition Sistema professionale di segnali di tendenza senza repaint / senza ritardo con tasso di vincita eccezionale | Per MT4 / MT5 Funziona meglio su timeframe più bassi, come 1 minuto, 5 minuti e 15 minuti. Caratteristiche principali: Super Signal – Skyblade Edition è un sistema intelligente di segnali progettato specificamente per il trading di tendenza. Utilizza una logica di filtraggio multilivello per identificare esclusivamente i movimenti direzionali forti, supp
L’indicatore evidenzia le zone in cui viene dichiarato interesse sul mercato , per poi mostrare la zona di accumulo degli ordini . Funziona come un book degli ordini su larga scala . Questo è l’indicatore per i grandi capitali . Le sue prestazioni sono eccezionali. Qualsiasi interesse ci sia nel mercato, lo vedrai chiaramente . (Questa è una versione completamente riscritta e automatizzata – non è più necessaria un’analisi manuale.) La velocità di transazione è un indicatore concettualmente nuo
FX Levels MT5
Daniel Stein
5 (12)
FX Levels: Supporti e Resistenze di Precisione Eccezionale per Tutti i Mercati Panoramica Rapida Cercate un modo affidabile per individuare livelli di supporto e resistenza in ogni mercato—coppie di valute, indici, azioni o materie prime? FX Levels fonde il metodo tradizionale “Lighthouse” con un approccio dinamico all’avanguardia, offrendo una precisione quasi universale. Basato sulla nostra esperienza reale con i broker e su aggiornamenti automatici giornalieri più quelli in tempo reale, FX
Innanzitutto, vale la pena sottolineare che questo Strumento di Trading è un Indicatore Non-Ridipingente, Non-Ridisegnante e Non-Laggante, il che lo rende ideale per il trading professionale. Corso online, manuale utente e demo. L'Indicatore Smart Price Action Concepts è uno strumento molto potente sia per i nuovi che per i trader esperti. Racchiude più di 20 utili indicatori in uno solo, combinando idee di trading avanzate come l'Analisi del Trader del Circolo Interno e le Strategie di Tradin
Grabber System MT5
Ihor Otkydach
4.82 (22)
Ti presento un eccellente indicatore tecnico: Grabber, che funziona come una strategia di trading "tutto incluso", pronta all’uso. In un solo codice sono integrati strumenti potenti per l’analisi tecnica del mercato, segnali di trading (frecce), funzioni di allerta e notifiche push. Ogni acquirente di questo indicatore riceve anche gratuitamente: L’utility Grabber: per la gestione automatica degli ordini aperti Video tutorial passo dopo passo: per imparare a installare, configurare e utilizzare
Shock Pullback
Suleiman Alhawamdah
5 (1)
Semplicemente, puoi iniziare a fare trading quando il movimento dei numeri bianchi — noti come "pips" — inizia ad apparire accanto alla candela corrente. I "pips" bianchi indicano che un'operazione di acquisto o vendita è attualmente attiva e si sta muovendo nella direzione corretta, come indicato dal colore bianco. Quando il movimento dei pips bianchi si interrompe e diventa di colore verde statico, questo segnala la fine della spinta attuale. Il colore verde dei numeri rappresenta il profitto
Market Structure Patterns
Samuel Manoel De Souza
4.47 (19)
Disponibile per   MT4   e   MT5 . Unisciti al canale Market Structure Patterns per scaricare materiale di studio e/o informazioni aggiuntive. Pubblicazioni correlate: Market Structure Patterns - Introduzione Acquistalo ora con 50% di sconto | Prezzo precedente $90 | Offerta valida fino al 31 dicembre | Un importante aggiornamento è in arrivo e il prezzo originale verrà adeguato. Market Structure Patterns   è un indicatore basato sui   Smart Money Concepts   che mostra gli   elementi SMC/ICT  
Trend indicator AI mt5
Ramil Minniakhmetov
5 (13)
Trend Ai indicator è un ottimo strumento che migliorerà l'analisi di mercato di un trader combinando l'identificazione della tendenza con punti di ingresso utilizzabili e avvisi di inversione. Questo indicatore consente agli utenti di navigare nelle complessità del mercato forex con fiducia e precisione Oltre ai segnali primari, l'indicatore Ai di tendenza identifica i punti di ingresso secondari che si presentano durante i pullback o i ritracciamenti, consentendo ai trader di capitalizzare le
Quantum TrendPulse
Bogdan Ion Puscasu
5 (20)
Ecco   Quantum TrendPulse   , lo strumento di trading definitivo che combina la potenza di   SuperTrend   ,   RSI   e   Stocastico   in un unico indicatore completo per massimizzare il tuo potenziale di trading. Progettato per i trader che cercano precisione ed efficienza, questo indicatore ti aiuta a identificare con sicurezza le tendenze di mercato, i cambiamenti di momentum e i punti di entrata e uscita ottimali. Caratteristiche principali: Integrazione SuperTrend:   segui facilmente l'andame
IX Power MT5
Daniel Stein
4.92 (12)
IX Power: Scopri approfondimenti di mercato per indici, materie prime, criptovalute e forex Panoramica IX Power è uno strumento versatile progettato per analizzare la forza di indici, materie prime, criptovalute e simboli forex. Mentre FX Power offre la massima precisione per le coppie di valute utilizzando i dati di tutte le coppie disponibili, IX Power si concentra esclusivamente sui dati di mercato del simbolo sottostante. Questo rende IX Power una scelta eccellente per mercati non correlat
ARICoins
Temirlan Kdyrkhan
ARICoin is a powerful trading companion designed to generate high-probability entry signals with dynamic TP/SL/DP levels based on volatility. Built-in performance tracking shows win/loss stats, PP1/PP2 hits, and success rates all updated live. Key Features: Buy/Sell signals with adaptive volatility bands Real-time TP/SL/DP levels based on ATR Built-in MA Filter with optional ATR/StdDev volatility Performance stats panel (Success, Profit/Loss, PP1/PP2) Alerts via popup, sound, push, or email Cust
Gold Sniper Scalper Pro
Ich Khiem Nguyen
3.5 (8)
Gold Sniper Scalper Pro è un indicatore professionale per MetaTrader 5, progettato per supportare i trader nell'identificare punti di ingresso e gestire il rischio in modo efficace. L'indicatore fornisce un set completo di strumenti analitici che include un sistema di rilevamento dei segnali, gestione automatica di Entry/SL/TP, analisi del volume e statistiche delle performance in tempo reale. Guida utente per comprendere il sistema   |   Guida utente per altre lingue CARATTERISTICHE PRINCIPALI
FX Dynamic MT5
Daniel Stein
5 (5)
FX Dynamic: Monitora volatilità e trend con un’analisi ATR personalizzabile Panoramica FX Dynamic è uno strumento potente che sfrutta i calcoli di Average True Range (ATR) per fornire ai trader informazioni impareggiabili sulla volatilità, sia giornaliera che intraday. Impostando soglie di volatilità chiare—ad esempio 80%, 100%, 130%—puoi individuare rapidamente opportunità di profitto o ricevere avvisi quando il mercato supera i range abituali. FX Dynamic si adatta al fuso orario del tuo brok
PZ Swing Trading MT5
PZ TRADING SLU
5 (5)
Protect against whipsaws: revolutionize your swing trading approach Swing Trading is the first indicator designed to detect swings in the direction of the trend and possible reversal swings. It uses the baseline swing trading approach, widely described in trading literature. The indicator studies several price and time vectors to track the aggregate trend direction and detects situations in which the market is oversold or overbought and ready to correct. [ Installation Guide | Update Guide | Tro
Introduction to X3 Chart Pattern Scanner X3 Cherart Pattern Scanner is the non-repainting and non-lagging indicator detecting X3 chart patterns including Harmonic pattern, Elliott Wave pattern, X3 patterns, and Japanese Candlestick patterns. Historical patterns match with signal patterns. Hence, you can readily develop the solid trading strategy in your chart. More importantly, this superb pattern scanner can detect the optimal pattern of its kind. In addition, you can switch on and off individu
ARIScalping
Temirlan Kdyrkhan
ARIScalp is a powerful trading companion designed to generate high-probability entry signals with dynamic TP/SL/DP levels based on volatility. Built-in performance tracking shows win/loss stats, PP1/PP2 hits, and success rates all updated live. Key Features: Buy/Sell signals with adaptive volatility bands Real-time TP/SL/DP levels based on ATR Built-in MA Filter with optional ATR/StdDev volatility Performance stats panel (Success, Profit/Loss, PP1/PP2) Alerts via popup, sound, push, or email Cus
Altri dall’autore
Super trend X
Murtadha Majid Jeyad Al-Khuzaie
3 (1)
SuperTrend X is a fully automated Expert Advisor built entirely around the power of the SuperTrend indicator – a proven trend-following tool that adapts dynamically to market volatility using the Average True Range (ATR). Unlike traditional systems that rely on lagging oscillators such as RSI or ADX, this EA focuses exclusively on price action and volatility, generating precise entries and exits at every trend reversal. This EA is designed for traders who appreciate clean logic, transparent si
FREE
Strategy EMA 21
Murtadha Majid Jeyad Al-Khuzaie
EMA 21‑13‑8 Scalper – Free Multi‑Currency Expert Advisor for MetaTrader 5 The EMA 21‑13‑8 Scalper is a fully automated trading system designed for traders who want to capture intraday momentum with clarity and discipline. Built on the proven concept of exponential moving averages (EMAs), this Expert Advisor uses the alignment of three EMAs (21, 13, and 8) to identify strong directional trends and filter out market noise. By combining strict entry conditions with early loss‑cutting logic, the s
FREE
Super trend RSI ADX
Murtadha Majid Jeyad Al-Khuzaie
Supertrend RSI ADX Expert Advisor is a professional, multi-filter trading system designed for traders who value precision, control, and consistent performance. This EA combines three of the market’s most reliable tools — Supertrend, RSI, and ADX — into one advanced algorithm that automatically identifies high-probability trade opportunities and manages them with discipline and consistency. Built for MetaTrader 5, this expert advisor was developed with institutional-grade logic and is ideal for
Gold Crowd Density Flip
Murtadha Majid Jeyad Al-Khuzaie
Gold Crowd Density Flip Expert Advisor is a powerful, market-ready trading system designed exclusively for XAUUSD (Gold) on the 15-minute timeframe. Built with precision logic and advanced filters, this EA is engineered to capture explosive breakout opportunities during periods of market compression, while maintaining strict risk management and professional-grade trade execution. Gold is one of the most volatile and liquid instruments in the financial markets, and trading it successfully requi
FREE
Perfect Entry Price
Murtadha Majid Jeyad Al-Khuzaie
Perfect Entry Price — The Smartest Way to Time Your Trades Perfect Entry Price is a next-generation indicator designed to help traders identify the most accurate and reliable price levels for market entries. It automatically scans market structure, volume dynamics, and price behavior to locate zones where a reversal or continuation is most likely to happen. The indicator is ideal for traders who want to enter the market exactly when the probability is highest and risk is lowest — whether you a
Macd storm
Murtadha Majid Jeyad Al-Khuzaie
MACD Storm is a professional Expert Advisor designed for traders who want to harness the proven strength of the Moving Average Convergence Divergence (MACD) indicator. Built with precision and strict compliance to MetaTrader 5 Market standards, this EA executes trades automatically based on clear MACD crossovers, while respecting broker rules for stops, freeze levels, and margin requirements. Unlike many complex robots that overwhelm traders with dozens of parameters, MACD Storm focuses on cla
FREE
Smart Wick Zones
Murtadha Majid Jeyad Al-Khuzaie
5 (1)
Smart Wick Zones indicator is a powerful tool designed to highlight hidden areas of price rejection and liquidity on your chart. By analyzing candle wicks (also called shadows or tails), the indicator automatically draws horizontal zones where strong buying or selling pressure has previously appeared. These wick zones often mark turning points in the market or areas where price reacts strongly, making them excellent references for support and resistance. Instead of manually scanning candles for
FREE
Liquidity Pressure Index
Murtadha Majid Jeyad Al-Khuzaie
Liquidity Pressure Index (LPI) is an advanced technical indicator designed to uncover the hidden battle between buyers and sellers in the market. Unlike conventional oscillators that only rely on price movements, LPI integrates market depth (order book data), ATR-based volatility compression, and adaptive smoothing to give traders a deeper view of true liquidity dynamics. By combining price action with volume absorption and order flow pressure, the LPI helps traders anticipate shifts in market
FREE
Daily Open Color Zones Pro
Murtadha Majid Jeyad Al-Khuzaie
This indicator is a professional tool designed to plot the Daily Open Line and instantly shade the bullish and bearish price zones around it. Instead of leaving traders guessing, it delivers a clear visual map of market sentiment from the very first of the day. Its goal: to help you instantly identify whether the market is trading above or below the daily open — a key reference point for intraday strategies. The indicator automatically draws a horizontal line at the daily open price and shades
FREE
Ai Super trend Final
Murtadha Majid Jeyad Al-Khuzaie
AI SuperTrend Final – Adaptive Intelligence for Smarter Trading The AI SuperTrend Final is not just another trend indicator—it is a next‑generation trading tool powered by adaptive intelligence. Designed for MetaTrader, this indicator combines the proven logic of SuperTrend with advanced filters such as Moving Average (MA), Average Directional Index (ADX), and a unique self‑learning mechanism. The result is a smart, evolving system that adapts to market conditions and continuously improves its
Candle Strength Oscillator
Murtadha Majid Jeyad Al-Khuzaie
Candle Pressure Index (CPI) is a powerful yet easy-to-use indicator designed to reveal the hidden buying and selling pressure behind every candle. Instead of simply showing whether the price moved up or down, CPI digs deeper into how strongly buyers or sellers controlled the market within each candle. This makes it a unique tool for identifying trend strength, spotting reversals early, and confirming entry or exit points with higher accuracy. Unlike traditional oscillators that only react to p
FREE
Super Strike
Murtadha Majid Jeyad Al-Khuzaie
Super Strike — The Ultimate Trend Precision System Super Strike is an advanced trend-following system that combines the proven accuracy of the SuperTrend algorithm with the filtering power of a dynamic Moving Average . Built for traders who demand precision and confidence, this indicator transforms raw price action into a clean, intuitive, and highly informative visual system — a complete framework for making smarter trading decisions. At the heart of Super Strike lies a dynamic calculation o
FREE
Adx rsi orion
Murtadha Majid Jeyad Al-Khuzaie
ADX RSI Orion — Smart Trend Alignment Expert Advisor ADX RSI Orion is a precision-engineered Expert Advisor that combines two of the most respected indicators in technical trading — the Relative Strength Index (RSI) and the Average Directional Movement Index (ADX) — into one intelligent and adaptive trading system. Designed for traders who want clarity and automation, this EA identifies high-probability entries only when both momentum and trend strength agree, delivering smart, data-driven dec
FREE
PFO Price Flow Oscillator
Murtadha Majid Jeyad Al-Khuzaie
PFO Price Flow Oscillator – MT5 Indicator The PFO Price Flow Oscillator is a highly advanced tool designed to help traders anticipate explosive price movements and identify market momentum with precision.One of its most powerful features is the ability to anticipate explosive price moves before they occur, giving traders an early edge in volatile markets. Unlike standard oscillators, the PFO does not rely on price alone—it integrates multiple market factors to provide clear, actionable insight
FREE
Gold Empire
Murtadha Majid Jeyad Al-Khuzaie
Gold Empire EA is a fully integrated automated trading system designed exclusively for Gold (XAUUSD). This expert advisor combines advanced technical logic with intelligent trade management, giving traders a powerful edge in one of the world’s most dynamic markets — Gold versus the US Dollar. Developed with advanced market intelligence and precision-driven logic, Gold Empire EA identifies high-probability trading opportunities based on dynamic price behavior and real-time market structure. I
Ultimate Trend ADX
Murtadha Majid Jeyad Al-Khuzaie
Ultimate Trend ADX is a powerful and refined version of the classic Average Directional Index (ADX), designed to give traders a clearer, more dynamic view of market trends and momentum. Unlike the standard ADX, this enhanced tool applies advanced smoothing techniques (EMA or KAMA) and introduces scaling options to make the indicator lines more responsive and visually impactful. The result is a professional‑grade indicator that helps you identify strong trends, spot reversals, and confirm entrie
BullBear Dynamics
Murtadha Majid Jeyad Al-Khuzaie
BullBear Dynamics is a powerful and intuitive custom indicator designed for MetaTrader 5 traders who want to clearly visualize market momentum, identify bullish and bearish conditions, and trade with confidence. Built with professional-grade algorithms, this tool transforms raw price action into actionable signals using dynamic histograms, signal lines, and adaptive thresholds. Whether you are a beginner exploring technical analysis or an advanced trader looking for a reliable confirmation t
FREE
Delta Correlation Matrix
Murtadha Majid Jeyad Al-Khuzaie
Discover Hidden Market Relationships with Delta Correlation Matrix This indicator is a professional tool designed to measure and visualize the correlation between three different symbols directly on your chart. Instead of relying on static or outdated methods, it dynamically calculates the strength and direction of correlations in real time, helping traders uncover hidden relationships that can influence market moves. Its goal: to provide instant clarity on whether assets are moving together,
FREE
Market Bias Gauge
Murtadha Majid Jeyad Al-Khuzaie
Measure Market Strength at a Glance – Instantly The Momentum Percentage Label is a sleek, professional tool designed to give traders an instant, crystal-clear view of market momentum – directly on their chart. Forget complex setups or cluttered indicators. This tool delivers a single, powerful metric: the percentage of bullish vs. bearish movement over your chosen period. Its purpose: to help you instantly gauge whether buyers or sellers are in control, so you can make faster, more confident
FREE
Spectral Frequency Engine
Murtadha Majid Jeyad Al-Khuzaie
Spectral Frequency Engine — AI-Driven FFT Expert Advisor for EUR/USD (M1) Spectral Frequency Engine is an advanced automated trading system (Expert Advisor) optimized for EUR/USD on the M1 (1-minute) timeframe. This EA uses cutting-edge Fast Fourier Transform (FFT) spectral analysis to identify hidden momentum waves and frequency shifts within market data — transforming raw price movement into a scientific trading signal. Unlike conventional EAs that rely only on moving averages or oscillator
FREE
Final Stochastic Oscillator
Murtadha Majid Jeyad Al-Khuzaie
Final Stochastic Oscillator is a next-generation upgrade of the classic stochastic indicator, enhanced with adaptive smoothing, ADX filtering, and volume confirmation. Designed for traders who want more than just overbought/oversold signals, this tool intelligently adapts to market volatility and trend strength, giving you a clearer, more reliable reading of price momentum. Unlike the standard stochastic, which can produce frequent false signals in choppy conditions, the Final Stochastic Osci
Signal Strike
Murtadha Majid Jeyad Al-Khuzaie
Signal Strike is a professional trading indicator designed for MetaTrader 5 that delivers clear, high‑confidence entry signals directly on your chart. Built with advanced logic that combines trend, momentum, volatility, and volume confirmation, this tool helps traders identify precise BUY and SELL opportunities with confidence. Unlike generic indicators, Signal Strike is engineered to filter out indecision candles and weak setups. When conditions align, the indicator plots entry, stop loss, an
Support and Resistance Algorithm
Murtadha Majid Jeyad Al-Khuzaie
Discover the Strongest Support and Resistance Areas. This indicator is an advanced tool for identifying and plotting support and resistance levels on a chart. Instead of using a simple method, it follows a dynamic approach to identifying the most important levels. Its goal: to find important highs and lows that represent potential price reversal points. The indicator analyzes three different time frames that you specify in the inputs: TF1, TF2, and TF3. Support and Resistance is the profession
Trend Pulse X
Murtadha Majid Jeyad Al-Khuzaie
The Trend Pulse X – Continuous Colored Line is a next-generation trend-following indicator designed to give traders a crystal-clear view of market direction, strength, and momentum. Unlike standard indicators that often leave gaps or inconsistent readings, Trend Pulse X delivers a smooth, continuous line that adapts dynamically to price action, ensuring you always have a reliable guide on your chart. With its innovative color-coded system, Trend Pulse X helps traders instantly identify bullish
RSI NextGen
Murtadha Majid Jeyad Al-Khuzaie
RSI NextGen Advanced RSI Indicator The RSI NextGen is an advanced and modernized version of the classic Relative Strength Index (RSI). It comes with enhanced features that deliver far more accurate and reliable signals across different market conditions. This indicator has been designed to provide traders with a dynamic and adaptive view of overbought and oversold zones, instead of relying on the static and rigid settings of the traditional RSI. Unlike the standard RSI, which is calculated us
Trend Scope pro
Murtadha Majid Jeyad Al-Khuzaie
Trend Scope Pro – Precision Linear Regression Channels for Smarter Trading Trend Scope Pro is a powerful trading indicator built on the concept of Linear Regression Channels, designed to give traders a crystal-clear view of market trends, volatility, and potential reversal zones. This professional-grade tool brings advanced statistical analysis right onto your MetaTrader 5 charts, helping you make smarter, more confident trading decisions. Unlike traditional moving averages or static trendlin
Final Moving Average
Murtadha Majid Jeyad Al-Khuzaie
Final Moving Average – Indicator Description The Final Moving Average is a next-generation technical tool designed for traders who demand precision, adaptability, and clarity in their charts. Unlike traditional moving averages that use fixed periods and often lag behind the market, this indicator is built on a smart adaptive algorithm that dynamically adjusts itself based on market volatility and trading volume. How to Read the Indicator Line Direction: An upward-sloping Final Moving Averag
Equilibrium Gravity USDJPY
Murtadha Majid Jeyad Al-Khuzaie
This expert advisor works perfectly on USD/JPY on 1 minute and 5 minute time frames.   Equilibrium Gravity USD/JPY is a next-generation Expert Advisor built around a revolutionary concept of dynamic price equilibrium. Instead of relying on lagging indicators or static thresholds, this EA detects and adapts to the ever-shifting “gravitational” center of USD/JPY price movement — the point where balance, momentum, and volatility intersect. Engineered with a focus on stability and precision, Equili
Super Trend Ultimate X
Murtadha Majid Jeyad Al-Khuzaie
In the fast-paced world of trading, precision and reliability are everything. Traders know that a single false signal can mean the difference between profit and loss. That’s why Super Trend Ultimate X was created: a next-generation trading indicator that takes the proven foundation of the classic SuperTrend and elevates it to an entirely new level of accuracy, stability, and performance. Unlike the traditional SuperTrend, which relies solely on ATR calculations, Super Trend Ultimate X integrat
Ready Trade System
Murtadha Majid Jeyad Al-Khuzaie
Ready Trade System — The All-in-One Dynamic Entry, Stop & Take-Profit Indicator Ready Trade System is a complete trading framework designed for traders who demand clarity, precision, and confidence in every move. Built on advanced multi-filter logic, this indicator dynamically calculates and displays optimal Entry, Stop Loss, and Take-Profit levels directly on your chart — adapting instantly to market volatility and trend behavior. This isn’t just another visual indicator — it’s a decision-ma
Filtro:
Nessuna recensione
Rispondi alla recensione