Unicorn Model ICT
- Indicatori
-
Cao Minh Quang
 Welcome to my profile. I am a developer MQL4 and MQL5.
Telegram: https://t.me/storevan
Thanks and regards! - Versione: 1.1
- Aggiornato: 5 aprile 2025
- Attivazioni: 5
Unicorn Model ICT Indicator — Smart Trading with Precision
The Unicorn Model ICT Indicator is a powerful and intelligent tool designed for traders who follow Smart Money Concepts (SMC) and Inner Circle Trader (ICT) methodologies. This indicator simplifies complex price action by visually identifying key market structures and providing high-probability trade setups.
- Key Features:
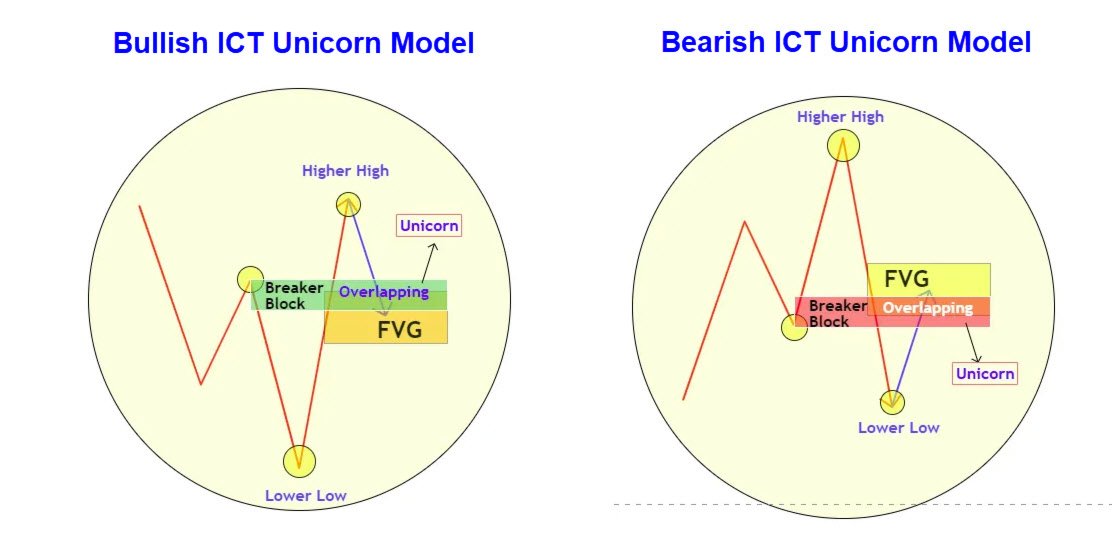
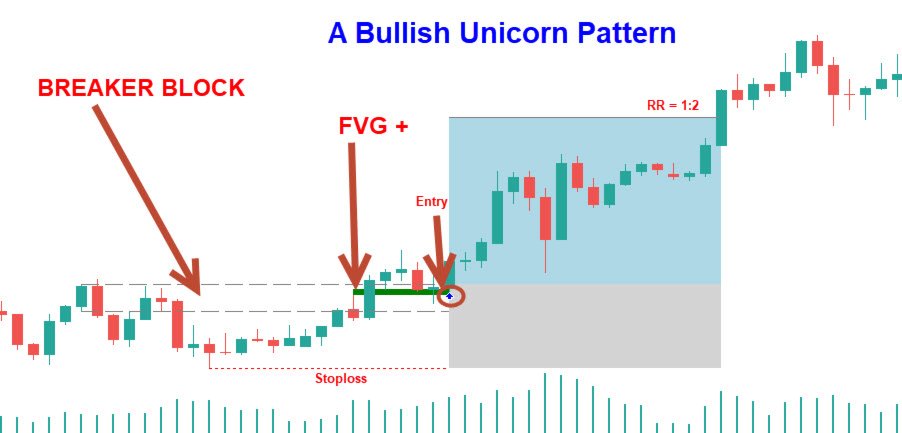
A Bullish Unicorn Pattern
- A Lower Low (LL), followed by a Higher High (HH)
- A Fair Value Gap (FVG), overlapping the established Breaker Block
- A successful re-test of the FVG which confirms the pattern.
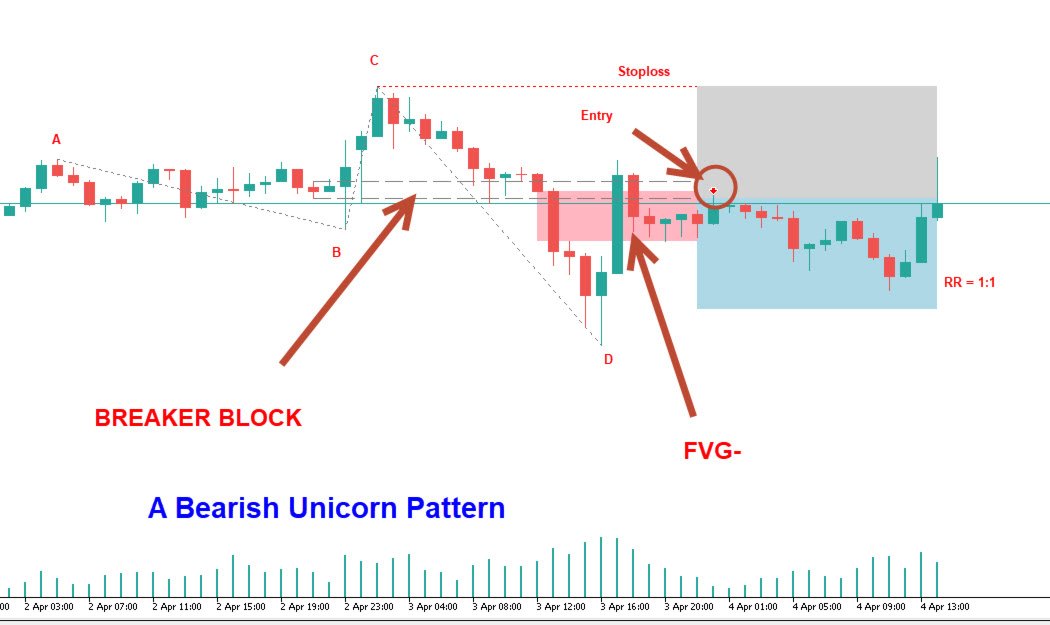
A Bearish Unicorn Pattern
- A Higher High (HH), followed by a Lower Low (LL)
- A Fair Value Gap (FVG), overlapping the established Breaker Block
- A successful re-test of the FVG which confirms the pattern
Breaker Block Detection
The indicator automatically highlights Breaker Blocks, which are failed Order Blocks that become significant support/resistance zones. These blocks often mark areas where smart money reverses market direction after liquidity sweeps.
- Bullish Breaker Block: Appears after a bearish order block is broken to the upside.
- Bearish Breaker Block: Appears after a bullish order block is broken to the downside.
These zones are critical for detecting retests and reversals.
Fair Value Gap (FVG)
The indicator dynamically scans and marks Fair Value Gaps — imbalanced zones where price moved aggressively, leaving inefficiencies.
- Helps identify zones likely to be filled before continuation.
- Confirms institutional interest and momentum areas.
FVGs near Breaker Blocks are considered premium trade zones.
Entry Optimization
The indicator provides entry signals based on confluence between Breaker Blocks, FVGs.
- Entry is typically taken at the equilibrium of Breaker Block or center of FVG.
- Optional alerts notify users when price enters high-probability zones.
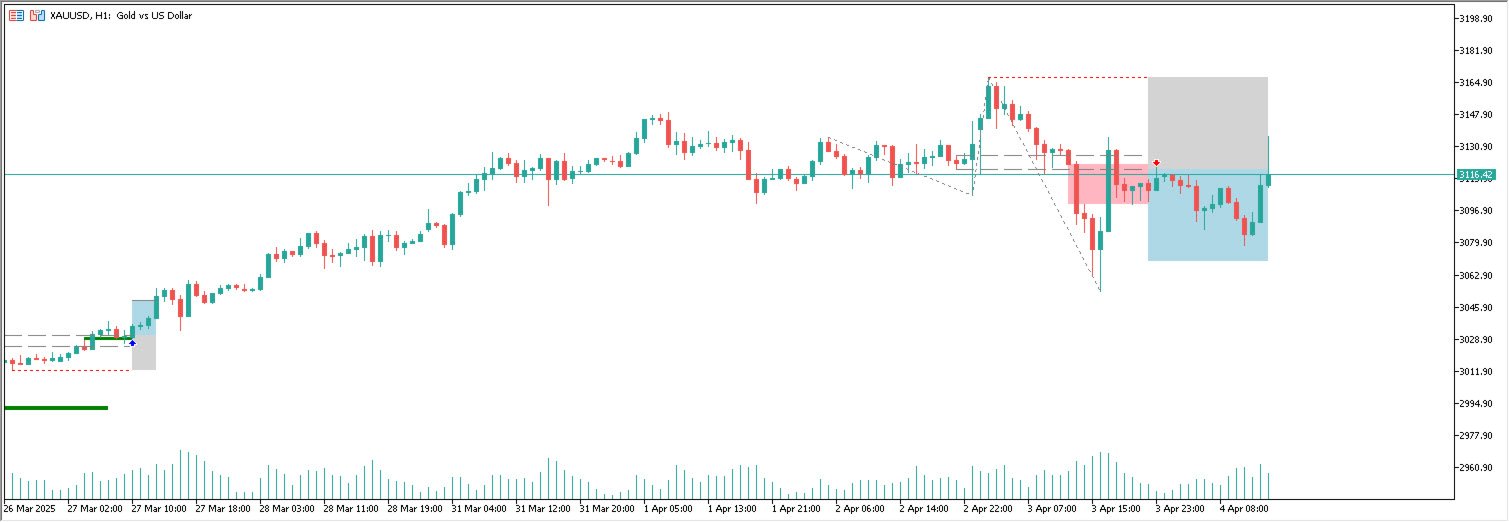
Risk-to-Reward Ratio (R/R) Visualization
The Unicorn Model helps traders manage their trades with clear visual risk and reward zones.
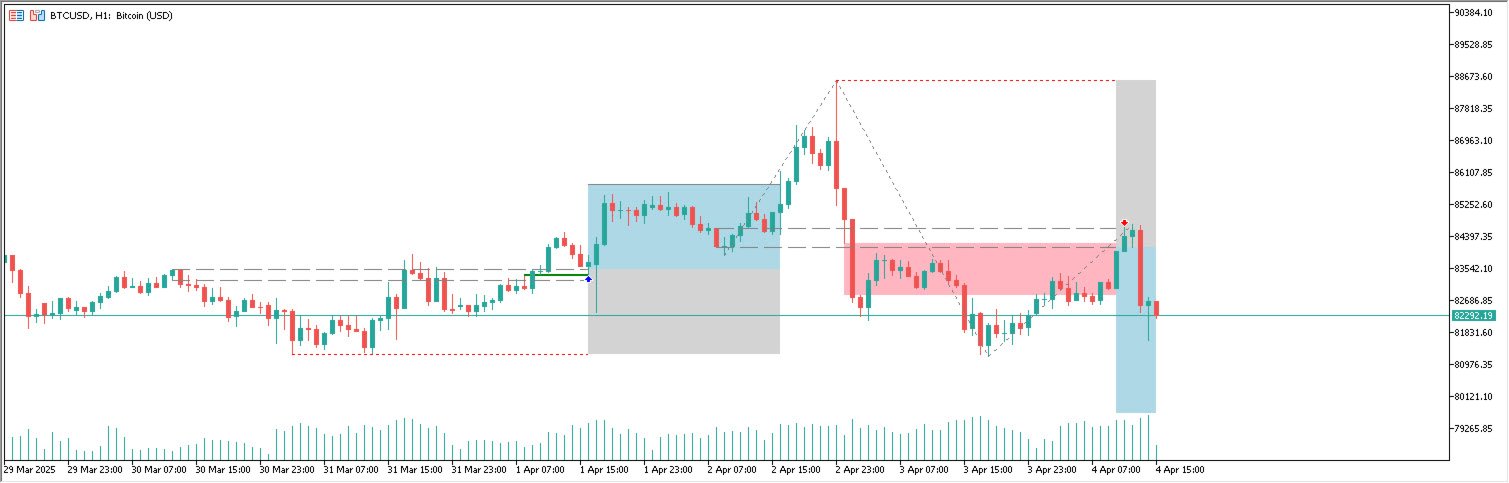
A confirmed Unicorn pattern will show a blue (Target) / grey (Stop Loss) "Risk/Reward" areas (RR).
When the Stop Loss or Target is hit, a gray line is shown on the concerned side.
- SL suggested just beyond the Breaker Block or FVG boundary.
- Customizable R/R ratio lines assist in risk management and strategy backtesting
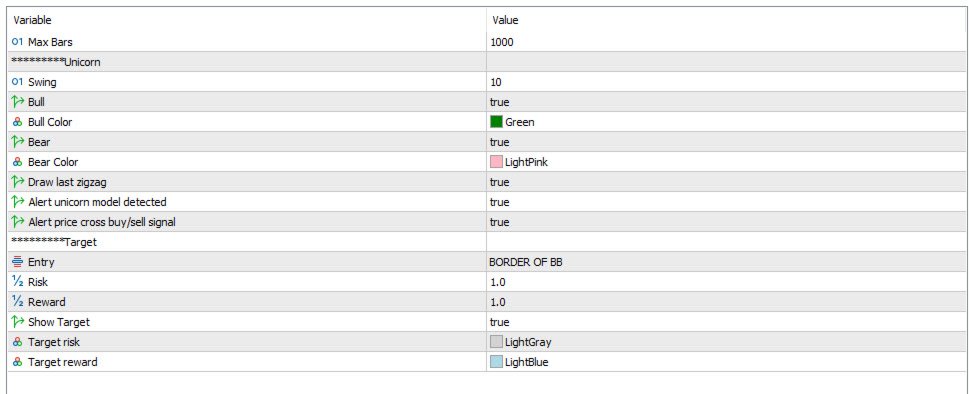
- Settings:
Unicorn
- Swing: Set the length of swings, used for the ZigZag and Unicorn Patterns detection.
- Bull: Enable/disable Bullish Unicorn patterns
- Bear: Enable/disable Bearish Unicorn patterns
- Filter FVG height (by ATR(14) multiplied): FVG is considered valid when its height is greater than the ATR multiplied by this value. Default is 0.05
- Draw last zigzag: Enable/disable last ZigZag
- Alert unicorn model detected: Enable/disable alert when unicorn model detected
- Alert price cross buy/sell entry: Enable/disable alert when price cross buy/sell entry
Target
- Entry: Adjust entry value
- Risk: Set up risk ratio
- Reward: Set up reward ratio
- Show Target: Enable/disable target RR
- Target risk: Target risk color
- Target reward: Target reward color
- Why Unicorn Model ICT?
- Combines multiple SMC concepts in a simple, visual tool.
- Reduces noise and enhances entry timing.
- Designed for scalping, day trading, and swing trading strategies.
- Compatible with all timeframes and assets (Forex, Crypto, Indices, etc.).