TrendMaster Dashboard
- Indicatori
-
Low Meng Fai
 Let's be reasonable.
 - Versione: 2.0
- Attivazioni: 8
TrendMaster Dashboard: Your Comprehensive Trend Analysis Tool
The TrendMaster Dashboard is an advanced Expert Advisor (EA) crafted for MetaTrader 5 (MT5), aimed at simplifying and enhancing your trading experience. This powerful tool consolidates multiple technical indicators and price action analysis into a single, user-friendly dashboard, offering clear Buy, Sell, and Reversal signals through a weighted scoring system. Whether you’re new to trading or a seasoned professional, the TrendMaster Dashboard provides actionable insights to improve your decision-making and streamline your trading process.
Benefits of TrendMaster Dashboard
Here’s why the TrendMaster Dashboard is a game-changer for traders:
- Automated Market Analysis: Analyze over 14 technical indicators—like Moving Averages, MACD, RSI, and ADX—without lifting a finger. The EA continuously monitors the market and updates signals in real time, saving you hours of manual chart analysis.
- Emotion-Free Decisions: Eliminate fear and greed from your trading. The EA delivers objective, data-driven signals, helping you stick to your strategy without emotional interference.
- Holistic Market View: Get a complete picture of market trends by combining indicator signals with price action elements such as trendlines, Fibonacci retracements, and support/resistance zones—all in one dashboard.
- Weighted Scoring System: Simplify complex data with a unique scoring system that assigns Buy, Sell, and Reversal percentages. This makes it easy to assess market sentiment at a glance.
- Customizable to Your Needs: Tailor the EA to your trading style by adjusting indicator weights and settings, ensuring it aligns perfectly with your preferred strategy.
- Visual Clarity: Optionally display trendlines, Fibonacci levels, and support/resistance directly on your chart for a richer trading context.
- Time Efficiency: Focus on strategy rather than constant monitoring—the dashboard condenses critical information into an easy-to-read table.
How to Use TrendMaster Dashboard to Trade: A Step-by-Step Guide
The TrendMaster Dashboard is a powerful indicator for MetaTrader 5 (MT5) that simplifies trend analysis by consolidating signals from over 14 technical indicators and price action elements into a user-friendly table. It provides clear Buy, Sell, and Reversal signals through a weighted scoring system, helping you make data-driven trading decisions. Whether you're a beginner or an experienced trader, this guide will walk you through how to use the TrendMaster Dashboard to trade effectively.
Step 1: Understand the Dashboard Layout
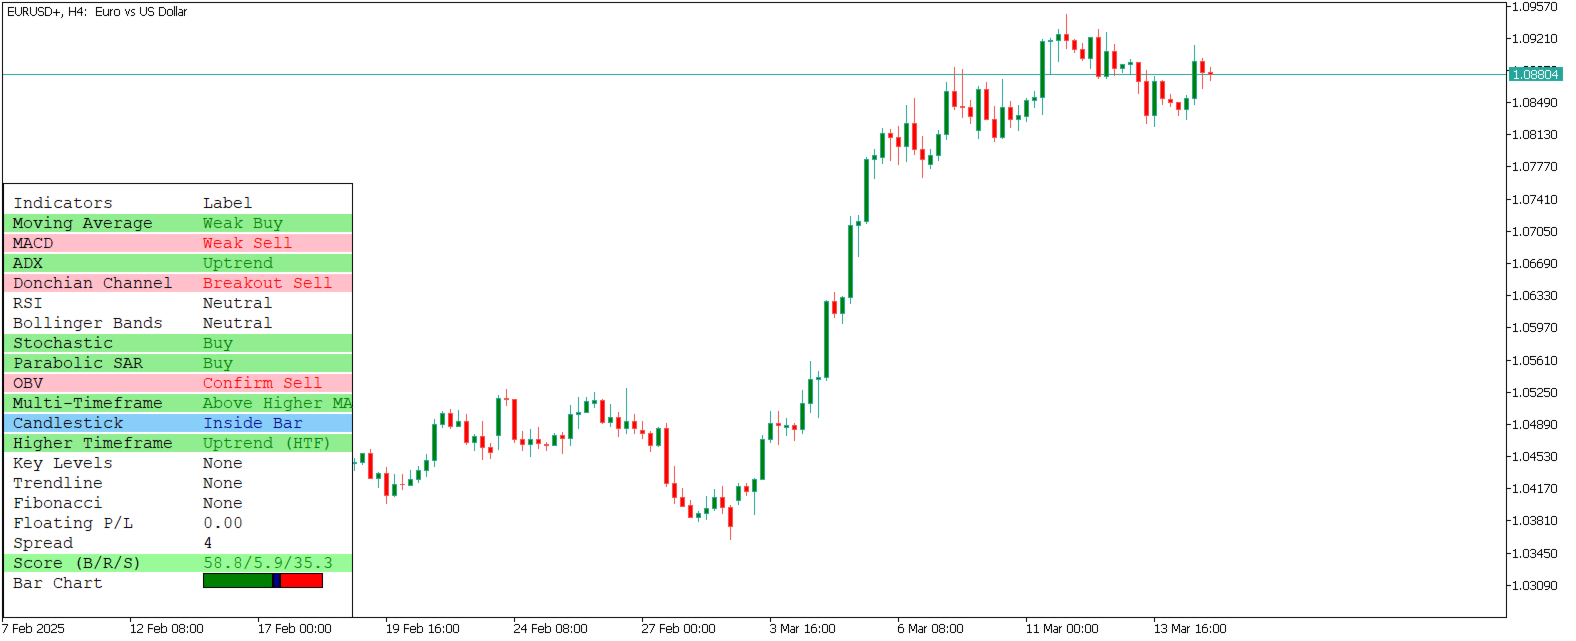
Once you attach the TrendMaster Dashboard to your MT5 chart, it displays a table with the following key components:
- Indicator Signals:
- Each row corresponds to a technical indicator (e.g., Moving Averages, MACD, RSI, ADX) or price action element (e.g., trendlines, Fibonacci levels, support/resistance).
- Signals are labeled as "Strong Buy," "Weak Buy," "Neutral," "Weak Sell," "Strong Sell," "Overbought," "Oversold," or similar, depending on the indicator.
- Colors enhance readability:
- Green: Buy signals (bullish).
- Red: Sell signals (bearish).
- Blue: Reversal or neutral signals.
- Background shading reflects signal strength (e.g., darker green for Strong Buy, lighter green for Weak Buy).
- Score Row (B/R/S):
- Located at the bottom of the table, this row shows the overall market sentiment as percentages:
- B (Buy): Percentage of bullish signals.
- R (Reversal): Percentage of reversal or neutral signals.
- S (Sell): Percentage of bearish signals.
- Example: "60.0/20.0/20.0" means 60% Buy, 20% Reversal, and 20% Sell, indicating a bullish bias.
- Optional Bar Chart:
- If enabled (ShowBarChartRow = true), a bar chart appears below the Score row, visually representing the Buy, Reversal, and Sell percentages for quick reference.
- Optional Visual Price Action:
- If enabled (InpShowVisualPA = true), trendlines, Fibonacci levels, and support/resistance lines are drawn on the chart, providing additional context for price movements.
Step 2: Interpret the Signals
The TrendMaster Dashboard is designed to simplify decision-making by combining multiple indicators into a cohesive view. Here's how to interpret the signals:
- Check the Score Row for Market Sentiment:
- Bullish Bias: If the Buy percentage (B) is significantly higher (e.g., 60%+), the market is likely trending upward. Consider long (buy) positions.
- Bearish Bias: If the Sell percentage (S) is significantly higher (e.g., 60%+), the market is likely trending downward. Consider short (sell) positions.
- Reversal or Neutral Bias: If the Reversal percentage (R) is high (e.g., 40%+), the market may be at a turning point or ranging. Exercise caution and look for confirmation from price action visuals.
- Balanced Scores: If scores are close (e.g., 40/30/30), the market is indecisive. Wait for stronger signals or use other tools to confirm direction.
- Analyze Individual Indicator Signals:
- Moving Averages (MA):
- "Strong Buy" (Fast MA > Slow MA, price > Fast MA) suggests a strong uptrend.
- "Strong Sell" (Fast MA < Slow MA, price < Fast MA) suggests a strong downtrend.
- MACD:
- "Strong Buy" (MACD > Signal, MACD > 0) indicates bullish momentum.
- "Strong Sell" (MACD < Signal, MACD < 0) indicates bearish momentum.
- RSI:
- "Overbought" (RSI > 70) suggests a potential reversal (bearish).
- "Oversold" (RSI < 30) suggests a potential reversal (bullish).
- Price Action (Trendlines, Fibonacci, Support/Resistance):
- If the price is near a trendline, Fibonacci level, or support/resistance zone, watch for breakouts or bounces.
- Example: A "Strong Buy" signal near a support zone with a bullish candlestick pattern (e.g., Bullish Engulfing) confirms a potential long entry.
- Use the Optional Visuals for Context:
- If enabled, check the trendlines, Fibonacci levels, and support/resistance drawn on the chart.
- Example: If the dashboard shows a "Strong Buy" signal and the price is breaking above a trendline, it confirms bullish momentum.
- Use these visuals to identify key levels for entry, stop-loss, and take-profit placement.
Step 3: Develop a Trading Strategy
The TrendMaster Dashboard is a versatile tool that can fit various trading styles. Here's how to use it for common strategies:
- Trend Following:
- Entry:
- Enter a long position when the Buy score is high (e.g., 60%+), supported by "Strong Buy" signals from Moving Averages and MACD.
- Enter a short position when the Sell score is high (e.g., 60%+), supported by "Strong Sell" signals.
- Confirmation:
- Use price action visuals (e.g., price breaking above a trendline for longs, below for shorts).
- Look for confirming candlestick patterns (e.g., Bullish Engulfing for longs, Bearish Engulfing for shorts).
- Exit:
- Exit longs when the Sell or Reversal score increases significantly (e.g., Sell > 40%).
- Exit shorts when the Buy or Reversal score increases significantly (e.g., Buy > 40%).
- Stop-Loss:
- Place below recent support for longs, or above recent resistance for shorts.
- Take-Profit:
- Target key Fibonacci levels or resistance for longs, support for shorts.
- Reversal Trading:
- Entry:
- Enter a long position when the Reversal score is high (e.g., 40%+), RSI is "Oversold," and the price is near a support zone.
- Enter a short position when the Reversal score is high, RSI is "Overbought," and the price is near a resistance zone.
- Confirmation:
- Look for reversal candlestick patterns (e.g., Doji, Bullish Engulfing for longs, Bearish Engulfing for shorts).
- Use Fibonacci levels to confirm proximity to key reversal points.
- Exit:
- Exit longs when the Sell score increases significantly (e.g., Sell > 40%).
- Exit shorts when the Buy score increases significantly (e.g., Buy > 40%).
- Stop-Loss:
- Place above recent resistance for longs, or below recent support for shorts.
- Take-Profit:
- Target the next Fibonacci level or opposing support/resistance zone.
- Range Trading:
- Entry:
- Enter longs near support zones with "Weak Buy" or "Oversold" signals.
- Enter shorts near resistance zones with "Weak Sell" or "Overbought" signals.
- Confirmation:
- Use the Reversal score (e.g., 30%+) to identify ranging conditions.
- Confirm with price action visuals (e.g., price bouncing between support and resistance).
- Exit:
- Exit longs near resistance, or if the Sell score increases significantly.
- Exit shorts near support, or if the Buy score increases significantly.
- Stop-Loss:
- Place below support for longs, or above resistance for shorts.
- Take-Profit:
- Target the opposite boundary of the range (e.g., resistance for longs, support for shorts).
Step 4: Customize the Indicator for Your Strategy
The TrendMaster Dashboard is highly customizable, allowing you to tailor it to your trading style. Adjust the following inputs to optimize performance:
- Indicator Periods and Levels:
- Shorten periods (e.g., InpFastMA = 20, InpSlowMA = 50) for scalping or day trading.
- Lengthen periods (e.g., InpFastMA = 50, InpSlowMA = 200) for swing or position trading.
- Adjust RSI levels (e.g., InpRSI_Overbought = 80, InpRSI_Oversold = 20) for volatile markets.
- Indicator Weights:
- Increase weights for indicators you trust most (e.g., Weight_MA = 2.0 for Moving Averages if you prioritize trend-following).
- Decrease weights for less relevant indicators (e.g., Weight_RSI = 0.5 if RSI is less critical for your strategy).
- General Settings:
- Set CalculateOnClose = true for swing trading (signals update after candle close, reducing noise).
- Set CalculateOnClose = false for scalping (real-time updates for faster entries).
- Enable ShowBarChartRow = true for a visual summary of scores.
- Price Action Visualization:
- Enable InpShowVisualPA = true to display trendlines, Fibonacci levels, and support/resistance on the chart.
- Customize colors (e.g., InpTrendlineColor = clrBlue, InpFibColor = clrGold) for better visibility.
Step 5: Test and Refine Your Strategy
Before trading live, test the TrendMaster Dashboard to ensure it aligns with your goals:
- Demo Account Testing:
- Run the indicator on a demo account with your preferred settings.
- Simulate trades based on the signals and track performance over multiple sessions.
- Adjust weights, periods, and settings to optimize results.
- Evaluate Performance:
- Assess win rate, average profit/loss, and drawdowns.
- Identify patterns (e.g., does it perform better in trending or ranging markets?).
- Refine Your Approach:
- If signals are too frequent, increase periods or set CalculateOnClose = true.
- If signals are too delayed, decrease periods or set CalculateOnClose = false.
- Experiment with different indicator weights to emphasize reliable signals.
Step 6: Trade Live with Confidence
Once you're comfortable with the indicator's performance, transition to live trading:
- Start Small:
- Use a small position size initially to manage risk.
- Gradually increase exposure as you gain confidence.
- Combine with Risk Management:
- Use stop-loss orders to protect against unexpected reversals.
- Follow a risk-reward ratio (e.g., 1:2 or higher) to ensure profitable trades outweigh losses.
- Limit risk per trade (e.g., 1-2% of account balance).
- Monitor and Adapt:
- Regularly review the dashboard for updated signals.
- Adjust settings as market conditions change (e.g., increase weights for volatility indicators during news events).
Key Tips for Success
- Combine Signals with Context: Don't rely solely on the dashboard; use price action visuals, candlestick patterns, and market news for confirmation.
- Avoid Overtrading: Wait for strong signals (e.g., high Buy/Sell scores) to avoid false entries in choppy markets.
- Stay Disciplined: Stick to your strategy and avoid impulsive trades based on emotions.
- Leverage Customization: Tailor the indicator to your timeframe (e.g., scalping on M5, swing trading on H1) and trading style.
- Stay Informed: Understand the indicators and price action elements used by the dashboard to interpret signals accurately.
Input Parameters
The TrendMaster Dashboard offers extensive customization through its input parameters. Below are the key settings you can adjust:
General Settings
- InpYDistance (default: 185): Controls the vertical position of the dashboard on the chart.
- CalculateOnClose (default: false): If set to true, signals update only after a candle closes; if false, updates happen in real time.
- ShowBarChartRow (default: true): Adds a bar chart of Buy/Reversal/Sell scores at the bottom of the dashboard.
Indicator Periods and Levels
- InpFastMA (default: 50): Sets the period for the fast Moving Average.
- InpSlowMA (default: 200): Sets the period for the slow Moving Average.
- InpMACD_Fast (default: 12), InpMACD_Slow (default: 26), InpMACD_Signal (default: 9): Configures the MACD indicator.
- InpRSI_Period (default: 14), InpRSI_Overbought (default: 70), InpRSI_Oversold (default: 30): Defines RSI settings for identifying overbought/oversold levels.
- (Similar inputs exist for ADX, Bollinger Bands, and other indicators.)
Price Action Visualization
- InpShowVisualPA (default: true): Enables/disables trendlines, Fibonacci levels, and support/resistance on the chart.
- InpTrendlineColor (default: clrBlue): Sets the color for trendlines.
- InpFibColor (default: clrGold): Sets the color for Fibonacci retracement levels.
- InpSRColor (default: clrRed): Sets the color for support/resistance lines.
Indicator Weights
- Weight_MA (default: 1.0): Assigns importance to Moving Average signals in the scoring system.
- Weight_MACD (default: 1.0): Assigns importance to MACD signals.
- (Weights for other indicators let you emphasize your preferred signals.)
Alert Settings
- (Currently disabled, but placeholders are included for future alert features.)
Why TrendMaster Dashboard Helps You Trade Better
The TrendMaster Dashboard removes the guesswork from trading by providing a consolidated view of market trends and reversals. Its weighted scoring system simplifies complex data, while customizable settings ensure it fits your unique strategy. Whether you're trend-following, reversal trading, or range trading, this indicator empowers you to make informed, confident decisions.
How to Use TrendMaster Dashboard to Trade: A Step-by-Step Guide
The TrendMaster Dashboard is a powerful indicator for MetaTrader 5 (MT5) that simplifies trend analysis by consolidating signals from over 14 technical indicators and price action elements into a user-friendly table. It provides clear Buy, Sell, and Reversal signals through a weighted scoring system, helping you make data-driven trading decisions. Whether you're a beginner or an experienced trader, this guide will walk you through how to use the TrendMaster Dashboard to trade effectively.
Step 1: Understand the Dashboard Layout
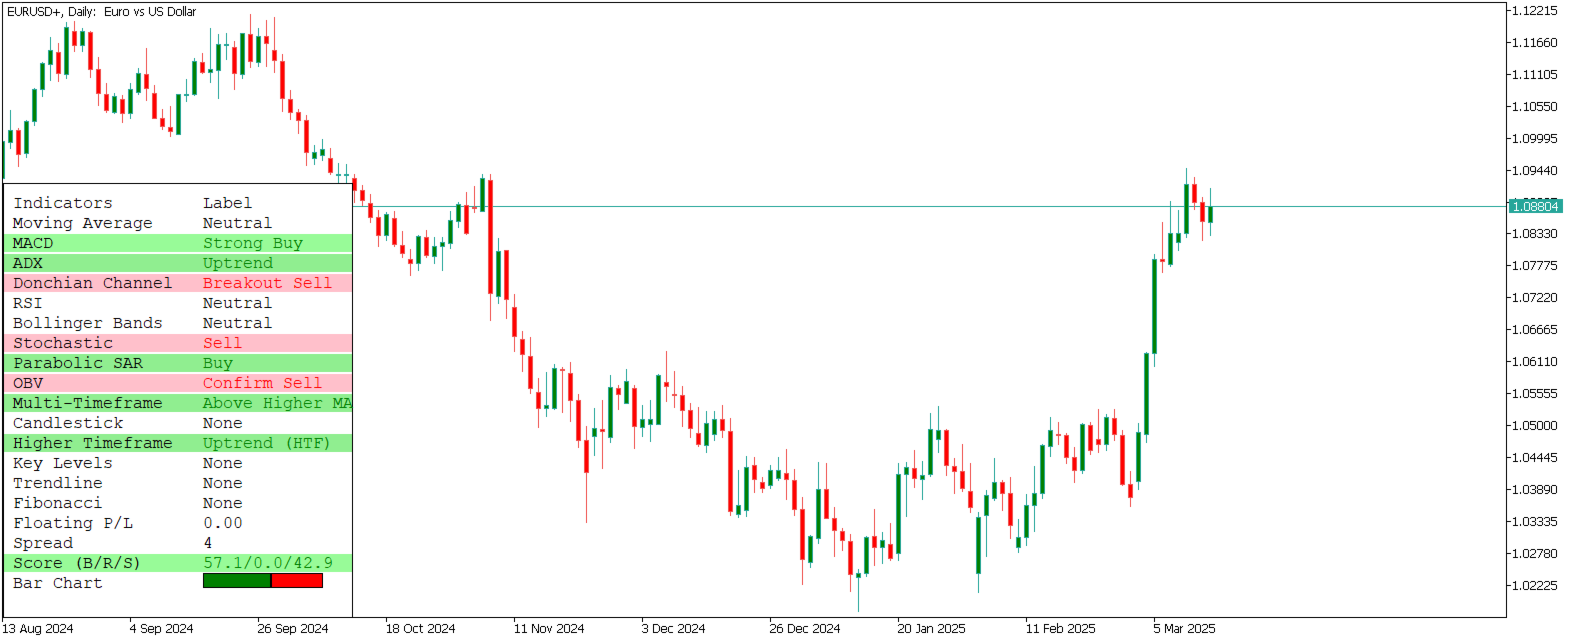
Once you attach the TrendMaster Dashboard to your MT5 chart, it displays a table with the following key components:
- Indicator Signals:
- Each row corresponds to a technical indicator (e.g., Moving Averages, MACD, RSI, ADX) or price action element (e.g., trendlines, Fibonacci levels, support/resistance).
- Signals are labeled as "Strong Buy," "Weak Buy," "Neutral," "Weak Sell," "Strong Sell," "Overbought," "Oversold," or similar, depending on the indicator.
- Colors enhance readability:
- Green: Buy signals (bullish).
- Red: Sell signals (bearish).
- Blue: Reversal or neutral signals.
- Background shading reflects signal strength (e.g., darker green for Strong Buy, lighter green for Weak Buy).
- Score Row (B/R/S):
- Located at the bottom of the table, this row shows the overall market sentiment as percentages:
- B (Buy): Percentage of bullish signals.
- R (Reversal): Percentage of reversal or neutral signals.
- S (Sell): Percentage of bearish signals.
- Example: "60.0/20.0/20.0" means 60% Buy, 20% Reversal, and 20% Sell, indicating a bullish bias.
- Located at the bottom of the table, this row shows the overall market sentiment as percentages:
- Optional Bar Chart:
- If enabled (ShowBarChartRow = true), a bar chart appears below the Score row, visually representing the Buy, Reversal, and Sell percentages for quick reference.
- Optional Visual Price Action:
- If enabled (InpShowVisualPA = true), trendlines, Fibonacci levels, and support/resistance lines are drawn on the chart, providing additional context for price movements.
Step 2: Interpret the Signals
The TrendMaster Dashboard is designed to simplify decision-making by combining multiple indicators into a cohesive view. Here's how to interpret the signals:
- Check the Score Row for Market Sentiment:
- Bullish Bias: If the Buy percentage (B) is significantly higher (e.g., 60%+), the market is likely trending upward. Consider long (buy) positions.
- Bearish Bias: If the Sell percentage (S) is significantly higher (e.g., 60%+), the market is likely trending downward. Consider short (sell) positions.
- Reversal or Neutral Bias: If the Reversal percentage (R) is high (e.g., 40%+), the market may be at a turning point or ranging. Exercise caution and look for confirmation from price action visuals.
- Balanced Scores: If scores are close (e.g., 40/30/30), the market is indecisive. Wait for stronger signals or use other tools to confirm direction.
- Analyze Individual Indicator Signals:
- Moving Averages (MA):
- "Strong Buy" (Fast MA > Slow MA, price > Fast MA) suggests a strong uptrend.
- "Strong Sell" (Fast MA < Slow MA, price < Fast MA) suggests a strong downtrend.
- MACD:
- "Strong Buy" (MACD > Signal, MACD > 0) indicates bullish momentum.
- "Strong Sell" (MACD < Signal, MACD < 0) indicates bearish momentum.
- RSI:
- "Overbought" (RSI > 70) suggests a potential reversal (bearish).
- "Oversold" (RSI < 30) suggests a potential reversal (bullish).
- Price Action (Trendlines, Fibonacci, Support/Resistance):
- If the price is near a trendline, Fibonacci level, or support/resistance zone, watch for breakouts or bounces.
- Example: A "Strong Buy" signal near a support zone with a bullish candlestick pattern (e.g., Bullish Engulfing) confirms a potential long entry.
- Moving Averages (MA):
- Use the Optional Visuals for Context:
- If enabled, check the trendlines, Fibonacci levels, and support/resistance drawn on the chart.
- Example: If the dashboard shows a "Strong Buy" signal and the price is breaking above a trendline, it confirms bullish momentum.
- Use these visuals to identify key levels for entry, stop-loss, and take-profit placement.
Step 3: Develop a Trading Strategy
The TrendMaster Dashboard is a versatile tool that can fit various trading styles. Here's how to use it for common strategies:
- Trend Following:
- Entry:
- Enter a long position when the Buy score is high (e.g., 60%+), supported by "Strong Buy" signals from Moving Averages and MACD.
- Enter a short position when the Sell score is high (e.g., 60%+), supported by "Strong Sell" signals.
- Confirmation:
- Use price action visuals (e.g., price breaking above a trendline for longs, below for shorts).
- Look for confirming candlestick patterns (e.g., Bullish Engulfing for longs, Bearish Engulfing for shorts).
- Exit:
- Exit longs when the Sell or Reversal score increases significantly (e.g., Sell > 40%).
- Exit shorts when the Buy or Reversal score increases significantly (e.g., Buy > 40%).
- Stop-Loss:
- Place below recent support for longs, or above recent resistance for shorts.
- Take-Profit:
- Target key Fibonacci levels or resistance for longs, support for shorts.
- Entry:
- Reversal Trading:
- Entry:
- Enter a long position when the Reversal score is high (e.g., 40%+), RSI is "Oversold," and the price is near a support zone.
- Enter a short position when the Reversal score is high, RSI is "Overbought," and the price is near a resistance zone.
- Confirmation:
- Look for reversal candlestick patterns (e.g., Doji, Bullish Engulfing for longs, Bearish Engulfing for shorts).
- Use Fibonacci levels to confirm proximity to key reversal points.
- Exit:
- Exit longs when the Sell score increases significantly (e.g., Sell > 40%).
- Exit shorts when the Buy score increases significantly (e.g., Buy > 40%).
- Stop-Loss:
- Place above recent resistance for longs, or below recent support for shorts.
- Take-Profit:
- Target the next Fibonacci level or opposing support/resistance zone.
- Entry:
- Range Trading:
- Entry:
- Enter longs near support zones with "Weak Buy" or "Oversold" signals.
- Enter shorts near resistance zones with "Weak Sell" or "Overbought" signals.
- Confirmation:
- Use the Reversal score (e.g., 30%+) to identify ranging conditions.
- Confirm with price action visuals (e.g., price bouncing between support and resistance).
- Exit:
- Exit longs near resistance, or if the Sell score increases significantly.
- Exit shorts near support, or if the Buy score increases significantly.
- Stop-Loss:
- Place below support for longs, or above resistance for shorts.
- Take-Profit:
- Target the opposite boundary of the range (e.g., resistance for longs, support for shorts).
- Entry:
Step 4: Customize the Indicator for Your Strategy
The TrendMaster Dashboard is highly customizable, allowing you to tailor it to your trading style. Adjust the following inputs to optimize performance:
- Indicator Periods and Levels:
- Shorten periods (e.g., InpFastMA = 20, InpSlowMA = 50) for scalping or day trading.
- Lengthen periods (e.g., InpFastMA = 50, InpSlowMA = 200) for swing or position trading.
- Adjust RSI levels (e.g., InpRSI_Overbought = 80, InpRSI_Oversold = 20) for volatile markets.
- Indicator Weights:
- Increase weights for indicators you trust most (e.g., Weight_MA = 2.0 for Moving Averages if you prioritize trend-following).
- Decrease weights for less relevant indicators (e.g., Weight_RSI = 0.5 if RSI is less critical for your strategy).
- General Settings:
- Set CalculateOnClose = true for swing trading (signals update after candle close, reducing noise).
- Set CalculateOnClose = false for scalping (real-time updates for faster entries).
- Enable ShowBarChartRow = true for a visual summary of scores.
- Price Action Visualization:
- Enable InpShowVisualPA = true to display trendlines, Fibonacci levels, and support/resistance on the chart.
- Customize colors (e.g., InpTrendlineColor = clrBlue, InpFibColor = clrGold) for better visibility.
Step 5: Test and Refine Your Strategy
Before trading live, test the TrendMaster Dashboard to ensure it aligns with your goals:
- Demo Account Testing:
- Run the indicator on a demo account with your preferred settings.
- Simulate trades based on the signals and track performance over multiple sessions.
- Adjust weights, periods, and settings to optimize results.
- Evaluate Performance:
- Assess win rate, average profit/loss, and drawdowns.
- Identify patterns (e.g., does it perform better in trending or ranging markets?).
- Refine Your Approach:
- If signals are too frequent, increase periods or set CalculateOnClose = true.
- If signals are too delayed, decrease periods or set CalculateOnClose = false.
- Experiment with different indicator weights to emphasize reliable signals.
Step 6: Trade Live with Confidence
Once you're comfortable with the indicator's performance, transition to live trading:
- Start Small:
- Use a small position size initially to manage risk.
- Gradually increase exposure as you gain confidence.
- Combine with Risk Management:
- Use stop-loss orders to protect against unexpected reversals.
- Follow a risk-reward ratio (e.g., 1:2 or higher) to ensure profitable trades outweigh losses.
- Limit risk per trade (e.g., 1-2% of account balance).
- Monitor and Adapt:
- Regularly review the dashboard for updated signals.
- Adjust settings as market conditions change (e.g., increase weights for volatility indicators during news events).
Key Tips for Success
- Combine Signals with Context: Don't rely solely on the dashboard; use price action visuals, candlestick patterns, and market news for confirmation.
- Avoid Overtrading: Wait for strong signals (e.g., high Buy/Sell scores) to avoid false entries in choppy markets.
- Stay Disciplined: Stick to your strategy and avoid impulsive trades based on emotions.
- Leverage Customization: Tailor the indicator to your timeframe (e.g., scalping on M5, swing trading on H1) and trading style.
- Stay Informed: Understand the indicators and price action elements used by the dashboard to interpret signals accurately.
Input Parameters
The TrendMaster Dashboard offers extensive customization through its input parameters. Below are the key settings you can adjust:
General Settings
- InpYDistance (default: 185): Controls the vertical position of the dashboard on the chart.
- CalculateOnClose (default: false): If set to true, signals update only after a candle closes; if false, updates happen in real time.
- ShowBarChartRow (default: true): Adds a bar chart of Buy/Reversal/Sell scores at the bottom of the dashboard.
Indicator Periods and Levels
- InpFastMA (default: 50): Sets the period for the fast Moving Average.
- InpSlowMA (default: 200): Sets the period for the slow Moving Average.
- InpMACD_Fast (default: 12), InpMACD_Slow (default: 26), InpMACD_Signal (default: 9): Configures the MACD indicator.
- InpRSI_Period (default: 14), InpRSI_Overbought (default: 70), InpRSI_Oversold (default: 30): Defines RSI settings for identifying overbought/oversold levels.
- (Similar inputs exist for ADX, Bollinger Bands, and other indicators.)
Price Action Visualization
- InpShowVisualPA (default: true): Enables/disables trendlines, Fibonacci levels, and support/resistance on the chart.
- InpTrendlineColor (default: clrBlue): Sets the color for trendlines.
- InpFibColor (default: clrGold): Sets the color for Fibonacci retracement levels.
- InpSRColor (default: clrRed): Sets the color for support/resistance lines.
Indicator Weights
- Weight_MA (default: 1.0): Assigns importance to Moving Average signals in the scoring system.
- Weight_MACD (default: 1.0): Assigns importance to MACD signals.
- (Weights for other indicators let you emphasize your preferred signals.)
Alert Settings
- (Currently disabled, but placeholders are included for future alert features.)
Why TrendMaster Dashboard Helps You Trade Better
Input Parameters
The TrendMaster Dashboard offers extensive customization through its input parameters. Below are the key settings you can adjust:
General Settings
- InpYDistance (default: 185): Controls the vertical position of the dashboard on the chart.
- CalculateOnClose (default: false): If set to true, signals update only after a candle closes; if false, updates happen in real time.
- ShowBarChartRow (default: true): Adds a bar chart of Buy/Reversal/Sell scores at the bottom of the dashboard.
Indicator Periods and Levels
- InpFastMA (default: 50): Sets the period for the fast Moving Average.
- InpSlowMA (default: 200): Sets the period for the slow Moving Average.
- InpMACD_Fast (default: 12), InpMACD_Slow (default: 26), InpMACD_Signal (default: 9): Configures the MACD indicator.
- InpRSI_Period (default: 14), InpRSI_Overbought (default: 70), InpRSI_Oversold (default: 30): Defines RSI settings for identifying overbought/oversold levels.
- (Similar inputs exist for ADX, Bollinger Bands, and other indicators.)
Price Action Visualization
- InpShowVisualPA (default: true): Enables/disables trendlines, Fibonacci levels, and support/resistance on the chart.
- InpTrendlineColor (default: clrBlue): Sets the color for trendlines.
- InpFibColor (default: clrGold): Sets the color for Fibonacci retracement levels.
- InpSRColor (default: clrRed): Sets the color for support/resistance lines.
Indicator Weights
- Weight_MA (default: 1.0): Assigns importance to Moving Average signals in the scoring system.
- Weight_MACD (default: 1.0): Assigns importance to MACD signals.
- (Weights for other indicators let you emphasize your preferred signals.)
Alert Settings
- (Currently disabled, but placeholders are included for future alert features.)
The TrendMaster Dashboard removes the guesswork from trading by providing a consolidated view of market trends and reversals. Its weighted scoring system simplifies complex data, while customizable settings ensure it fits your unique strategy. Whether you're trend-following, reversal trading, or range trading, this indicator empowers you to make informed, confident decisions.