TickChartOscillator

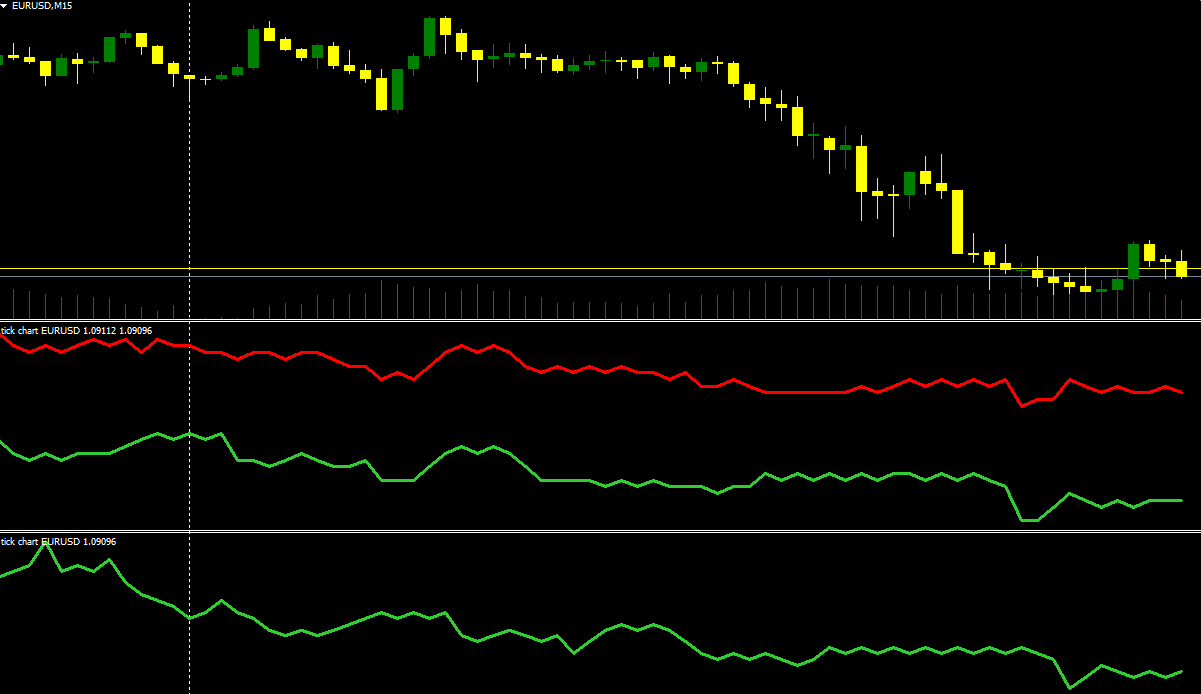
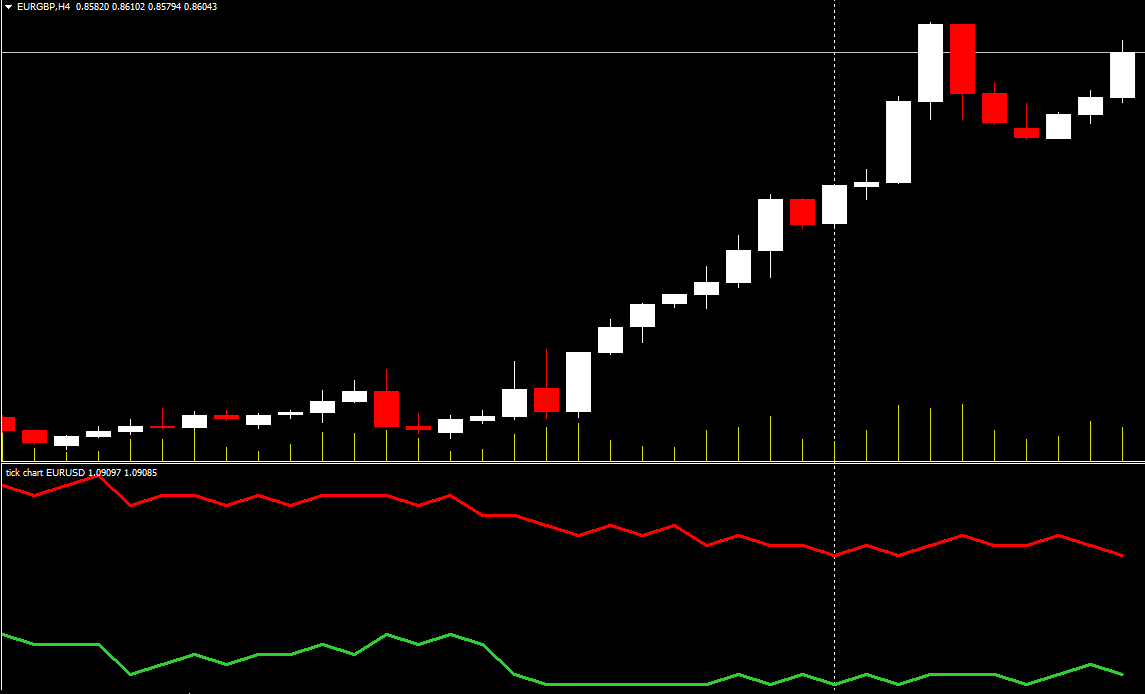
TickChartOscillator è un indicatore che visualizza un grafico a tick di un simbolo nella sottofinestra dell'oscillatore.

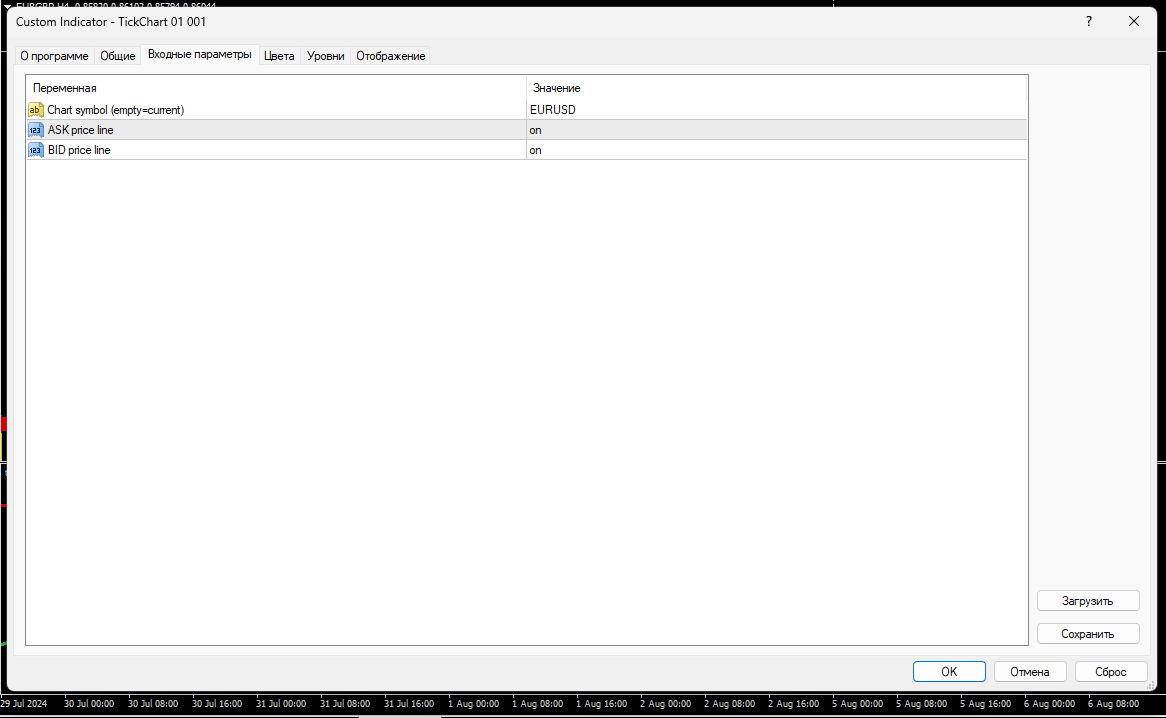
Offre impostazioni flessibili per la personalizzazione:

- La possibilità di disabilitare la visualizzazione della linea del prezzo nell'oscillatore.

- La possibilità di specificare un simbolo diverso da cui trasmettere il grafico tick.

Se il parametro "Symbol" viene lasciato vuoto, il grafico a tick verrà visualizzato per il simbolo corrente su cui è impostato l'indicatore.

Questo strumento è ideale per i trader che desiderano vedere la dinamica dei tick in formato oscillatore e utilizzarla per analizzare e prendere decisioni di trading.
Prodotti consigliati
Free automatic Fibonacci is an indicator that automatically plots a Fibonacci retracement based on the number of bars you select on the BarsToScan setting in the indicator. The Fibonacci is automatically updated in real time as new highest and lowest values appears amongst the selected bars. You can select which level values to be displayed in the indicator settings. You can also select the color of the levels thus enabling the trader to be able to attach the indicator several times with differe
FREE
This indicator will mirror the assets in use in another metatrader, being able to choose the timeframe and a template. This is the Metatrader 4 Client, it needs the Metatrader 4 or 5 Server versions: Metatrader 4 Mirror Chart Server: https://www.mql5.com/en/market/product/88644 Metatrader 5 Mirror Chart Server:   https://www.mql5.com/en/market/product/88652 Details of how it works in the video.
FREE
The indicator displays price distribution on a horizontal histogram. Horizontal histogram help find out key levels of price so that you can make good decision on setting point of take profit, stop loss... You can improve exist trading strategy or get new trading idea with the histogram of price. Outstanding features Support multiple time frame : you can choose to work with history data in any time frame you want. It does not depend on current display time frame. Support weighting by volume and/
FREE
Easy Pips Maker
Andrei Gerasimenko
4 (4)
The recommended timeframe is H1! The indicator has two kinds of signal. This is a signal to open a position from the appearance of an arrow. The price leaves the channel In the first case, the indicator builds arrows based on the constructed channel and Bollinger Bands years. In another case, the trader can trade if the price just went beyond the channel. If the price is higher than the channel - we sell. If the price is lower than the channel, then you can look for a place to buy. It can al
FREE
Show Pips
Roman Podpora
4.26 (58)
Questo indicatore informativo sarà utile per coloro che vogliono essere sempre informati sulla situazione attuale del conto. L'indicatore mostra dati come profitto in punti, percentuale e valuta, nonché lo spread per la coppia corrente e il tempo fino alla chiusura della barra nell'intervallo di tempo corrente. VERSIONE MT5 -   Indicatori più utili Esistono diverse opzioni per posizionare la linea delle informazioni sulla carta: A destra del prezzo (corre dietro al prezzo); Come commento (nell'
FREE
StrikePin
Mike Pascal Plavonil
1 (1)
The StrikePin indicator is a technical, analytical tool designed to identify trend reversals and find optimal market entries.  The StrikePin indicator is based on the pin bar pattern, which is the Price Action reversal pattern. An entry signal, in a trending market, can offer a very high-probability entry and a good risk to reward scenario. Be careful: the indicator is repainting since it is looking for highest high and lowest lows.  You should avoid to use it in experts but you can use it in
FREE
PZ Penta O MT4
PZ TRADING SLU
2.33 (3)
The Penta-O is a 6-point retracement harmonacci pattern which usually precedes big market movements. Penta-O patterns can expand and repaint quite a bit. To make things easier this indicator implements a twist: it waits for a donchian breakout in the right direction before signaling the trade. The end result is an otherwise repainting indicator with a very reliable trading signal. The donchian breakout period is entered as an input. [ Installation Guide | Update Guide | Troubleshooting | FAQ | A
FREE
Wise Men Indicator demo
Bohdan Kasyanenko
3 (2)
The indicator displays signals according to the strategy of Bill Williams on the chart. Demo version of the indicator has the same features as the paid, except that it can work only on a demo account . Signal "First Wise Man" is formed when there is a divergent bar with angulation.  Bullish divergent bar - with lower minimum and closing price in the upper half. Bearish divergent bar - higher maximum and the closing price at the bottom half. Angulation is formed when all three lines of Alligator
FREE
Persian Ichimoku: The Next Generation of Fibonacci-Enhanced Trading Elevate your Ichimoku strategy with the most advanced and customizable Ichimoku indicator on the Market. The Persian Ichimoku is not just another Ichimoku cloner; it is a professional-grade trading powerhouse designed for traders who demand precision, flexibility, and deeper market insights. By merging classic Ichimoku Kinko Hyo logic with Fibonacci ratios and the innovative Quality Line , this tool redefines trend analysis. ###
Follow The Line
Oliver Gideon Amofa Appiah
3.94 (16)
FOLLOW THE LINE GET THE FULL VERSION HERE: https://www.mql5.com/en/market/product/36024 This indicator obeys the popular maxim that: "THE TREND IS YOUR FRIEND" It paints a GREEN line for BUY and also paints a RED line for SELL.  It gives alarms and alerts of all kinds. IT DOES NOT REPAINT and can be used for all currency pairs and timeframes. Yes, as easy and simple as that. Even a newbie can use it to make great and reliable trades. NB: For best results, get my other premium indicators for more
FREE
Extremum Reverse Bar
Yurij Izyumov
2.8 (5)
This indicator has been created for finding the probable reversal points of the symbol price. A small candlestick reversal pattern is used it its operation in conjunction with a filter of extremums. The indicator is not redrawn! If the extremum filter is disabled, the indicator shows all points that have a pattern. If the extremum filter is enabled, the condition works – if the history Previous bars 1 candles back contains higher candles and they are farther than the Previous bars 2 candle, such
FREE
The Analytical cover trend indicator is a revolutionary trend trading and filtering solution with all the important features of a trend tool built into one tool! The Analytical cover indicator is good for any trader, suitable for any trader for both forex and binary options. You don’t need to configure anything, everything is perfected by time and experience, it works great during a flat and in a trend. The Analytical cover trend indicator is a tool for technical analysis of financial markets
Donchian channels are a tool in technical analysis used to determine the relative volatility of a market and the potential for price breakouts. Can help identify potential breakouts and reversals in price, which are the moments when traders are called on to make strategic decisions. These strategies can help you capitalize on price trends while having pre-defined entry and exit points to secure gains or limit losses. Using the Donchian channel can thus be part of a disciplined approach to managi
FREE
Il Matrix Arrow Indicator Multi Timeframe Panel MT4 è un componente aggiuntivo gratuito e una grande risorsa per il tuo Matrix Arrow Indicator MT4 . Mostra l'attuale segnale Matrix Arrow Indicator MT4 per 5 timeframe personalizzati dall'utente e per 16 simboli/strumenti modificabili in totale. L'utente ha la possibilità di abilitare/disabilitare uno qualsiasi dei 10 indicatori standard di cui è composto il Matrix Arrow Indicator MT4 . Anche tutti i 10 attributi degli indicatori standard sono re
FREE
High Low Open Close MT4
Alexandre Borela
4.81 (21)
Se ti piace questo progetto, lascia una recensione a 5 stelle. Questo indicatore disegna i prezzi aperti, alti, bassi e di chiusura per i specificati periodo e può essere regolato per un determinato fuso orario. Questi sono livelli importanti guardati da molti istituzionali e professionali commercianti e può essere utile per voi per conoscere i luoghi dove potrebbero essere più attivo. I periodi disponibili sono: Giorno precedente. Settimana precedente. Mese precedente. Precedente trimestre. A
FREE
Comb
Iurii Tokman
The indicator displays a grid in the form of a "honeycomb" or regular hexagon. An alternative to the standard grid of the terminal. Description of the indicator settings: color_comb - grid color width - width, for example: 22 for a screen resolution of 1920*1080, 15 for a screen resolution of 1366*768, etc. height - height, for example: 6 for a screen resolution of 1920*1080, 4 for a screen resolution of 1366*768, etc.
FREE
OrderBlock TS Roman
Vladislav Vlastovskii
3.8 (5)
Индикатор строит блоки заказов (БЗ) по торговой системе (ТС) Романа. Поиск блоков осуществляется одновременно на двух таймфремах: текущем и старшем (определяемым в настройках). Для оптимизации и игнорирования устаревших блоков в настройках задается ограничение количества дней в пределах которых осуществляется поиск блоков. Блоки строятся по правилам ТС состоящем из трех шагов: какую свечу вынесли (что?); какой свечой вынесли (чем?); правило отрисовки (как?).
FREE
Fibomathe for MT4
Almaquio Ferreira De Souza Junior
Fibomathe Indicator: Support and Resistance Tool for MT4 The Fibomathe Indicator is a technical analysis tool designed for MetaTrader 4 (MT4) that assists traders in identifying support and resistance levels, take-profit zones, and additional price projection areas. It is suitable for traders who use structured approaches to analyze price action and manage trades. Key Features Support and Resistance Levels: Allows users to define and adjust support and resistance levels directly on the chart. L
FREE
HMA Trend
Pavel Zamoshnikov
4.55 (71)
A trend indicator based on the Hull Moving Average (HMA) with two periods. The Hull Moving Average is an improved variant of the moving average, which shows the moment of trend reversal quite accurately. It is often used as a signal filter. Combination of two types of Hull Moving Averages makes a better use of these advantages: HMA with a slow period identifies the trend, while HMA with a fast period determines the short-term movements and signals in the trend direction. Features The movement d
FREE
The Mode
Naim El Hajj
3.67 (3)
The M.O.D.E stands for " Multiple Oscillator Divergence Exit ". It is an indicator which signals a divergence between the price, and multiple oscillators. It is initially an exit indicator because it signals the weakening of a trend, but it could be used as an entry signal if used analytically Key Features: Check many divergences at once Non repainting Sends   Alerts and Push Notifications You could load the M.O.D.E onto a single chart, and be able to see the divergences happening on multiple os
FREE
Wave Reversal Indicator - determina la direzione e le inversioni di prezzo attorno alla linea di equilibrio. L'indicatore mostra i movimenti delle onde e i picchi di tendenza. Dà consigli su dove seguire il trader, aiuta a seguire la strategia di trading. È un'aggiunta a una strategia intraday o a medio termine. Quasi tutti i parametri vengono selezionati per ciascun intervallo di tempo e cambiano automaticamente; l'unico parametro per la regolazione manuale è la lunghezza d'onda. Tempi ottimal
FREE
Traditional MACD MT4
Daniel Lewis
4.58 (55)
MACD indicator in MetaTrader 4/5 looks different than MACD does in most other charting software. That is because the MetaTrader 4/5 version of MACD displays the MACD line as a histogram when it is traditionally displayed as a line. Additionally, the MetaTrader 4/5 version computes the Signal line using an SMA, while according to MACD definition it is supposed to be an EMA. The MetaTrader 4/5 version also does not compute a true MACD Histogram (the difference between the MACD/Signal lines). This
FREE
KeltnerChannelIndicator
Todd Terence Bates
3 (2)
The Keltner Channel is a volatility-based technical indicator composed of three separate lines. The middle line is an exponential moving average (EMA) of the price. Additional lines are placed above and below the EMA. The upper band is typically set two times the Average True Range (ATR) above the EMA, and the lower band is typically set two times the ATR below the EMA. The bands expand and contract as volatility (measured by ATR) expands and contracts. Since most price action will be encompasse
FREE
Candle Countdown — Tempo preciso fino alla chiusura della candela per MT4 Candle Countdown è uno strumento semplice e preciso che mostra il tempo rimanente fino alla chiusura della candela corrente direttamente sul grafico. Quando l’ingresso dipende dalla chiusura della candela, anche pochi secondi possono fare la differenza. Questo indicatore ti permette di vedere il tempo esatto e prendere decisioni senza fretta o supposizioni. Un indicatore per il controllo preciso della chiusura della cande
FREE
GS spread
Aleksander Gladkov
The indicator calculates the current spread for each tick using the formula Spread=(ASK-BID)/Point. Schedule of changes in the boundaries spread over the timeframe displayed in a separate window from the date of accession of the indicator. Two lines corresponding to the minimum and maximum spread values are displayed. The indicator window is self-adjusted according to the minimum and maximum values from the moment of launch. The minimum and maximum values for the entire period of the indicator o
FREE
Hma Vvm Hull
Valerij Mazurenko
Hma Vvm Hull è un indicatore professionale per lavorare in qualsiasi mercato, è particolarmente efficace quando si fa trading di coppie di valute, mostra le prime tendenze per cambiare la tendenza. L'indicatore ha molte impostazioni che ti consentono di usarlo con successo con vari metodi di trading e strategie di trading. È possibile installare più indicatori con parametri diversi su un grafico. Una varietà di avvisi personalizzabili consente al trader di controllare sempre la situazione del m
Cumulative Delta MT4
Evgeny Shevtsov
4.86 (29)
The indicator analyzes the volume scale and splits it into two components - seller volumes and buyer volumes, and also calculates the delta and cumulative delta. The indicator does not flicker or redraw, its calculation and plotting are performed fairly quickly, while using the data from the smaller (relative to the current) periods. The indicator operation modes can be switched using the Mode input variable: Buy - display only the buyer volumes. Sell - display only the seller volumes. BuySell -
FREE
Triple RSI
Pablo Leonardo Spata
1 (1)
LOOK AT THE FOLLOWING STRATEGY WITH THIS INDICATOR. Triple RSI is a tool that uses the classic Relative Strength Indicator, but in several timeframes to find market reversals.    1.  ️ Idea behind the indicator and its strategy: In Trading, be it Forex or any other asset, the ideal is to keep it simple, the simpler the better . The triple RSI strategy is one of the simple strategies that seek market returns. In our experience, where there is more money to always be won, is in the marke
FREE
Toby Strategy Indicator
Ahmd Sbhy Mhmd Ahmd ʿYshh
The indicator rely on The Toby strategy >> The mother candle which is bigger in range than the previous six candles. A vertical line shows the last Toby Candle with the targets shown up and down. The strategy is about the closing price out of the range of the toby candle to reach the 3 targets..The most probable to be hit is target1 so ensure reserving your profits and managing your stop lose.
FREE
TCL Super Trend
Stratos Digital (PVT) Ltd
TCL Super Trend is a trend-following indicator for MetaTrader 4. It plots a SuperTrend line, ATR-adaptive volatility bands, trend-change arrows, and an on-chart dashboard panel. HOW THE ENGINE WORKS Most SuperTrend indicators use a single Average True Range (ATR) multiplier to place a line above or below price. TCL Super Trend uses a dual-logic state machine that tracks both the highest lows and the lowest highs within a configurable lookback window, called Amplitude. A trend reversal is con
FREE
Gli utenti di questo prodotto hanno anche acquistato
Gann Made Easy
Oleg Rodin
4.83 (162)
Gann Made Easy è un sistema di trading Forex professionale e facile da usare che si basa sui migliori principi del trading utilizzando la teoria di mr. WD Gann. L'indicatore fornisce segnali ACQUISTA e VENDI accurati, inclusi i livelli di Stop Loss e Take Profit. Puoi fare trading anche in movimento utilizzando le notifiche PUSH. CONTATTAMI DOPO L'ACQUISTO PER RICEVERE GRATUITAMENTE LE ISTRUZIONI DI TRADING E OTTIMI INDICATORI EXTRA! Probabilmente hai già sentito parlare molte volte dei metodi d
Genesis Matrix Pro is a professional multi-timeframe trend detection indicator designed to help traders identify high-quality market alignment with clarity and structure. It combines 12 different technical indicators into one visual alignment matrix, allowing traders to quickly see when market conditions are bullish, bearish, or neutral. A signal is generated only when the selected strategies are aligned, helping reduce noise and improve decision-making. PLEASE CONTACT ME AFTER PURCHASE TO GET
The Propfolio Master Suite is the ultimate all-in-one analytical workstation for professional traders. Combining the power of the Beat The Market Maker (BTMM) methodology, Smart Money Concepts (SND/Liquidity), and Advanced Volume Profile, this suite replaces multiple different indicators with one optimized engine. Monitor up to 14 pairs simultaneously from a single chart, instantly identify market cycles, and seamlessly map institutional footprints with the click of a button. The Command Center
Scalper Inside PRO
Alexey Minkov
4.74 (69)
Scalper Inside PRO Scalper Inside PRO is an intraday trend and scalping indicator for MetaTrader 4 that uses an exclusive algorithm to quickly detect market direction and key target levels. It automatically calculates entry, exit and multiple profit targets, and shows detailed performance statistics so you can see how different instruments and strategies performed. This helps you choose the most suitable trading instruments for the current market conditions. Additionally, you can easily integrat
M1 Sniper
Oleg Rodin
5 (23)
M1 SNIPER è un sistema di indicatori di trading facile da usare. Si tratta di un indicatore a freccia progettato per l'intervallo temporale M1. L'indicatore può essere utilizzato come sistema autonomo per lo scalping sull'intervallo temporale M1 e come parte del tuo sistema di trading esistente. Sebbene questo sistema di trading sia stato progettato specificamente per il trading sull'intervallo temporale M1, può comunque essere utilizzato anche con altri intervalli temporali. Inizialmente ho pro
PZ Harmonacci Patterns
PZ TRADING SLU
3.17 (6)
Trade smarter, not harder: Empower your trading with Harmonacci Patterns This is arguably the most complete harmonic price formation auto-recognition indicator you can find for the MetaTrader Platform. It detects 19 different patterns, takes fibonacci projections as seriously as you do, displays the Potential Reversal Zone (PRZ) and finds suitable stop-loss and take-profit levels. [ Installation Guide | Update Guide | Troubleshooting | FAQ | All Products  ] It detects 19 different harmonic pric
PRO Renko System
Oleg Rodin
5 (30)
PRO Renko System è un sistema di trading altamente accurato appositamente progettato per il trading di grafici RENKO. Questo è un sistema universale che può essere applicato a vari strumenti di trading. Il sistema neutralizza efficacemente il cosiddetto rumore di mercato che consente di accedere a segnali di inversione accurati. L'indicatore è molto facile da usare e ha un solo parametro responsabile della generazione del segnale. Puoi facilmente adattare lo strumento a qualsiasi strumento di
Auto Optimized Parabolic RSI: Motore di Momentum 3D Avanzato La maggior parte degli indicatori per trader privati fallisce perché si affida a parametri statici che smettono di funzionare nel momento in cui la volatilità del mercato cambia. Auto Optimized Parabolic RSI risolve il problema dell'"obsolescenza dell'indicatore" ricalcolando continuamente il proprio vantaggio matematico, portando un adattamento quantitativo di livello istituzionale direttamente sul tuo terminale MT5. Il Vantaggio Prin
NAM Order Blocks
NAM TECH GROUP, CORP.
3.67 (3)
MT4 Multi-timeframe Order Blocks detection indicator. Features - Fully customizable on chart control panel, provides complete interaction. - Hide and show control panel wherever you want. - Detect OBs on multiple timeframes. - Select OBs quantity to display. - Different OBs user interface. - Different filters on OBs. - OB proximity alert. - ADR High and Low lines. - Notification service (Screen alerts | Push notifications). Summary Order block is a market behavior that indicates order collection
Quants HL Break
Ferhat Mutlu
5 (2)
Calcolo avanzato fatto da pura azione sui prezzi per trovare breakout LH e HL. Ti darà un grande punto di inversione nel mercato.I segnali LH e HL possono essere utilizzati anche per i breakout di traingle. Una volta che si verifica un breakout, indica una forte inversione.Bel filtro per le medie mobili.Consiglio vivamente di usarlo con gli indicatori di tendenza. Può essere utilizzato come ulteriore conferma per supporto e resistenza, indicatori della domanda di offerta. Maggiori dettagli po
Dynamic Forex28 Navigator
Bernhard Schweigert
4.43 (7)
Dynamic Forex28 Navigator - Lo strumento di trading Forex di nuova generazione. ATTUALMENTE SCONTATO DEL 49%. Dynamic Forex28 Navigator è l'evoluzione dei nostri indicatori popolari di lunga data, che combinano la potenza di tre in uno: Advanced Currency Strength28 Indicator (695 recensioni) + Advanced Currency IMPULSE con ALERT (520 recensioni) + CS28 Combo Signals (Bonus). Dettagli sull'indicatore https://www.mql5.com/en/blogs/post/758844 Cosa offre l'indicatore di forza di nuova generazione?
RFI levels PRO
Roman Podpora
5 (1)
L'indicatore mostra accuratamente i punti di inversione e le zone di ritorno dei prezzi in cui il       Principali attori   . Vedi dove si formano le nuove tendenze e prendi decisioni con la massima precisione, mantenendo il controllo su ogni operazione. VERSION MT5     -     Rivela il suo massimo potenziale se combinato con l'indicatore   TREND LINES PRO Cosa mostra l'indicatore: Strutture di inversione e livelli di inversione con attivazione all'inizio di un nuovo trend. Visualizzazione dei l
Trend Catcher ind
Ramil Minniakhmetov
INDICATORE TREND CATCHER L'indicatore Trend Catcher analizza i movimenti dei prezzi di mercato, utilizzando una combinazione di indicatori di analisi del trend proprietari dell'autore e personalizzati. Identifica la vera direzione del mercato filtrando il rumore a breve termine e concentrandosi sulla forza del momentum sottostante, sull'espansione della volatilità e sul comportamento della struttura dei prezzi. Utilizza inoltre una combinazione di indicatori personalizzati di smoothing e filtr
Apollo SR Master è un indicatore di Supporto/Resistenza con caratteristiche speciali che rendono il trading con le zone di Supporto/Resistenza più semplice e affidabile. L'indicatore calcola le zone di Supporto/Resistenza in tempo reale senza alcun ritardo, rilevando i massimi e i minimi dei prezzi locali. Quindi, per confermare la nuova area SR formata, l'indicatore mostra un segnale speciale che segnala che la zona SR può essere presa in considerazione e utilizzata come un vero e proprio segna
Se acquisti questo indicatore, riceverai il mio Trade Manager Professionale   + EA  GRATUITAMENTE. Innanzitutto è importante sottolineare che questo sistema di trading è un indicatore Non-Repainting, Non-Redrawing e Non-Lagging, il che lo rende ideale sia per il trading manuale che per quello automatico. Corso online, manuale e download di preset. Il "Sistema di Trading Smart Trend MT5" è una soluzione completa pensata sia per i trader principianti che per quelli esperti. Combina oltre 10 indic
Segnale GoldRush Trend Arrow L'indicatore GoldRush Trend Arrow Signal fornisce un'analisi precisa e in tempo reale dei trend, pensata appositamente per gli scalper ad alta velocità e a breve termine nel mercato XAU/USD. Progettato specificamente per il timeframe di 1 minuto, questo strumento mostra frecce direzionali che indicano chiari punti di ingresso, consentendo agli scalper di navigare con sicurezza nelle condizioni di mercato volatili. L'indicatore è composto da frecce di avviso PRIMA
Introduction to Fractal Pattern Scanner Fractal Indicator refers to the technical indicator that makes use of the fractal geometry found in the financial market. Fractal Pattern Scanner is the advanced Fractal Indicator that brings the latest trading technology after the extensive research and development work in the fractal geometry in the financial market. The most important feature in Fractal Pattern Scanner is the ability to measure the turning point probability as well as the trend probabi
ATTUALMENTE SCONTATO DEL 40% La soluzione migliore per ogni principiante o trader esperto! Questo indicatore è uno strumento di trading unico, di alta qualità e conveniente perché abbiamo incorporato una serie di caratteristiche proprietarie e una nuova formula. Con un solo grafico è possibile leggere la forza delle valute per 28 coppie Forex! Immaginate come migliorerà il vostro trading perché sarete in grado di individuare l'esatto punto di innesco di una nuova tendenza o di un'opportunità
Market Structure Patterns MT4
Samuel Manoel De Souza
5 (18)
Market Structure Patterns   è un indicatore basato sui   Smart Money Concepts   che mostra gli   elementi SMC/ICT   che possono portare le tue decisioni di trading a un livello superiore. Approfitta di   alert ,   notifiche push   e   email   per essere avvisato quando si forma un elemento sul grafico, il prezzo supera un livello e/o entra in una zona. Gli sviluppatori possono accedere ai valori degli elementi dell’indicatore utilizzando le   variabili globali , consentendo l’automazione delle d
Advanced Supply Demand
Bernhard Schweigert
4.91 (300)
Speciale Trading- SCONTO DEL 40% La soluzione migliore per qualsiasi trader principiante o esperto! Questo indicatore è uno strumento di trading unico, di alta qualità e conveniente, perché abbiamo incorporato una serie di funzionalità proprietarie e una nuova formula. Con questo aggiornamento, potrai visualizzare doppie zone di timeframe. Non solo potrai visualizzare un TF più alto, ma anche entrambi, il TF del grafico e il TF più alto: MOSTRA ZONE ANNIDATE. Tutti i trader che operano con Of
Advanced UT BOT ALERTS for MT4 Sistema professionale di rilevamento del trend con filtri multipli | Motore UT BOT potenziato Forniamo solo indicatori di alta qualità. Advanced UT BOT è progettato per uso professionale, con una logica di segnale stabile e un processo di calcolo sicuro che evita ritardi o aggiornamenti errati. Non ridisegna, rimuove o modifica i segnali passati. Tutti i segnali BUY e SELL vengono generati solo dopo la chiusura della candela e restano fissi. Nel trading in tempo re
Contattami dopo l'acquisto per ottenere un EA bonus basato su questo indicatore. La Self Optimizing Double MA Strategy è uno strumento di trading di livello professionale progettato per eliminare le congetture sui parametri. Alimentato da un motore di auto-ottimizzazione integrato, si adatta continuamente alle mutevoli condizioni di mercato simulando migliaia di combinazioni di parametri in background per mantenere un vantaggio statistico. Invece di fare affidamento su impostazioni statiche e o
Se fai trading nel Forex, avere informazioni dettagliate sulla forza delle valute e sulla correlazione tra coppie di valute può portare il tuo trading a un livello superiore. La correlazione ti aiuterà a dimezzare il rischio, mentre l'analisi della forza ti permetterà di massimizzare i profitti. Questo indicatore offre un approccio ibrido per selezionare le coppie di valute più appropriate, combinando l'analisi della forza delle valute e la correlazione tra coppie di valute. Come utilizzare l'a
CRT Candle Range Theory HTF MT4.   Ultimate CRT Indicator: Advanced ICT Concepts and Malaysian SnR Trading System Discounted   Price   $50  !!     Secure your lifetime access   now   before it switches to   subscription-only ! Master the Market Maker's Footprints with the Most Advanced Candle Range Theory Indicator Unlock the true power of   Smart Money Concepts (SMC)   and trade precisely like the institutions with the   Ultimate CRT Indicator . Built exclusively for serious traders, this indic
Day Trader Master è un sistema di trading completo per i day trader. Le systeme se compose de due indicatori. Un indicar est un signal fléché pour acheter et vendre. C'est l'indicateur de fleche que vous obtenez. Je vous fournirai le deuxième indicaur gratuitement. Le deuxième indicaur è un indicaur de tendance spécialement conçu pour être utilisé conjointement avec ces flèches. GLI INDICATORI NON SI RIPETONO E NON RITARDANO! Usare questo sistema è molto semplice. Devi solo seguire i segnali del
KURAMA GOLD SIGNAL PRO (MT4) — Sistema di Trading XAUUSD Completo con Filtro a 7 Strati, TP/SL Automatico e Punteggio di Qualità NESSUN REPAINT. NESSUN RIDISEGNO. NESSUN RITARDO. Ogni segnale è permanente. Ciò che vedi è ciò che ottieni. BONUS: Acquista la licenza a vita e ricevi AI Zone Radar (valore $59) + manuale PDF completo GRATIS. Inviami un messaggio dopo l'acquisto. AI Zone Radar: https://www.mql5.com/en/market/product/175834 FIDUCIA DEI TRADER: Già utilizzato da una community attiva
L'indicatore " Dynamic Scalper System " è progettato per il metodo di scalping, ovvero per il trading all'interno di onde di trend. Testato sulle principali coppie di valute e sull'oro, è compatibile con altri strumenti di trading. Fornisce segnali per l'apertura di posizioni a breve termine lungo il trend, con ulteriore supporto al movimento dei prezzi. Il principio dell'indicatore. Le frecce grandi determinano la direzione del trend. Un algoritmo per generare segnali per lo scalping sotto fo
Master head and shoulders patterns for better trading decisions A head and shoulders pattern is a chart formation that resembles a baseline with three peaks, the outside two are close in height and the middle is highest. It predicts a bullish-to-bearish trend reversal and is believed to be one of the most reliable trend reversal patterns. It is one of several top patterns that signal, with varying degrees of accuracy, that a trend is nearing its end. [ Installation Guide | Update Guide | Trouble
PZ Double Top Bottom
PZ TRADING SLU
5 (1)
Trade double tops and bottoms effectively The PZ Double Top/Bottom Indicator is a technical analysis tool that helps traders identify potential price reversal patterns in the market. These patterns, known as double tops and bottoms, are characterized by two consecutive peaks or valleys in the price of an asset. Double tops and bottoms are often seen as potential reversal patterns because they can signal a change in the direction of the current trend. [ Installation Guide | Update Guide | Troubl
Apex Break PRO MT4
Kestutis Balciunas
Apex Break PRO è un indicatore di rottura di linee di tendenza su pivot non ridisegnante per MetaTrader 4. Rileva massimi di pivot e minimi di pivot, traccia linee di tendenza dinamiche inclinate tra pivot consecutivi e genera segnali di acquisto e vendita quando il prezzo rompe quelle linee di tendenza alla chiusura confermata di una candela. Ogni segnale viene filtrato attraverso fino a quattro strati di confluenza indipendenti — tendenza EMA, limiti RSI, rilevamento di picchi di volume e forz
Altri dall’autore
SpectorMA
Sergii Krasnyi
5 (1)
Vi presentiamo un indicatore che non solo migliora l'aspetto visivo del grafico, ma gli conferisce anche un carattere vivace e dinamico. Il nostro indicatore è una combinazione di uno o più indicatori di media mobile (MA) che cambiano costantemente colore, creando un aspetto interessante e colorato. Questo prodotto è una soluzione grafica, quindi è difficile descrivere ciò che fa nel testo, è più facile vederlo scaricandolo, inoltre il prodotto è gratuito. Questo indicatore è adatto ai blogger
FREE
ZoomChart
Sergii Krasnyi
The ZoomChart indicator displays data from other timeframes on the current chart in the subwindow, acting as a magnifying glass or, conversely, shrinking the chart to display larger timeframes. The ZoomChar indicator automatically tracks the current outermost bar on the chart and moves with the chart as it shifts. The indicator can display data from another financial instrument, not limited to the main chart instrument. The robot carries the function of “mirroring” - The ability to convert c
FREE
Questo indicatore è stato progettato per la creazione comoda e veloce di screenshot dei grafici nel terminale di trading. Semplifica notevolmente il processo di salvataggio dei grafici in una determinata directory, fornendo una comoda interfaccia con un pulsante sul grafico, che si attiva con un solo clic. Le funzioni principali dell'indicatore sono: Creazione automatica di uno screenshot del grafico quando viene premuto il pulsante. Possibilità di selezionare una directory per il salvataggio
FREE
ChartOverlay
Sergii Krasnyi
ChartOverlay indicator has two main functions 1. mirroring - i.e. for example, it will make USDEUR from EURUSD 2. displaying the price chart of the selected financial instrument (with selected period)  in the subwindow of the main chart. This tool allows traders to easily analyze the relationship between different currency pairs and assets, offering unique customization and visualization features. Key Features: Price Chart Display: The indicator displays the price chart of the selected instrume
FREE
ZoomChart2
Sergii Krasnyi
L'indicatore ZoomChart funziona con due grafici: quello corrente su cui viene lanciato e quello successivo. L'indicatore traduce il secondo grafico nel momento in cui si trova il primo. In questo modo, il secondo grafico rappresenta la stessa situazione del primo grafico (in cui viene lanciato l'indicatore), ma su un arco temporale diverso. In altre parole, questo indicatore funge da lente di ingrandimento o, al contrario, riduce il grafico per visualizzare la situazione su un arco temporale pi
FREE
Questo indicatore semplifica il processo di creazione dei modelli di grafico, consentendo di salvare le impostazioni correnti del grafico in un modello con un solo clic su un pulsante. L'indicatore aggiunge un pulsante direttamente sul grafico che salva automaticamente il modello con un determinato nome e prefisso, facilitando l'organizzazione e l'utilizzo dei modelli. Le funzioni principali dell'indicatore sono: Creazione di un modello del grafico corrente con un solo clic sul pulsante. Poss
FREE
SpreadChartOscillator è un indicatore che visualizza la spread line del simbolo nella sottofinestra dell'oscillatore. Nei parametri è possibile specificare un altro simbolo da cui verrà trasmessa la spread line. Se il parametro "Symbol" viene lasciato vuoto, la spread line verrà visualizzata dal simbolo corrente su cui è impostato l'indicatore. Questo strumento è ideale per i trader che desiderano vedere la dinamica dello spread nel formato dell'oscillatore e utilizzarlo per proteggersi dall'in
FREE
SpectorChart
Sergii Krasnyi
Questo indicatore modifica continuamente il colore dei bordi e dei corpi delle candele, nonché il colore dei volumi in tempo reale. L'indicatore è facile da usare. La tavolozza dei colori è varia. Questo prodotto è una soluzione grafica, quindi è difficile descrivere ciò che fa tramite testo, è più facile vederlo scaricandolo, inoltre il prodotto è gratuito. L'indicatore è adatto ai blogger che vogliono creare una bella immagine di un grafico per l'editing video o ai trader che vogliono rendere
FREE
Filtro:
Maxim Bazuev
321
Maxim Bazuev 2024.09.20 08:35 
 

L'utente non ha lasciato alcun commento sulla valutazione.

Rispondi alla recensione