 MetaTrader 5
 Experts
 Indicatori
 librerie
 Utilità
 Widget
 Regole
Guarda i video tutorial del Market su YouTube
Come acquistare un Robot di Trading o un indicatore
Esegui il tuo EA
hosting virtuale
hosting virtuale
Prova un indicatore/robot di trading prima di acquistarlo
Vuoi guadagnare nel Market?
Come presentare un prodotto per venderlo con successo
Indicatori tecnici a pagamento per MetaTrader 5 - 79
 I segnali degli indicatori tecnici giocano un ruolo cruciale nell'apertura e nella chiusura delle transazioni sui mercati azionari e Forex. L'essenza degli indicatori è una trasformazione matematica del prezzo di un simbolo finanziario, finalizzata alla previsione dei cambiamenti futuri dei prezzi. Prova gli indicatori tecnici, per prevedere al meglio il comportamento del mercato e ricavarne dei guadagni.
CycleTrackSwingPro per MetaTrader 5 ️ SI PREGA DI ESAMINARE ATTENTAMENTE L’IMMAGINE ALLEGATA PRIMA DI LEGGERE LE INFORMAZIONI DETTAGLIATE QUI SOTTO. I. Panoramica Generale La maggior parte delle perdite nelle configurazioni di trading deriva da una scarsa comprensione del CONTESTO DEL MERCATO (CONTEXT) e della sua ENERGIA LATENTE (ENERGY) . CycleTrackSwingPro è stato progettato con una STRUTTURA ROBUSTA (FRAMEWORK) per colmare queste lacune critiche. L'indicatore allinea le decisioni di trading

MarketCrack – Whale Detector: Allineati con il Denaro Intelligente MarketCrack – Whale Detector è un indicatore professionale progettato per rilevare visivamente e in anticipo l'attività dei grandi partecipanti al mercato, noti come "balene". Il suo scopo è identificare i momenti chiave di significativa pressione istituzionale, consentendo al trader di allinearsi con la direzione del denaro intelligente e prendere decisioni strategiche con maggiore fiducia. Funzionalità e Obiettivo MarketCrack –

Advanced MT5 Indicator: Precision-Powered with Pivot Points, MAs & Multi-Timeframe Logic Unlock the full potential of your trading strategy with this precision-engineered MetaTrader 5 indicator —an advanced tool that intelligently blends Pivot Points , Adaptive Moving Averages , and Multi-Timeframe Analysis to generate real-time Buy and Sell signals with high accuracy. If you want to test on Real Market, Let me know. I will give the Demo file to run on Real Account.
Whether you're a scal
Oscillator Alerts MultiPanel All oscillator signals — in a single panel!
A professional multi-panel tool for market control, based on major oscillators with a flexible alert system and unique interactive management features. Description Oscillator Alerts MultiPanel is an innovative tool for traders that brings together multi-symbol and multi-timeframe analysis, flexible notifications, and the most convenient interactive control — all right on your chart. Key Advantages Interactive Oscillator Se

Zephir Power Indicator v1.30 — Breakout Signal & Statistics Tool for MetaTrader 5
Full strategy Guide on purchase - Trader with track record and 8 years of experience EXTRA COPY FOR TRADING VIEW FOR THIS INDICATOR
Zephir Power Indicator v1.30 is a high-performance breakout detection tool for MT5 that identifies precise bullish and bearish entry points based on candle body breakouts, ATR filters, and optional trend confirmation. Designed for professional traders, this indicator visuall
Trader Dynamic Index_Pro Segnale Aggiunto
Una versione migliorata dell’indicatore Traders Dynamic Index con integrazione di segnali contestuali, conferma multilivello e sincronizzazione con il ritmo del mercato. Progettato per un uso professionale sia nel trading manuale che nei sistemi Expert Advisor. SARÀ DIFFICILE IGNORARE QUESTO INDICATORE — SUPERA LA MAGGIOR PARTE DEGLI OSCILLATORI ATTUALI CON ANALISI CONTESTUALE, RILEVAMENTO DEL TREND, RANGE DI OSCILLAZIONE DINAMICI, IDENTIFICAZIONE DELL
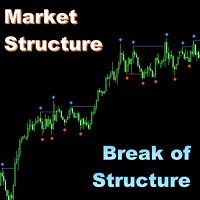
Market Structure - Break of Structure (MS-BOS) per MT5 È stato aggiunto un semplice pannello al centro a destra del grafico, che indica la direzione dell'ultima rottura di struttura (BOS) dell'indicatore con le impostazioni correnti sul set principale di timeframe. Il pannello può essere disattivato nei parametri.
Tutti i miei indicatori funzionano solo alla chiusura delle barre e non ridisegnano i valori già tracciati (salvo quando diversamente specificato nella descrizione). Pertanto sono pi
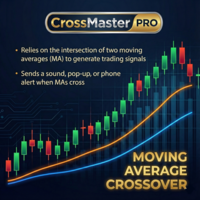
CrossMaster PRO – Where Trends Reveal Themselves CrossMaster PRO is a precision-built indicator designed to identify critical moments where market direction begins to shift. By monitoring the interaction between two moving averages, it delivers clear signals exactly when timing matters most. Built for traders who value clarity over noise, this tool transforms simple crossovers into actionable insights, supported by intelligent alerts and a clean visual structure.
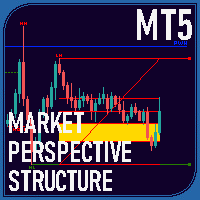
Overview The Market Perspective Structure Indicator is a comprehensive MetaTrader indicator designed to provide traders with a detailed analysis of market structure across multiple timeframes. It identifies and visualizes key price action elements, including swing highs and lows, Break of Structure (BOS), Change of Character (CHOCH), internal structures, equal highs/lows, premium/discount levels, previous levels from higher timeframes, and trading session zones. With extensive customization opt

WaveTrendPro Arrow – Adaptive Cross Signal with Smart Alerts Description WaveTrendPro Arrow is a clean and powerful visual indicator designed to detect trend-reversal points using the classic WaveTrend oscillator (WT1/WT2 cross) , enhanced with intelligent on-chart arrows , real-time alerts , and mobile push notifications . Unlike traditional WaveTrend indicators that display signals in a subwindow, this version shows precise entry arrows directly on the main chart , positioned adaptively

### EMA Oscillator Analysis **Working Principle:** 1. **Main Line Calculation (BufferV):** - Computes price deviation from adaptive EMA. - Formula: `BufferV[i] = Close[i] - (alpha * Close[i] + (1-alpha) * BufferV[i-1])` - Where `alpha = 2/(ema_period+1)`.
2. **Volatility Bands:** - `BufferDev`/`BufferNegDev`: ±1 standard deviation. - `BufferDevLimit`/`BufferNegDevLimit`: ±2 standard deviations (multiplied by `limit_factor`). - Standard deviation is calculate

Taking orders, now on MT5 the TPX Dash Needle is everything you need to find the famous Didi Needles on several timeframes and in several pairs at the same time. These are the simultaneous meeting of the 3, 8 and 20 averages that, aligned with the ADX indicator, are synonymous with large and strong movements in the market. Now with the new Heiken Aish filter, the name of the pair shows the direction of the Heiken Aish you choose, it can be weekly or daily, all signals will appear on the screen,
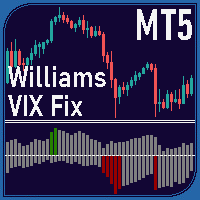
Overview The Williams VIX Fix Indicator is a MetaTrader 5 tool designed to help traders identify potential market tops and bottoms. By analyzing price extremes relative to recent highs and lows, it highlights overbought and oversold conditions using two histograms displayed in a separate window. The indicator combines the Williams VIX Fix calculation with Bollinger Bands and percentile-based thresholds to provide clear signals for potential reversals. Key Features Market Tops and Bottoms Market

Mantis Shrimp Convergence (MSC) A new way to see market momentum — no lag, no confusion.
What is MSC? Mantis Shrimp Convergence (MSC) is a powerful non-repainting oscillator, inspired by the logic of MACD but rebuilt for modern trading: zero lag, no false divergences, and dual-line precision. Designed for traders who demand clarity, speed, and reliability, MSC reveals momentum shifts with unmatched visual and structural accuracy.
How it Works MSC uses two signal lines — Fast and Slow,
Trend Frequency Market MT5 Carry out analysis and backtest even before opening your orders, check the strategy's Winrate and stay in favor of the Trend and the strength of the movement.
The TFM indicator is specialized in providing you with the strength points of the movement, painting the candles GREEN or RED to report price aggression from the Players who are acting at the exact moment. Taking advantage of this detection, the indicator plots Arrow and Entry, Stop Loss and Take Profit levels

TimeGap Block SMC v3.00 Professional Time Gap Analysis Indicator for MetaTrader 5 TimeGap Block SMC is a professional MetaTrader 5 indicator designed to identify and analyze Time Gap zones within market structure. It automatically detects price areas where the market moved too quickly, spending very little time inside a particular price range. These areas often become significant support and resistance zones and can provide valuable trading opportunities when price revisits them. The indicator i

True Volume: See the Story Behind the Price
Recommended Experience Level: Intermediate to Advanced True Volume is not just another histogram; it is a forensic analysis engine for price action. While standard volume indicators only tell you how much was traded, True Volume tells you who traded it and who won . By combining Geometric Decomposition , VSA (Volume Spread Analysis) , and Anomaly Detection , this indicator dissects every bar to reveal the hidden battle between Bulls
Indicatore Media Mobile Multi-Timeframe Sblocca una comprensione più profonda delle tendenze del mercato con l'Indicatore Media Mobile Multi-Timeframe. Questo potente strumento MQL5 ti consente di visualizzare le medie mobili di cinque diversi timeframe contemporaneamente su un singolo grafico. Ottieni intuizioni complete sulla dinamica dei prezzi da varie prospettive senza ingombrare il tuo spazio di lavoro con più istanze dell'indicatore. Caratteristiche Principali: Analisi Multi-Timeframe: Vi
Indicatore RSI Multi-Timeframe Scatena la potenza dell'analisi multi-timeframe con il nostro intuitivo Indicatore RSI! Ottieni una prospettiva completa sull'andamento del mercato su vari timeframe, tutto su un unico grafico. Il nostro Indicatore RSI Multi-Timeframe ti consente di tracciare l'Indice di Forza Relativa (RSI) con un periodo costante su cinque timeframe personalizzabili, consentendoti di prendere decisioni di trading più informate. Caratteristiche Principali: Visualizzazione Multi-Ti
Candle Movement Index (CMI) — Visual Candle Strength Indicator for MT5 The Candle Movement Index (CMI) is a powerful MT5 indicator that visually measures the strength and momentum of each candle. It provides a color-coded representation of candle behavior, allowing traders to easily spot trend strength, market reversals, and volatility zones. This indicator is ideal for scalpers, intraday traders, and swing traders who want a quick and reliable visual confirmation of candle strength. Key Featur
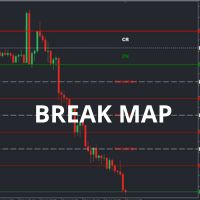
The Channel Break Map is a next-generation indicator for MetaTrader 5, designed for traders looking to maximize profits and minimize risks through precise analysis of channel breaks and trends. With an interactive interface and innovative features, this indicator is the ultimate tool for identifying opportunities in any financial market.
What Does the Channel Break Map Do? Dynamic Channels:
Establishes support (green) and resistance (red) lines, with a central line (white) marking the equilibr
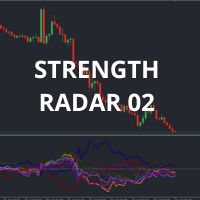
Strength Radar 02 – Take Your Trading to the Next Level!
Hello, trader! If you're looking for a tool to level up your game in forex, Strength Radar 02 is exactly what you need! Developed with passion and expertise, this indicator turns currency strength analysis into something simple and powerful. With it, you'll have a clear view of the real-time performance of AUD, CAD, CHF, EUR, GBP, NZD, JPY, and USD , using indicators like MA, MACD, RSI , and more — all fully customizable your way!
Ima
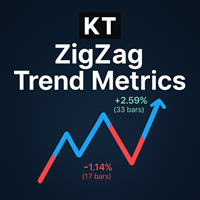
KT ZigZag Trend Metrics trasforma gli swing di mercato in una mappa chiara e leggibile di trend e struttura, così che anche i principianti possano individuare punti di svolta e flusso del prezzo a colpo d’occhio. L’indicatore etichetta ogni swing come Higher High, Lower High, Lower Low o Higher Low e mostra la variazione percentuale rispetto allo swing precedente. Visualizza anche quante barre sono servite per formare il nuovo massimo o minimo e traccia linee tra gli ultimi swing, offrendo una v

Overview
Support & Resistance (MTF) is a MetaTrader 5 indicator that automatically identifies swing highs (resistance) and swing lows (support) across up to three timeframes. It merges nearby levels to reduce clutter, adapts zone width to market volatility using ATR, and offers optional alerts when price breaks or retests those levels. Features Multi-timeframe pivot detection
Identify pivots on the current chart plus two higher timeframes using a configurable pivot length. Merge-distance grou
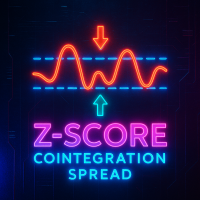
The indicator calculates and displays the Z-Score spread (cointegrated spread) between two financial instruments. It is based on the ordinary least squares (OLS) method to estimate the relationship coefficient between the prices of two symbols and then normalizes the spread distribution into Z-Score values. In a separate indicator window you will see: Main Z-Score line (red) Upper and lower thresholds (silver, dashed), set by the user When the thresholds are reached the indicator signals a poten
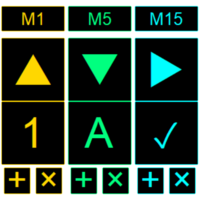
“Voglio verificare la direzione del trend sui timeframe superiori, ma cambiare continuamente il timeframe del grafico è fastidioso…” Per te esiste questo prodotto!! Trend Map Panoramica del prodotto
Questo strumento registra la direzione del trend in ogni timeframe (o in ogni struttura frattale) e la visualizza sempre sul grafico. Anche se cambi il timeframe, il pannello resta visibile, ideale per chi guarda spesso il grafico cambiando timeframe. Puoi così verificare rapidamente la direzione del

Overview Harmonic Patterns MT5 is a technical analysis indicator designed for the MetaTrader 5 platform. It identifies and displays harmonic price patterns, such as Butterfly, Cypher, Crab, Bat, Shark, and Gartley, in both bullish and bearish directions. The indicator calculates key price levels, including entry, stop loss, and three take-profit levels, to assist traders in analyzing market movements. Visual elements and customizable alerts enhance usability on the chart. Features Detects six ha

Purpose : The AllAverages indicator plots a moving average line on the chart, with options to select from a wide range of MA types and price applications. It also displays buy and sell signals as arrows when the trend changes, and supports alerts (sound, email, push notifications) for these signals. Key Features : Supports multiple moving average types (e.g., SMA, EMA, HMA, TEMA, etc.). Allows customization of the price type (e.g., Close, Open, High, Low, Heiken Ashi variants). Displays a colore

The ATR Info Display is a visual indicator that automatically calculates the Average True Range (ATR) on multiple timeframes and displays it directly on the chart. It provides key market volatility information at a glance: Features: Daily, Weekly, and Monthly ATR lines:
Upper and lower bounds are shown as horizontal lines based on the open price of each period.
Colors, line styles, and visibility are customizable.
The daily ATR provides a good estimate of how far the market is expected to mo
Overview
Supply & Demand (MTF) v1.00 is a MetaTrader 5 indicator that automatically identifies and draws key supply and demand zones from up to three timeframes on your current chart. Supply zones mark areas where selling pressure was strong; demand zones mark areas where buying pressure was strong. Features Multi-timeframe detection
Scan the current chart plus two higher timeframes for zones. Candle-strength filter
Require a configurable number of strong candles to confirm each zone. Adjust
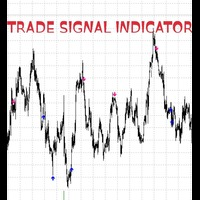
BUY & SELL ARROW INDICATOR - Professional Trading Signals! CRYSTAL CLEAR TRADING SIGNALS WITH PRECISION ACCURACY. WORKS ON ALL TIME FRAME, BEST ON 1HR TIME FRAME WHAT MAKES THIS INDICATOR REVOLUTIONARY? NO REPAINTING - NO GUESSWORK - NO REGRETS! 100% ACCURATE SIGNALS that never change or disappear ZERO OFFSET - Signals appear exactly when they should PERFECT PRECISION. INSTANT VISUAL CLARITY CRYSTAL CLEAR BLUE ARROWS for BUY signals STRIKING PINK ARROWS for SELL signals CLEAN CHART INTERF

Momentum Potentia Altopium è un indicatore di trend e momentum. Il canale identifica le zone di supporto e resistenza e quindi pullback e breakout.
Rialzista: quando il prezzo è al di sopra del canale e il colore è verde, il mercato ha un forte momentum rialzista.
Ribassista: quando il prezzo si muove al di sotto del canale e il colore è rosso chiaro, il mercato ha un forte momentum ribassista.
Questo indicatore può essere utilizzato in due modi:
Pullback : quando il trend è al rialzo o al

Volume & Liquidity Hunter – Scalping è un indicatore professionale per lo scalping progettato per tracciare in tempo reale i picchi di volume e le zone di liquidità su più timeframe.
Unisce concetti di "smart money" alle condizioni reali di mercato, rendendolo lo strumento ideale per operazioni di scalping precise. Che tu stia operando su inversioni, rottura di livelli o gap di valore equo (FVG) — questo indicatore ti aiuta a identificare dove si concentra la reale pressione d'acquisto e di vend
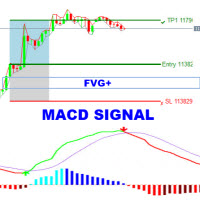
The MACD-FVG Signal System is a hybrid trading indicator that combines the power of momentum analysis through the MACD (Moving Average Convergence Divergence) with the precision of Fair Value Gap (FVG) detection to generate high-probability buy and sell signals. This indicator enhances traditional MACD signals by validating momentum shifts with market inefficiencies, offering traders a more refined entry strategy. Key Features: MACD with Histogram Display
Clearly visualizes the MACD line, Signa

This is a powerful indicator that groups multiple Expert Advisors (EAs) by strategy and displays aggregated performance results directly on the chart. Grouping is optional — you can use it even without organizing EAs into groups. It automatically calculates and visualizes performance within a specified aggregation period. You can exclude specific magic numbers or aggregate results across multiple magic numbers as a group. Additionally, by using partial string matching based on EA names, you can
Trading hours, Market hours, Business hours, Forex trading hours, Trading schedule, Market open/close times, Trading time zones, Time zone indicators, Market clock, ICT, Asia KillZone, London Killzone, New York Killzone
**Prices tend to move and form every 2 - 4 hours.**
Traders should pay attention to the impact of trading time zones, as different market hours and trading volumes can directly affect the volatility and trading opportunities of a currency pair. To help traders understand the m
ZeroLag T 3 Signal Suite The Ultimate All-in-One Trading Companion for XAU USD 15-Minute Charts Join the Group Chat - Community Group Download the Free Simple Trade Utility making your pending order placement simple. Unlock the power of precision trading with the ZeroLag T 3 Signal Suite —an advanced indicator designed for traders who demand speed , accuracy, and actionable insights . Built on the renowned Zero Lag T 3 smoothing algorithm, this tool delivers lightning-fast trend d
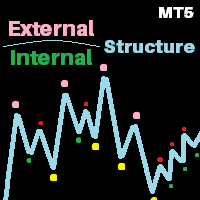
V2 of the Perfect structure.
What's Inherited from v1?
This is the finest structure marking you will ever find in any market. Indicator is coded considering the actual structure any trader would use. Indicator is coded based on actual candle breaks and not coded based on any pivot or predefined values or specific number of candles high and low. Please check out the screenshot. What's new in V2? AI based approach for High accuracy by calculating maximum bars with rapid switch algorithm. Dual tim
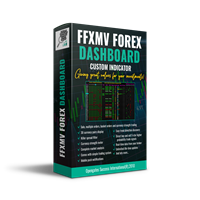
FULL FOREX MARKET VIEW Indicatore Dashboard MT5 Questo è un indicatore personalizzato creato per la piattaforma MT5, progettato per offrire ai trader una visione completa di ciò che accade sul mercato. Utilizza dati in tempo reale per analizzare il mercato e mostra tutte le informazioni necessarie per fare trading con successo. INSTALLAZIONE: Prima di collegare questo indicatore al grafico, vai nel pannello “Osservazione del Mercato” di MT5 e NASCONDI tutte le coppie di valute che non ti servono

3 Trading Strategies to Exploit Market Structure (Without Overcomplicating It)
Trading isn’t about predicting the future—it’s about spotting patterns, managing risk, and acting when odds favor you. Below are two timeless strategies (and one hybrid) that align with how markets actually move, not how we wish they would. Some of the strategies you can trade with the indicator [ Note] Higher timeframe should be 15x of the lower timeframe, for eg. htf 15min, ltf 1min. 1. The Breakout Trap: Trad
Engulfing Zone Sniper MT5 — Multi-Timeframe Signal & Zone Indicator The Engulfing Zone Sniper MT5 is a technical analysis tool designed to highlight engulfing candlestick patterns in combination with adaptive support/resistance zones. It provides visual markers and optional alerts to assist traders in identifying market structure reactions across multiple timeframes. Key Features Multi-Timeframe Detection – Option to scan higher timeframe engulfing setups with lower timeframe confirmation. Su

Smart Risk Manager Dashboard is a MetaTrader 5 indicator designed to assist traders with structured risk control and real-time account monitoring.
It provides a visual interface for managing position size, tracking losses and gains, and setting custom trading limits. Key Features SL/TP Risk Calculator
Displays estimated risk and reward directly on the chart using adjustable horizontal lines. Live Dashboard with Metrics
Shows equity, balance, daily gain/loss, trade count, and other key values i

SqueezeMAX Pro – Mikko Breakout Indicator
Indicatore professionale di breakout per MetaTrader 5, progettato per identificare opportunità di mercato chiare, affidabili e senza repaint, con alte prestazioni. SqueezeMAX Pro – Mikko Breakout Indicator SqueezeMAX Pro è un indicatore avanzato di rilevamento dei breakout per MetaTrader 5 , sviluppato per trader esigenti che cercano precisione, affidabilità e stabilità operativa . Identifica in tempo reale le rotture rialziste e ribassiste basandosi su

Momentum Hunter – Indicatore Avanzato di Momentum senza Ridisegno Momentum Hunter è un indicatore potente e affidabile, progettato per rilevare nuovi impulsi e aiutare i trader a catturare i movimenti di mercato con precisione. Ottimizzato appositamente per il timeframe M1 , funziona perfettamente anche su timeframe più alti, risultando ideale sia per scalper che per swing trader. Caratteristiche principali: Nessun ridisegno e nessun ritardo : I segnali sono stabili e le frecce appaiono solo

The ** SmoothedTrender Indicator** is a custom MetaTrader 5 (MT5) indicator designed to display smoothed Renko bars on a chart, helping traders identify trends with reduced market noise. It transforms traditional price data into Renko bars, which are based on a user-defined price movement (brick size) rather than time, making it easier to spot significant trend changes. The indicator applies a smoothing mechanism to the price data, enhancing clarity by filtering out minor fluctuations.
### Key

指标功能说明 使用周期:M5 适用品种:所有流动性好的金融产品,推荐:黄金,BTC,指数,股票,外汇直盘货币对
此指标是价格行为学最好的辅助工具,总共包含三个主要功能 1,每个交易时段都有K线序列标记,对于不同的交易品种,您可以自由选择需要标记的数量 2、每个交易时段开盘后第一根k线的最高价和最低价范围标记 3,每个交易时段开盘后的前6根K线形成的价格区间标记以及开盘区间被突破后可能会到达的目标位
指标设置说明 1,时区偏移设置:这个部分设置非常重要,加载指标时要根据自己的服务器时区设置重要偏移,以适应交易品种的开盘时间准确布局
BrokerTimeZoneOffset = 0; // 经纪商时区与 UTC 的偏移量(小时) EnableAsia = true; // 启用亚洲会话标记 亚洲开始时间 = "01:00"; // 亚洲时段开始 (HH:MM) MaxAsiaBars = 60; // 亚洲区域的最大柱状图数量(0=无限制) EnableEurope = true; // 启用欧洲会话标记 EuropeStartTime = "10:00"; // 欧洲会话开始时间

AI Core Trading Master Pro - Complete Technical Analysis Suite Transform your trading with the most comprehensive technical analysis indicator for MT5, featuring 10 proven indicators, AI predictions, and a professional real-time dashboard. Core Features 10 High-Performance Technical Indicators: RSI (71.6-87.1% win rate) with divergence analysis Bollinger Bands (74.3-81.3% win rate) with squeeze detection MACD (60-75% win rate) with histogram analysis Stochastic (65-78% win rate) with overbought

ElohimTrade Ultimate Confluence Pro — L'indicatore di confluencia multi–timeframe più potente al mondo Scopri tutto il potenziale del tuo trading con ElohimTrade Ultimate Confluence Pro : lo strumento di analisi tecnica più avanzato, creato per trader che cercano precisione, affidabilità e una visione profonda del mercato. Questo indicatore avanzato unisce la potenza di più indicatori leader — EMA, RSI, MACD, Bande di Bollinger, Stocastico e ADX — analizzandoli contemporaneamente su tre timefram

How ATR Bot Works Tracks Market Trends with Precision: ATR Bot leverages the Average True Range (ATR) to calculate a dynamic Trailing Stop, continuously adapting to market volatility. This ensures you always have a clear view of key support and resistance levels, helping you stay ahead of price movements. Delivers Clear Trading Signals: The indicator generates vivid green arrows for optimal buy opportunities and striking red arrows for sell signals, triggered when the price crosses the ATR Trail

The Alpha: Your Ultimate Trend-Tracking Powerhouse Dive into the markets with The Alpha , a dynamic MetaTrader 5 indicator that supercharges your trading with its core SuperTrend component. Built on the robust Average True Range (ATR), The Alpha delivers crystal-clear, color-coded signals to help traders of all levels conquer trends with precision and flair. How The Alpha’s Works : ATR-Powered Precision : The Alpha uses the ATR (default period: 20) and a multiplier (default: 1.5) to calculate a
Welcome to order block indicator – your complete solution for identifying high-probability zones using order blocks , BOS (Break of Structure) , and CHOCH (Change of Character) .
Designed for precision and speed, this tool gives you the edge in spotting potential reversal and continuation zones just like the pros.
Features : Automatic Order Block Detection: Effortlessly identifies valid bullish and bearish order blocks based on price structure and market behavior. BOS & CHOCH Detection: Buil
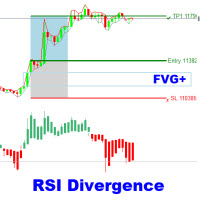
The RSI Divergence + FVG Signal indicator combines Relative Strength Index (RSI) Divergence with Fair Value Gap (FVG) detection to generate high-probability buy and sell signals based on both momentum shifts and institutional imbalance zones. Core Features: RSI Divergence Detection :
Identifies both regular and hidden bullish/bearish divergences between price and RSI. Divergences indicate potential trend reversals or continuation. FVG Zone Recognition :
Detects Fair Value Gaps (imbalances caused
Volumized Breaker Blocks MTF Supreme Volumized Breaker Blocks MTF Supreme is a powerful and user-friendly multi-timeframe (MTF) indicator that automatically detects and visualizes Order Blocks (OB) and Breaker Blocks (BB) on your chart. This advanced tool is designed for both beginners and professional traders who want a clean, fast, and insightful way to identify key market levels with volume context. Key Features Multi-Timeframe Support : Instantly plot OB/BB zones from up to three customizab

Overview
SmartComboSignalDashboard is a multi-strategy signal scanner and visual dashboard for MetaTrader 5. It combines six technical indicator combinations to detect Buy/Sell opportunities and visualize them on the chart. It includes:
Signal table with real-time updates
Push notifications (with time-frame-based throttling)
Visual on-chart entry levels (Buy/Sell stops)
Interactive buttons per strategy for toggling entry levels
Setup & Installation
Open MetaEdito
Indicatore Bande di Bollinger Multi-Timeframe Migliora la tua analisi di trading con il nostro indicatore Bande di Bollinger Multi-Timeframe per MQL5! Questo potente strumento ti consente di visualizzare le Bande di Bollinger su cinque diversi timeframe contemporaneamente, utilizzando la stessa impostazione del periodo . Ottieni una comprensione più chiara della volatilità del mercato e delle potenziali inversioni di tendenza a colpo d'occhio. Semplifica la tua analisi multi-timeframe e prendi d

PRICE WILL BE INCREASED TO £4999 SOON!
Knight Rider FX is a precision-engineered trading indicator that delivers highly accurate, non-repainting signals without flooding your chart. It filters out noise and selectively highlights only the highest probability trade setups. On higher timeframes, it anticipates major market reversals, while on intraday charts it pinpoints mini reversals with tactical clarity. By focusing on quality over quantity, Knight Rider FX equips traders with disciplined ent
L' Indicatore di Decomposizione Stagionale per MQL5 è uno strumento potente progettato per aiutare i trader a identificare e analizzare le tendenze sottostanti e i pattern stagionali all'interno dei dati delle serie temporali finanziarie. Decomponendo i movimenti di prezzo nei loro componenti principali, questo indicatore fornisce un quadro più chiaro delle dinamiche di mercato, consentendo decisioni di trading più informate. Caratteristiche Principali: Linea di Tendenza: Visualizza chiaramente

Range Filtered AlgoAlpha è uno strumento di analisi tecnica progettato per identificare potenziali opportunità di trading analizzando la volatilità del mercato. Questa versione MetaTrader dell'indicatore originale TradingView di AlgoAlpha combina diversi metodi analitici per fornire una valutazione visiva del mercato. Caratteristiche tecniche
Utilizza il filtraggio di Kalman (Kalman Filtering) per livellare i prezzi
Include bande basate sull'ATR (ATR-based Bands) per misurare la volatilità
Inte

Killer Combo System is a multi-strategy indicator designed to highlight potential reversal and continuation setups by combining several technical modules in one tool.
It provides flexible configuration, allowing users to enable or disable different confirmation filters according to their own trading approach. Available Modules RSI and CCI Divergence Detection MACD Crossovers Candlestick Pattern Recognition Multi-Timeframe Filtering Moving Average and Bollinger Band Trend Filters Signal Labels an

Hello traders!
I'm here to introduce you to a new project called (Scalpeer Deriv)
which is based on trend hunting on M5 / M15 / M30 / H1 and H4 time frames!!!
for DERIV pairs (SYNTHETIC INDICES)
Volatility 75, Boom 1000, Crash 1000, Crash 500, Boom 500, Crash 300, and Boom 300
with Volume 5 and Time 500 parameters
providing buy and sell signals to hunt a good trend!!!
Highly recommended!
The first 5 copies will cost $149 / Final price $299!!
Title: Adaptive Flow Ratchet - The Intelligent Trailing Stop Tired of being stopped out on a minor pullback only to watch the price explode in your analyzed direction? Have you ever given back most of the profits from a great trade because your stop was too wide when the trend lost steam? The Adaptive Flow Ratchet by Dan Ferre is designed to solve exactly these problems. This is more than a trailing stop; it's a trade management system that adapts in real-time to the true strength of the market.
RSI con Media Mobile Integrata Questo indicatore combina la potenza dell'Indice di Forza Relativa (RSI) con la sua media mobile integrata, offrendo una visione più chiara e dinamica del momentum del mercato. A differenza dell'RSI standard, che può essere soggetto a falsi segnali, questa versione migliorata aiuta i trader a confermare le tendenze e a identificare potenziali inversioni con maggiore fiducia. Caratteristiche Principali: Media Mobile Integrata: L'indicatore traccia una media mobile p
Pendenza della Media Mobile con Segnale Questo indicatore innovativo va oltre una semplice media mobile fornendo un'analisi dinamica e potente della sua pendenza. Calcola e visualizza non solo la pendenza di una media mobile, ma anche una media mobile di tale pendenza, creando un segnale altamente efficace per i cambiamenti di tendenza e i cambiamenti di momentum. Questa analisi a doppio strato aiuta i trader a filtrare il rumore e a identificare la vera forza della tendenza e le potenziali inve

Axis Reversionn: Multi-Asset Strength & Reversal Matrix Pinpoint market extremes and anticipate potential reversions with Axis Reversionn . This advanced dashboard for MetaTrader 5 provides an institutional-grade view of the market, allowing you to see which assets are over-extended and ripe for a reversion to their mean. Instead of following the crowd, identify where the crowd has pushed too far. Axis Reversionn gives you the data-driven edge to trade against market extremes with confidence. Ke
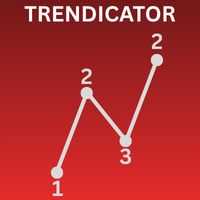
Functions Analyzes the current market trend Displays a numbering system based on trend structure (see below) Colors the chart background depending on trend direction Displays the ZigZag indicator Display Fibonacci Retracement with custom defined levels at the lates corrective trend movement Display Fibonacci Expansions with custom defined levels at the latest progressive trend movement Buffers for all relevant Trend parameters so EAs can access the trend information
Background Information The

Media Mobile con Multi-Timeframe e Impostazioni Personalizzabili La Media Mobile è uno strumento fondamentale per ogni trader. Il nostro indicatore avanzato di Media Mobile va oltre lo standard, offrendoti una flessibilità e un controllo senza precedenti. Questo indicatore ti consente di visualizzare una media mobile da qualsiasi timeframe sul tuo grafico attuale, fornendo una prospettiva unica e aiutandoti a individuare tendenze che altrimenti potresti perdere. Caratteristiche principali: Funzi
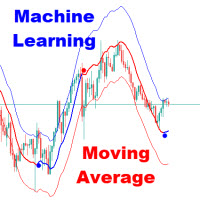
The Adaptive Gaussian Moving Average or also known as Machine Learning Moving Average (MLMA) is an advanced technical indicator that computes a dynamic moving average using a Gaussian Process Regression (GPR) model. Unlike traditional moving averages that rely on simple arithmetic or exponential smoothing, MLMA applies a data-driven, non-linear weighting function derived from the Gaussian process, allowing it to adaptively smooth the price while incorporating short-term forecasting capabilitie

Indicatore Market Structure ICT 1. Struttura di Mercato Automatizzata Il vantaggio principale è la riduzione degli errori dovuti all'interpretazione soggettiva. Identificazione precisa del trend: Identifica automaticamente BOS (Rottura della Struttura) per la continuazione e CHoCH (Cambio di Carattere) per l'inversione. Classificazione degli Swing: L'utente può scegliere il tipo di struttura (breve, medio o lungo termine), adatto sia agli Scalper che agli Swing Trader. 2. Dashboard Professional
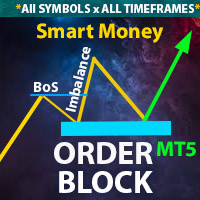
** All Symbols x All Time frames scan just by pressing scanner button ** Discount : Only 4 of 5 copy is 35$.
*** Contact me to send you instruction and add you in "Order Block group" for sharing or seeing experiences with other users. + FREE Trading Utility MT5
Introduction: The central banks and financial institutions mainly drive the market, Order block is considered a market behavior that indicates accumulation of orders from banks and institutions, then the market ten

The algorithm scans the price history on a specified timeframe to identify relevant Order Blocks. Key features of EA_OB_v10.0: Intelligent analysis of Order Blocks across multiple timeframes Trend filtering using a secondary timeframe Graphical display of OB zones on the chart for better readability Flexible configuration for entry, Stop Loss, Take Profit, trailing stop, risk management, etc. Built-in protection against excessive losses (daily or cumulative) Optimized examples provided for XAUUS
Il MetaTrader Market è un negozio online unico di robot di trading e indicatori tecnici.
Leggi il promemoria utente di MQL5.community per saperne di più sui servizi unici che offriamo ai trader: copia dei segnali di trading, applicazioni personalizzate sviluppate da freelance, pagamenti automatici tramite il Sistema di Pagamento e il MQL5 Cloud Network.

Ti stai perdendo delle opportunità di trading:
- App di trading gratuite
- Oltre 8.000 segnali per il copy trading
- Notizie economiche per esplorare i mercati finanziari
Registrazione
Accedi
Accetti la politica del sito e le condizioni d’uso
Se non hai un account, registrati