 MetaTrader 5
 Experts
 Indicatori
 librerie
 Utilità
 Widget
 Regole
Guarda i video tutorial del Market su YouTube
Come acquistare un Robot di Trading o un indicatore
Esegui il tuo EA
hosting virtuale
hosting virtuale
Prova un indicatore/robot di trading prima di acquistarlo
Vuoi guadagnare nel Market?
Come presentare un prodotto per venderlo con successo
Indicatori tecnici a pagamento per MetaTrader 5 - 161
 I segnali degli indicatori tecnici giocano un ruolo cruciale nell'apertura e nella chiusura delle transazioni sui mercati azionari e Forex. L'essenza degli indicatori è una trasformazione matematica del prezzo di un simbolo finanziario, finalizzata alla previsione dei cambiamenti futuri dei prezzi. Prova gli indicatori tecnici, per prevedere al meglio il comportamento del mercato e ricavarne dei guadagni.

The first minutes after the New York open often define the range that the rest of the session reacts to. NY Opening Range Breakout Retest draws that range automatically and waits for a clean sequence: a candle closes outside the range, then price comes back to retest the broken edge and a strong candle closes in the breakout direction. Only then is a signal printed. How a signal is formed 1. Opening range : the high and low of all bars that open between Range start and Range end (default 09:30-0

Se fai trading sui breakout, conosci già il dolore di rimanere intrappolato in un falso movimento. Aspetti che si formi il range mattutino, entri a mercato alla rottura, e il mercato si inverte all'istante. Ero stanco di avere a che fare con tutto questo, così ho creato Oilveric Range Pro . Questo è l'esatto indicatore che utilizzo ogni giorno come nucleo del mio sistema di trading manuale. Inizialmente ho progettato questa logica per avere regole di gestione del rischio abbastanza rigide per l

Multi-TF StdDev 28 is a MetaTrader 5 chart indicator for multi-timeframe volatility context. It plots M1 SMA50 / SMA200 and Tenkan / Kijun, draws HTF (default H1) standard-deviation shelves from an open-anchored lookback (sigma800, evidence-pruned ±0.5…±8 bands), and adds a second sigma10 ruler (±7 / ±8 dashed) with z800 / z10 readout. Optional modules include BOTH-RULERS-DEEP badges, broker-hour clock windows, Asian session HH/LL, Fibonacci and cycle overlays, H1 cycle probability labels, backg

Overview Horizon Expanded Signal is an entry signal indicator for MetaTrader 5. It checks whether five technical indicators (SMA, ADX, CCI, Parabolic SAR and Momentum) are aligned in the same direction, and only when the completed higher-timeframe trend agrees, it draws an entry signal together with suggested stop-loss and take-profit levels on the chart. It is designed and verified primarily for GOLD on the 15-minute timeframe. This indicator does not place orders by itself. Main features Align

Session and previous day levels from closed bars, with one break alert and one retest alert per level. No repaint. What it does Session Retest Levels draws the high and low of the Asian, London and New York sessions and of the previous day. It tells you when a closed bar breaks a level, and when price comes back to that level and holds on the break side. It is an indicator. It does not trade, and it gives no signals or advice. No repaint A level appears only after its session has closed. Its pri

MTF Pivot Projection Multi-Timeframe Market Structure and Forward Pivot Analysis MTF Pivot Projection is a technical analysis indicator designed to combine multi-timeframe market structure, Fibonacci levels, Order Blocks and Fair Value Gaps into a single projected price path. Instead of displaying independent pivot levels from multiple timeframes, the indicator builds one continuous sequence of potential future swing highs and lows, from the nearest projected retracement to subsequent extension

Rejection Candles Pro marks candles where price was pushed one way and thrown back, and lets you keep only the ones your chosen filters agree with. It works on any symbol and any timeframe. What it marks Rejection from below (green arrow under the candle): hammer, dragonfly doji, bullish pin bar. Rejection from above (red arrow over the candle): inverted hammer, shooting star, gravestone doji. Rejection from both sides (gold dot, optional): long-legged doji and spinning top. Three filters Switch

MelloDivergence finds regular and hidden divergence from up to five oscillators at the same time - RSI, MACD histogram, Stochastic, CCI and On Balance Volume - and shows only the swings where a minimum number of them agree. A multi-symbol, multi-timeframe dashboard shows the latest divergence on every market you follow.
No repaint, no back-painting A swing can only be known after the bars on its right have closed. MelloDivergence waits for that confirmation and draws the arrow on the bar where

Overview Supply and Demand Multi Timeframe Pro is a MetaTrader 5 chart-window indicator for the current chart symbol. It detects supply and demand zones from local pivot highs and lows across up to three selectable timeframes, then displays them on the open chart. Zone Detection Candidate zones are filtered using tick volume compared with recent average tick volume. Zone height is based on recent average bar range and the source candle range, with adjustable price padding. Zones invalidated by l

RatioFangClassic detects five classic harmonic patterns on your chart and draws the PRZ (Potential Reversal Zone) together with entry, stop-loss and take-profit guides. It is a display-only indicator: it never places, modifies or closes orders. What it detects Butterfly, Gartley, Bat, Crab and ABCD, both bullish and bearish. Each pattern is checked against its commonly published Fibonacci ratios, with an adjustable tolerance. Every pattern can be turned on or off. What you see on the chart The X

Tell CageCalc two things — the money you are willing to risk on one trade, and where your stop goes — and it does the lot-size arithmetic for any instrument:
- **Your risk in money** (default $8) and your stop, either as a price or a distance in points - it reads the instrument's real tick value, tick size and volume limits from your broker feed — no symbol tables, no guesses - shows the **loss per 1.0 lot** at your stop distance, the **lots that fit your risk** (floored to the broker's volume

MelloStrength measures the strength of USD, EUR, GBP, JPY, CHF, CAD, AUD and NZD - plus gold and silver - from the 28 major and cross pairs, and shows it on one common scale: a Z-score. A reading of +2 means the currency has moved up twice as much as it typically does over the same number of bars, so a strong JPY and a strong GBP can be compared directly.
How strength is measured - Each currency gets a basket index: the average of its 7 pairs, with the sign turned so that a rising index means a

Introducing Moira Threads, a multi-factor trend analysis indicator that combines multiple market indicators to identify market direction, measure trend strength and detect potential trading opportunities. Moira evaluates market conditions using RSI, multi-timeframe EMA alignment, Bollinger Bands and relative strength against a configurable benchmark. These components contribute to a weighted score ranging from -100 to +100, which is used to determine the current trend state and generate trading

Introducing Ambrosia Pulse , a momentum-based trading indicator that combines momentum strength and PPO confirmation to identify potential BUY/SELL opportunities. Ambrosia Pulse analyzes market momentum using a configurable momentum oscillator and PPO histogram, generating signals when both align and momentum strengthens. With clear chart labels, a live dashboard and customizable alerts, it provides a structured approach to identifying potential market entries. Key Features: Momentum Analysis:

MelloScanner watches many symbols and timeframes at once and tells you where price has just tested a meaningful level - a supply or demand zone, the edge of a range, or an old reversal level - and how much evidence lines up at that test, as a score from 0 to 9.
The nine factors 1. Price tested a level: an order-block zone after a break of structure, a range edge, or an old reversal level 2. The level has reversed price three times or more 3. The test is inside the 50-78.6% retracement of the la

Introducing Argent Aegis , a market-structure and fractal breakout indicator that combines confirmed fractal levels with HH, HL, LH and LL analysis to identify potential BUY/SELL opportunities. Argent Aegis identifies confirmed swing highs and lows, analyzes market structure and generates BUY signals when price closes above the latest upper fractal with higher-low confirmation, and SELL signals when price closes below the latest lower fractal with lower-high confirmation. It combines breakout co

ICT Order Blocks Structure individua e disegna automaticamente gli order block ICT / Smart Money partendo dalla struttura del mercato. Non indovina le zone dal colore delle candele: un order block viene disegnato solo dopo che il prezzo lo conferma con una rottura di struttura, e resta sul grafico solo finché è valido. Come funziona Punti swing – massimi e minimi swing vengono rilevati con un numero configurabile di candele per lato. Rottura di struttura – una chiusura sopra l'ultimo swing high

Introducing Eclipse Valkyrie , a relative volume and momentum-based trading indicator that combines RVOL analysis, EMA trend confirmation and price breakouts to identify potential BUY/SELL opportunities. Eclipse Valkyrie compares current volume against historical averages to classify market activity as Surge, Normal or Dormant. It combines EMA alignment, candle strength, breakout confirmation and minimum relative volume requirements to identify potential entries, supported by clear chart signal

Introducing Halcyon Channel , a Keltner Channel-based trend and trading signal indicator that combines EMA, ATR bands and optional RSI confirmation to identify potential BUY/SELL opportunities. Halcyon Channel builds dynamic price channels using an EMA basis and ATR-based upper and lower bands. It offers three entry modes: Breakout, Basis Cross and Band Re-entry, with optional RSI confirmation to validate signals. A trend-coloured basis, chart markers, live dashboard and customizable alerts prov

Introducing Kestrel Trail , a SuperTrend-based trend-following indicator that combines ATR trailing levels with optional RSI, ADX and EMA filters to identify potential BUY/SELL opportunities. Kestrel Trail uses ATR-based calculations to establish dynamic trailing levels and detects trend reversals when price crosses the trail. Optional confirmation filters help validate entries through momentum, trend strength and EMA direction, providing a structured approach to trend analysis. Key Features: Dy

Introducing Helios Flux , a SuperTrend-based trend analysis and trading signal indicator that combines ATR bands, EMA bias, RSI momentum and candle confirmation to identify potential trend reversals and pullback opportunities. Helios Flux detects trend changes using an ATR-based SuperTrend engine and applies optional EMA, RSI and candle filters to validate entries. It also supports pullback re-entry signals, BUY/SELL markers, trade plan previews, customizable alerts and an interactive dashboard.

MelloTrend is a filter for your own trading decisions. On every closed bar it gives one verdict: BUY side only, SELL side only, or stand aside - based on the trend, the higher-timeframe trend and whether the market is worth trading right now. The trend line itself is coloured with the verdict: green, red or grey.
What the verdict checks - Trend: an ATR trend line (default ATR 10 x 3.0) that flips only on a close beyond the line - Higher timeframe: the trend line of the next timeframe up (M15 ->

DynaRatchet is an automated trading tool that locks in your profits while giving your trades room to breathe. Much like a mechanical ratchet that only turns one way, this tool moves your safety floor forward as the market goes in your favor, but completely locks in place during temporary pullbacks. This removes the guesswork and emotion from deciding exactly when to exit a trade.
Instead of using a rigid, fixed distance, it automatically studies the market's current speed. It widens during wild

ALIEN Signals & Buffers PRO Professional Trend Trading Indicator with BUY/SELL Signals and EA Buffers for MetaTrader 5 ALIEN Signals & Buffers PRO is a trend-following trading indicator designed to identify potential trading opportunities in the direction of market movements. The indicator displays clear BUY and SELL arrows directly on the chart, helping traders identify potential entries, trend changes, and trend continuation opportunities. It is suitable for manual trading and integration with

️ ICT Market Structure Pro: Institutional Price Action & OTE Engine MT5 By Forge Quant Technologies Stop trading blind retail price action. Most "Smart Money Concepts" (SMC) indicators fail because they calculate pivots off unclosed wicks, flood your chart with overlapping text clutter, and repaint historical lines when market momentum shifts against them. ICT Market Structure Pro is a high-precision, institutional-grade price action markup engine engineered specifically for MetaTrader 5. It s

SignalForge Trend highlights when a market starts a trend and when that trend is over. It helps you stay with the larger moves and stay out of sideways markets. What it gives you Clear entry and exit marks on the chart, with a stop level that follows the trend. A status line: current direction and stop level at a glance. Ready presets for Gold (XAUUSD) and Silver (XAGUSD), designed for H4. Works on any symbol with the Generic or Custom settings. Alerts by popup, sound, push notification to the M
Volume Per Second shows how fast volume is coming in, by dividing each bar's volume by its duration in seconds.
Because the value is "volume per second", it can be compared directly across all timeframes.
How it works • Closed bars: volume ÷ full period length (e.g. 60 s on M1, 900 s on M15, 3600 s on H1) • Current bar: volume ÷ seconds elapsed since the bar opened, refreshed every second even when no new ticks arrive • Warm-up smoothing: in the first part of a new bar, the seconds that have

Pythagorean — Indicatore di cambio di direzione del trend Panoramica Pythagorean mostra la direzione attuale del trend direttamente sul grafico dei prezzi, sotto forma di una fila di punti colorati che seguono il prezzo. I punti verdi indicano un movimento rialzista, quelli rossi un movimento ribassista. Il cambio di colore dei punti segnala un cambio di direzione del trend. L'indicatore funziona su qualsiasi strumento e su qualsiasi timeframe. I valori di una candela chiusa non vengono ridisegn

contatto : @kingstrategy1 DMG Harmonic Scanner Pro (MT5)DMG Harmonic Scanner Pro è uno strumento di analisi tecnica avanzata sviluppato in MQL5 nativo per MetaTrader 5, progettato per identificare automaticamente i pattern armonici a 5 pivot (XABCD), le correzioni di prezzo (Flat & Irregular) e i canali di regressione dinamici in tempo reale.Ideale sia per trader discrezionali che per sviluppatori di sistemi di trading, l'indicatore unisce la precisione matematica dei ritracciamenti di Fibonacci

ROCKET4 SUPER TREND CHANNEL See the Trend. Read the Market. Identify Trading Opportunities. Stop guessing the market direction. Start reading it with confidence. ROCKET4 SUPER TREND CHANNEL is a professional multi-layer trend analysis indicator designed to help traders understand market direction, visualize dynamic price channels, and identify potential trading opportunities directly on their MetaTrader 5 charts. Whether you trade short-term moves or follow longer market trends, ROCKET4 provi

High Volume Pivot SR Zones Advanced Volume-Based Support & Resistance Indicator for MetaTrader 5 High Volume Pivot SR Zones is an advanced technical analysis indicator designed to identify important market support and resistance areas using pivot levels, price action, and volume-based analysis. The indicator helps traders identify potential market reversal zones, breakout opportunities, breakdown levels, and support/resistance retests directly on the chart. By combining pivot-based price levels
One chart. Five classic indicators. Three periods each. No sub-window clutter.
The Five-Stack Panel displays RSI, CCI, ATR, ADX and MFI at three periods simultaneously (defaults 7 / 18 / 28, all adjustable) in a compact on-chart panel, with a plain-language state tag for each reading:
- **RSI** — tag: OVERBOUGHT (≥70) / MID / OVERSOLD (≤30) - **CCI** — tag: STRETCH UP (>+100) / STRETCH DN (<−100) - **ATR** — shown in price units at your symbol's precision - **ADX** — tag: CHOP (<20) / WEAK TRE

Draws one Monday buy arrow and one exit arrow per week, based only on the bar time. Designed for GBPJPY H1.
This indicator marks one trade idea per week.
On Monday, it draws a buy arrow at the open of the 11:00 bar. On the same Monday, it draws an exit arrow at the open of the 23:00 bar, and a dotted line joins the two. Both times are server time on the reference clock (GMT+2 in winter, GMT+3 in summer).
The arrows depend only on the bar time and use the bar open price. An arrow never moves

Marks a buy signal when the 8-period EMA crosses above the 21-period EMA on a closed bar, with take-profit and stop-loss lines. Designed for gold H1.
This indicator shows one simple rule on the chart. It does not open or close trades.
When a bar closes and the fast exponential moving average (EMA, 8 periods, close price) has crossed above the slow one (21 periods), an up arrow is drawn under that bar. The idea is to buy at the open of the next bar. A green line shows the take-profit level (4.

Gemina Signals shows the trades of the Gemina Expert Advisor on your chart, for traders who prefer to place their orders themselves: an arrow where each trade starts, its stop loss and take profit, where it ended, and an alert when a new one comes. It uses exactly the same fixed settings as the EA. Checked trade by trade against the EA's own backtest (MT5 Strategy Tester, real ticks, January 2019 to October 2026): all 69 gold trades and all 70 USD/JPY trades start at the same bar in the same dir

What this is Draws the high and low of a configurable session window together with the recent range history, so the levels that price has repeatedly reacted to are visible without hand-drawing them every day. What it does Marks the high and low of a configurable session window and keeps the last N sessions on the chart as boxes, with breakout levels extended to the right and each box labelled with its range in points. Session structure on demand at any hour window, drawn as the actual tradable b

What this is An ATR value of 12 points means very different things on EURUSD H1 and on gold M5. This indicator turns ATR into a percentile: the current ATR is ranked against the previous bars, and the result is plotted on a 0 to 100 scale with four bands. 20 means the market is quieter than 80 percent of the recent past; 90 means it is near the most volatile reading of the window. What it does Plots the percentile rank of ATR over a lookback window as a 0-100 oscillator with LOW / NORMAL / ACTIV

MelloLiquidity maps two things on the chart: fair value gaps that have not been filled, and liquidity levels that have not been taken. When a bar wicks through a level and closes back, it marks a sweep. Everything is decided on closed bars, so history shows what you would have seen live. It needs no DLL and no external service.
Fair value gaps - A three-bar imbalance, with a minimum size in ATR so small gaps are ignored - Stays on the chart until filled. You choose what filled means: touched, m

Trend Range Breakout Pro rileva automaticamente le zone di consolidamento (lateralizzazione) sul grafico e mostra il momento esatto in cui il prezzo fuoriesce da tali aree.
COSA VEDRAI SUL GRAFICO
Zone di lateralizzazione: quando il prezzo rallenta in un intervallo ristretto, l'indicatore disegna un rettangolo che si estende candela dopo candela fino al termine della zona.
Linea di tendenza: una linea basata su una media mobile che cambia colore: verde — trend al rialzo, rosso — trend al rib

Volume Profile OrderFlow Suite puts volume profiles, VWAP and tick order flow on one MetaTrader 5 chart, with one panel. It also measures how price actually reacted at the profile levels on your symbol, so you can see from your broker's own data whether a level has been worth watching. The panel always shows which data is used. Forex and CFD symbols in MT5 only have tick volume (the number of price changes), so on those symbols the buy/sell side is an estimate. Symbols with exchange trades use r
All classic chart patterns, with a track record. The indicator finds double and triple tops and bottoms, head & shoulders and inverse head & shoulders, ascending, descending and symmetrical triangles, rising and falling wedges, flags, pennants, rectangles and 1-2-3 reversals on your chart and on dozens of symbols and timeframes at once. Every pattern is drawn with its neckline or boundary lines, the breakout level , the invalidation (stop) level and the measured-move target - and the panel shows

Short description Auto trendlines, channels and regression plus multi-timeframe FVG, Order Blocks, Liquidity Sweeps, CHoCH and Fib, with trend-colored candles. Non-repainting, Renko-ready. Full description Hybrid Analysis — Structure, Smart Money Zones & Auto Trendlines in One Indicator Hybrid Analysis combines automatic trendline analysis with multi-timeframe Smart Money Concepts on a single chart, so you can read trend, structure and key zones without stacking several indicators. WHAT IT DRAWS

MarketStructure – Smart Money Concepts & Trading Analysis for MT5 Understand market movements, identify key trading zones, and make more informed trading decisions with MarketStructure. MarketStructure is an all-in-one Smart Money Concepts (SMC) indicator designed for MetaTrader 5. It combines market structure, liquidity analysis, order blocks, fair value gaps, and multi-timeframe trend analysis into one powerful trading tool. Instead of switching between multiple indicators, MarketStructure bri

VWAP Sentinel è un sistema completo di analisi VWAP che combina diversi livelli di calcolo VWAP, livelli VWAP storici persistenti, analisi delle deviazioni e una matrice VWAP dinamica multi-simbolo in un unico strumento di trading integrato. Questo indicatore va ben oltre il semplice VWAP. VWAP Sentinel introduce una struttura di calcolo multi-core che conserva i valori di riferimento VWAP precedenti e i relativi livelli di deviazione, mantenendoli visibili sul grafico fino a quando il prezzo no

Tick Volume Pressure MetaTrader 5 Indicator | Release: F2.0 Tick Volume Pressure Overview Tick Volume Pressure is a separate-window oscillator designed to visualize estimated bullish and bearish market pressure using candle movement and tick-volume activity. The indicator combines a color-coded directional histogram, relative-strength highlighting, automatic symmetric scaling, and a configurable Power Summary panel in one compact view. Its default configuration uses Hybrid calculation mode, ATR-

MelloTrendlines draws trend lines and channels for you, through swing highs and lows that are already confirmed. It marks when a bar closes through a line and when price later comes back to test it. Every mark is decided on a closed bar, so marks never move or disappear afterwards. It needs no DLL and no external service. Lines Support lines through rising swing lows, resistance lines through falling swing highs (other slopes can be allowed) A line is drawn only if no wick crossed it between its

Product name Liquidity Zones Volumetric Delta Automatic buy-side and sell-side liquidity zones with volumetric buy/sell bars, delta strip and liquidity . Full description Liquidity Zones Volumetric Delta detects swing-based liquidity zones and shows how much buying and selling volume was behind each one, directly on your chart. What it does Finds swing highs and swing lows using adjustable left/right pivot lengths.. Builds a zone around each pivot. Zone thickness is based on ATR, so it adapts to

Imagine riding the biggest waves in the ocean, but instead of water, you’re riding waves of pure market momentum! Trend Surfer By AmbushPips is your ultimate digital surfboard for MetaTrader 5. Here is how it acts like your personal surf instructor on the charts: The Colorful Waves (Cloud & Candles): It paints your candles and background in bright neon colors ( Deep Sky Blue for bullish waves and Deep Pink for bearish wipeouts) so you always know which way the current is pushing. Smart Money Flo

Sohrabi FVG BTB BO – Multi-Timeframe Price Action Indicator Identify market structures. Visualize key price zones. Analyze multiple timeframes with greater clarity. Sohrabi FVG BTB BO is a price action indicator developed for MetaTrader 5. It automatically identifies three important price structures using dedicated candle-based formation rules and displays their corresponding zones directly on the chart. The indicator combines FVG, BTB and BO analysis in a single tool, helping traders study pric

Alpha Currency Strength Pro measures the relative strength of the eight major currencies (USD, EUR, GBP, JPY, AUD, NZD, CAD, CHF) in real time and shows it in a compact dashboard on the main chart. You can see which currencies are being bought, which are being sold, and which pair combines the strongest and the weakest currency. How it works For every available cross pair, the indicator measures momentum (RSI) and price action (position of the close inside the recent high-low range). Each pair a
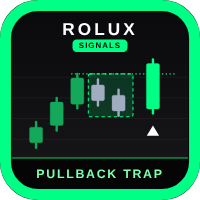
Rolux Pullback Trap
Indicatore di continuazione pullback / trap per l'Oro (XAUUSD) su M5: segna la zona di ritracciamento dopo un forte movimento e il segnale alla chiusura oltre il suo estremo. Calcolato solo a barre chiuse, non ridisegna.
DESCRIZIONE Rolux Pullback Trap riconosce su MetaTrader 5 uno schema classico: un forte movimento direzionale, un ritracciamento che intrappola chi entra nel verso opposto e una candela che chiude oltre l'estremo del movimento. Disegna la zona del ritracc

Velocity Pro
Velocity Pro shows you at a glance who is in control of the market, buyers or sellers, and gives you complete BUY / SELL setups with Stop Loss and three Take Profits. Signals are confirmed at candle close and never repaint.
WHAT YOU SEE ON THE CHART • Control cloud: green when buyers are in control, red when sellers are. It follows price with adaptive bands (KAMA + ATR) that widen in volatile markets and tighten in quiet ones. • Colored candles: bright for strong moves, soft for

MelloEntryLight puts the checks you make before an entry on one panel, separately for buy and sell, and shows a GREEN, YELLOW or RED light for each side. It never trades. How the light is scored Room to the swing (0-3): distance from price to the swing high for a buy, or to the swing low for a sell, measured in ATR(H1). Too close turns the light red at once. Votes (0-3): EMA slope and price side on M1, M5 and M15, plus the M1 MACD histogram and MACD line. Trend (0-3): EMA and MACD direction on f

Smart Zones is a powerful, comprehensive MetaTrader 5 indicator designed for traders using Smart Money Concepts (SMC) and institutional price action. All-in-One SMC & Price Action Engine. Instead of cluttering your charts with multiple tools, Smart Zones automatically maps dual market structures, order blocks, liquidity sweeps, fair value gaps, premium/discount zones, and multi-timeframe bias into one ultra-clean, professional dashboard. Key Features & Core Engines Dual Market Structure (Swin

Ten Moving Averages Display up to ten moving averages on one chart, with separate settings for each line. This indicator does not open or close trades, provide entry/exit signals or promise profit. Settings For each line, choose:
- Type: RMA (Wilder / smoothed), SMA, EMA, WMA, HMA (Hull) or VWMA.
- Length and color. HMA uses a minimum length of 2.
- Price or timeframe: Normal MA, Chart and Multitimeframe MA use the chart close. Open, High, Low, Close, hl2, hlc3, ohlc4 and hlcc4 use the selected

REJECTION ZONE – Advanced Market Rejection Indicator
Trade the Rejection. Identify the Opportunity.
Introducing REJECTION ZONE, a powerful and intelligently designed trading indicator developed to help traders identify potential market rejection areas and high-probability trading opportunities.
Built for traders who value precision, clarity, and better market analysis, REJECTION ZONE helps visualize important price rejection zones so you can make more informed trading decisions.
Why REJEC

Big BB — mini-pannelli di Bande di Bollinger su quattro timeframe in un unico grafico Big BB colloca pannelli compatti direttamente sul grafico dei prezzi. Ogni pannello mostra le candele recenti di un timeframe scelto insieme alle Bande di Bollinger di quel timeframe. Non serve passare da M15 a M30, H1 e D1: tutti sono visibili contemporaneamente. Ogni timeframe ha il proprio periodo e la propria deviazione delle Bande di Bollinger. Versione per MetaTrader 4: https://www.mql5.com/en/market/prod

Multi Indicator Master Suite MT5 Multi Indicator Master Suite MT5 è un ambiente integrato di analisi tecnica progettato per MetaTrader 5. Unisce 12 strumenti istituzionali di analisi di mercato in un'unica architettura leggera, aiutando i trader a ottimizzare l'esecuzione grafica e a mantenere un'area di lavoro ordinata su Forex, indici, materie prime e criptovalute. L'esecuzione di più indicatori indipendenti tende spesso a rallentare il terminale MetaTrader 5 e a frammentare la visualizzazion

Product name Fractal Concept by SUVO Short description (one line) Volumetric liquidity zones, CISD, HTF candles with timers, HTF FVG, SMT divergence and candle sweeps in one auto-theme dashboard. Full description Fractal Concept by SUVO is a multi-tool price action and liquidity indicator for MetaTrader 5. It places the key levels and signals of a Smart Money / ICT style workflow on one clean chart, with a built-in dashboard. It works on any symbol and timeframe, and adapts automatically to whit

A low-lag adaptive price envelope. The El Saiid Band is a price envelope built on a proprietary adaptive middle line. Unlike classic moving-average bands, the middle line follows turns in price with minimal delay (about 1 bar at the default setting), so the band reacts to changes in trend early instead of trailing behind them. Values are fixed once a bar closes – the indicator does not repaint history. Two width modes SD mode – a tight band that hugs price. Useful for spotting stretched moves a

SMC Algo Spartan reads market structure the way a smart money trader marks it by hand, and draws it for you. It finds the swing highs and lows, labels every break of structure as a BOS (the trend continues) or a CHoCH (the trend turns), marks the order block each break leaves behind, and prints a buy or sell arrow when price comes back into a live block and a candle rejects it, with an entry, a stop and two targets drawn beside it. Everything is decided when a bar closes and stays where it was

Smart Money Concept Part 9
This Drawing Panel v2 will show at the chart and make you understand the smart money concept terminology.
Suitable for beginner traders to understand this concept.
SMC Structure
SMC Zone
Liquidity
Supply & Demand EMA 8, 21, 125
Text
The Drawing Panel is quite interesting, it can show and hide drawings. The Chart won't look messy.
This indicator not heavy for the chart
*There are many more parts of the next indicator. Also other indicators that help you in

Panoramica SMC Liquidity Sweep with Buy Sell Zones è un indicatore di trading istituzionale avanzato e all-in-one, nativo per MetaTrader 5 (MT5). Colma il divario tra la classica analisi dei punti di swing e la moderna metodologia della price action istituzionale. Identificando automaticamente i cambiamenti strutturali, gli eventi di liquidità, gli Order Blocks (OB) e i Fair Value Gaps (FVG), questo indicatore fornisce ai trader zone di esecuzione chiare e basate su regole. Progettato con un'int

MID RCM Gold — Indicator Description Overview MID RCM Gold (Relative Currency Momentum – Gold vs US Dollar) is a professional multi-symbol momentum indicator for MetaTrader 5 that measures the relative strength of Gold (XAU) against the US Dollar (USD) across multiple currency pairs simultaneously. Unlike traditional indicators that analyze a single symbol, RCM Gold aggregates momentum data from up to 8 gold pairs and 7 USD pairs to produce two smoothed strength lines plotted in a separate windo

Institutional Smart Compass Pro (ISCP) The All-in-One Institutional Order Flow & Liquidity Indicator for MetaTrader 5 Stop guessing where the big players are. Start seeing it. Why Institutional Smart Compass Pro? Most retail traders lose not because they lack effort, but because they trade against the footprints of large institutions. They buy right where liquidity is about to be swept. They sell into fresh demand. They enter on a lone signal with no confirmation behind it. Institutional Smar

Velox Momentum Confluence Engine puts six momentum and money-flow readings on one scale and blends them into a single score from -100 to +100. Instead of six separate windows, you read one line, its signal line, and how many of the six agree with the move. A signal needs the score to cross its signal line with enough agreement behind it. Each signal maps an ATR stop and three targets, the candles take the score's colour, and a dashboard shows the state of every component and filter.
- MT4 vers

Supreme Pressure Signals looks for one event: a burst that runs out of fuel. A bar's high or low travels far beyond a volatility band around its average, the next bar stops expanding, and the indicator marks a signal against the burst, back toward the average. Around that core it maps pressure clusters at swing points, tracks timed session ranges, rates every signal from 0 to 10 with up to four stars, and draws a ticket with an entry, a stop and three targets.
- MT4 version - Trading guide - U

Supreme Momentum Confluence turns six oscillators into one reading. RSI, the smoothed stochastic, CCI, the MACD histogram, rate of change and the Money Flow Index are each rescaled to the same -100 to +100 range and averaged by weight. One line, its signal line and the share of the six that agree then tell you what six windows would. A signal needs that line to cross its signal line with enough of the weight behind it. Each signal maps an ATR stop and three targets, the candles take the score's

TDAI Gold Lite (Tick Delta Accumulation Indicator) Sub-Bar Order Flow & Tick Imbalance Analytics for XAUUSD is an institutional-grade trading tool engineered exclusively for XAUUSD (Gold Spot) . Unlike traditional technical indicators (RSI, MACD, Moving Averages) that suffer from inherent lag by only looking at historical OHLC bar closes, TDAI operates at sub-bar resolution . It captures, calculates, and analyzes the raw flow of individual price ticks in real-time inside the forming c

TradeZone Pro – Position Manager A chart-based tool for visualizing and planning trading positions in MetaTrader 5. TradeZone Pro helps traders plan their entries, Stop Loss and Take Profit levels directly on the chart. FEATURES Long and Short Positions – Create visual Buy and Sell trading setups directly on your chart. Interactive Position Management – Drag Entry, Stop Loss and Take Profit levels using your mouse. Risk/Reward Visualization – View the relationship between potential risk and rewa
MetaTrader Market - i robot di trading e gli indicatori tecnici per trader sono disponibili nel tuo terminale di trading.
Il sistema di pagamento MQL5.community è disponibile per tutti gli utenti registrati sul sito MQL5.com che effettuano transazioni su MetaTrader Services. Puoi depositare e prelevare denaro usando WebMoney, PayPal o una carta di credito.

Ti stai perdendo delle opportunità di trading:
- App di trading gratuite
- Oltre 8.000 segnali per il copy trading
- Notizie economiche per esplorare i mercati finanziari
Registrazione
Accedi
Accetti la politica del sito e le condizioni d’uso
Se non hai un account, registrati