Rejection Candles Pro
- Indicatori
- Versione: 1.0
- Attivazioni: 5

Rejection Candles Pro marks candles where price was pushed one way and thrown back, and lets you keep only the ones your chosen filters agree with. It works on any symbol and any timeframe.
What it marks
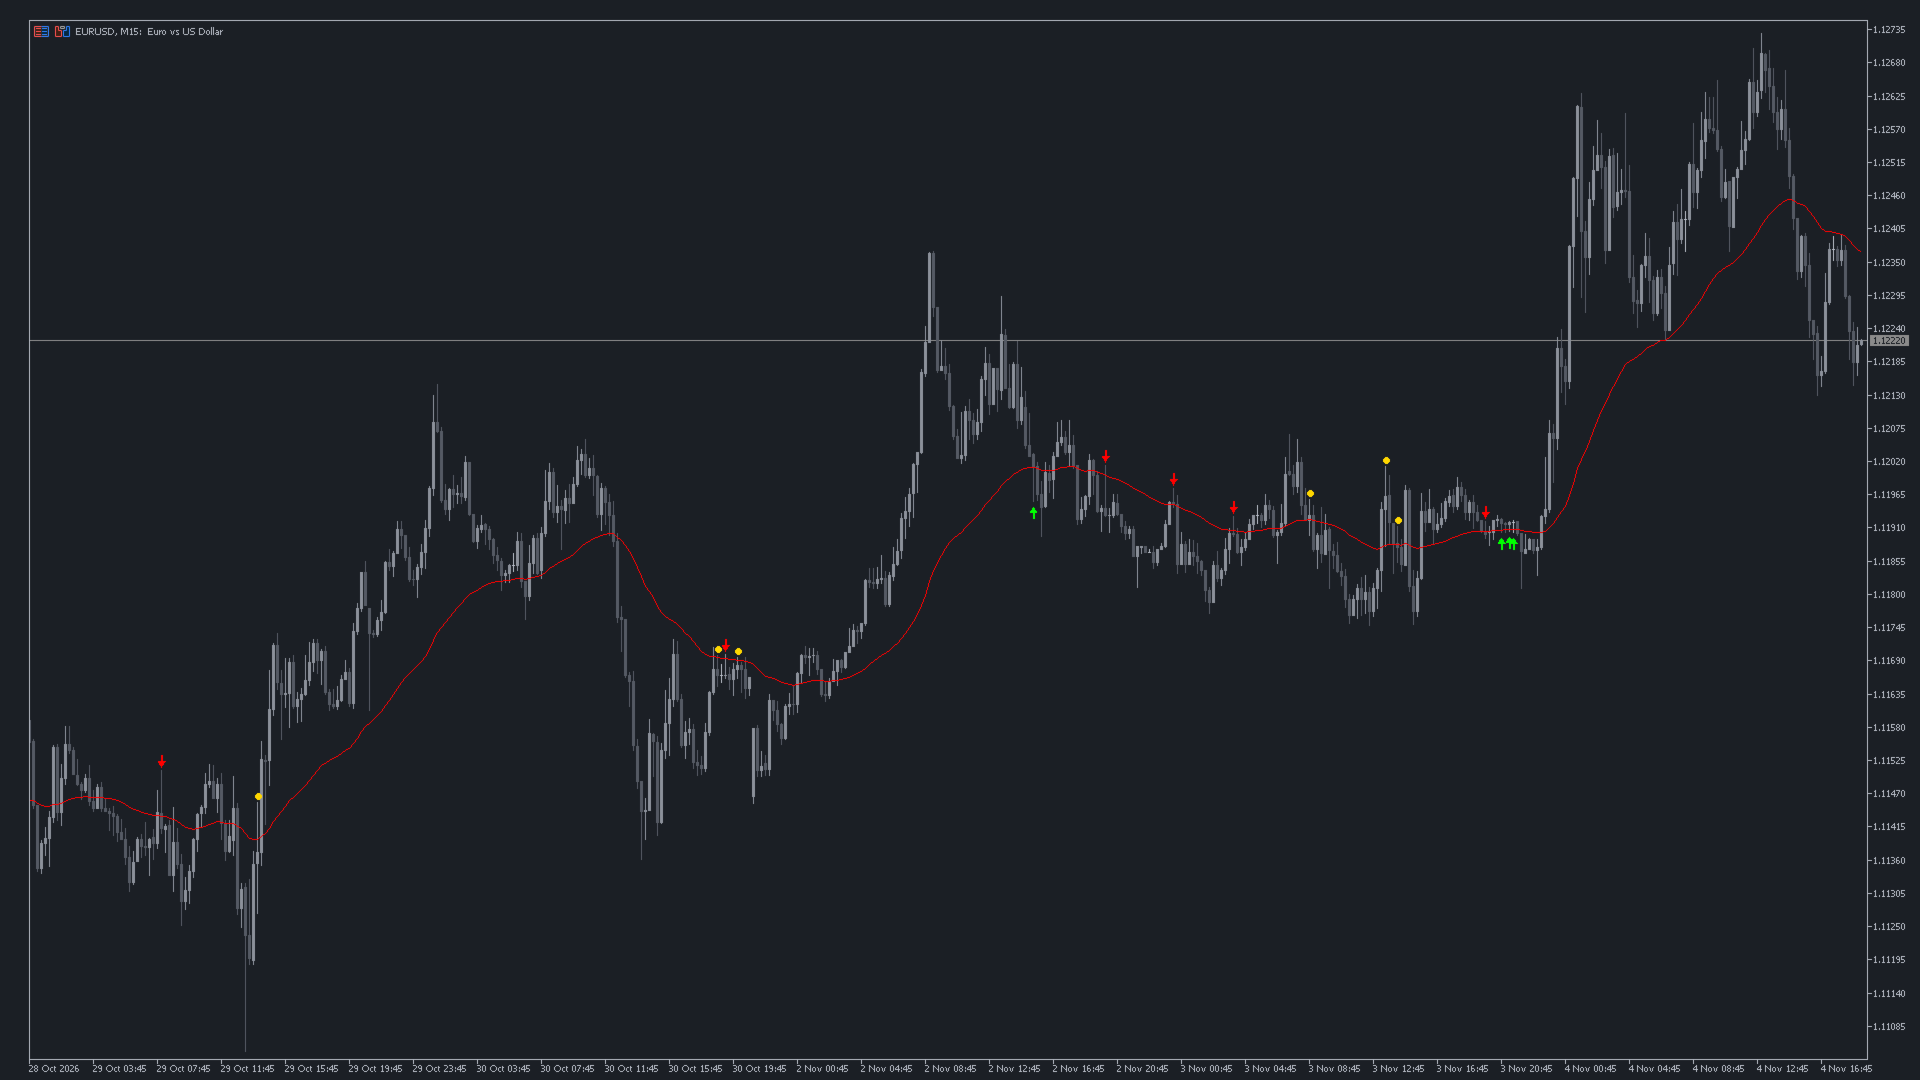
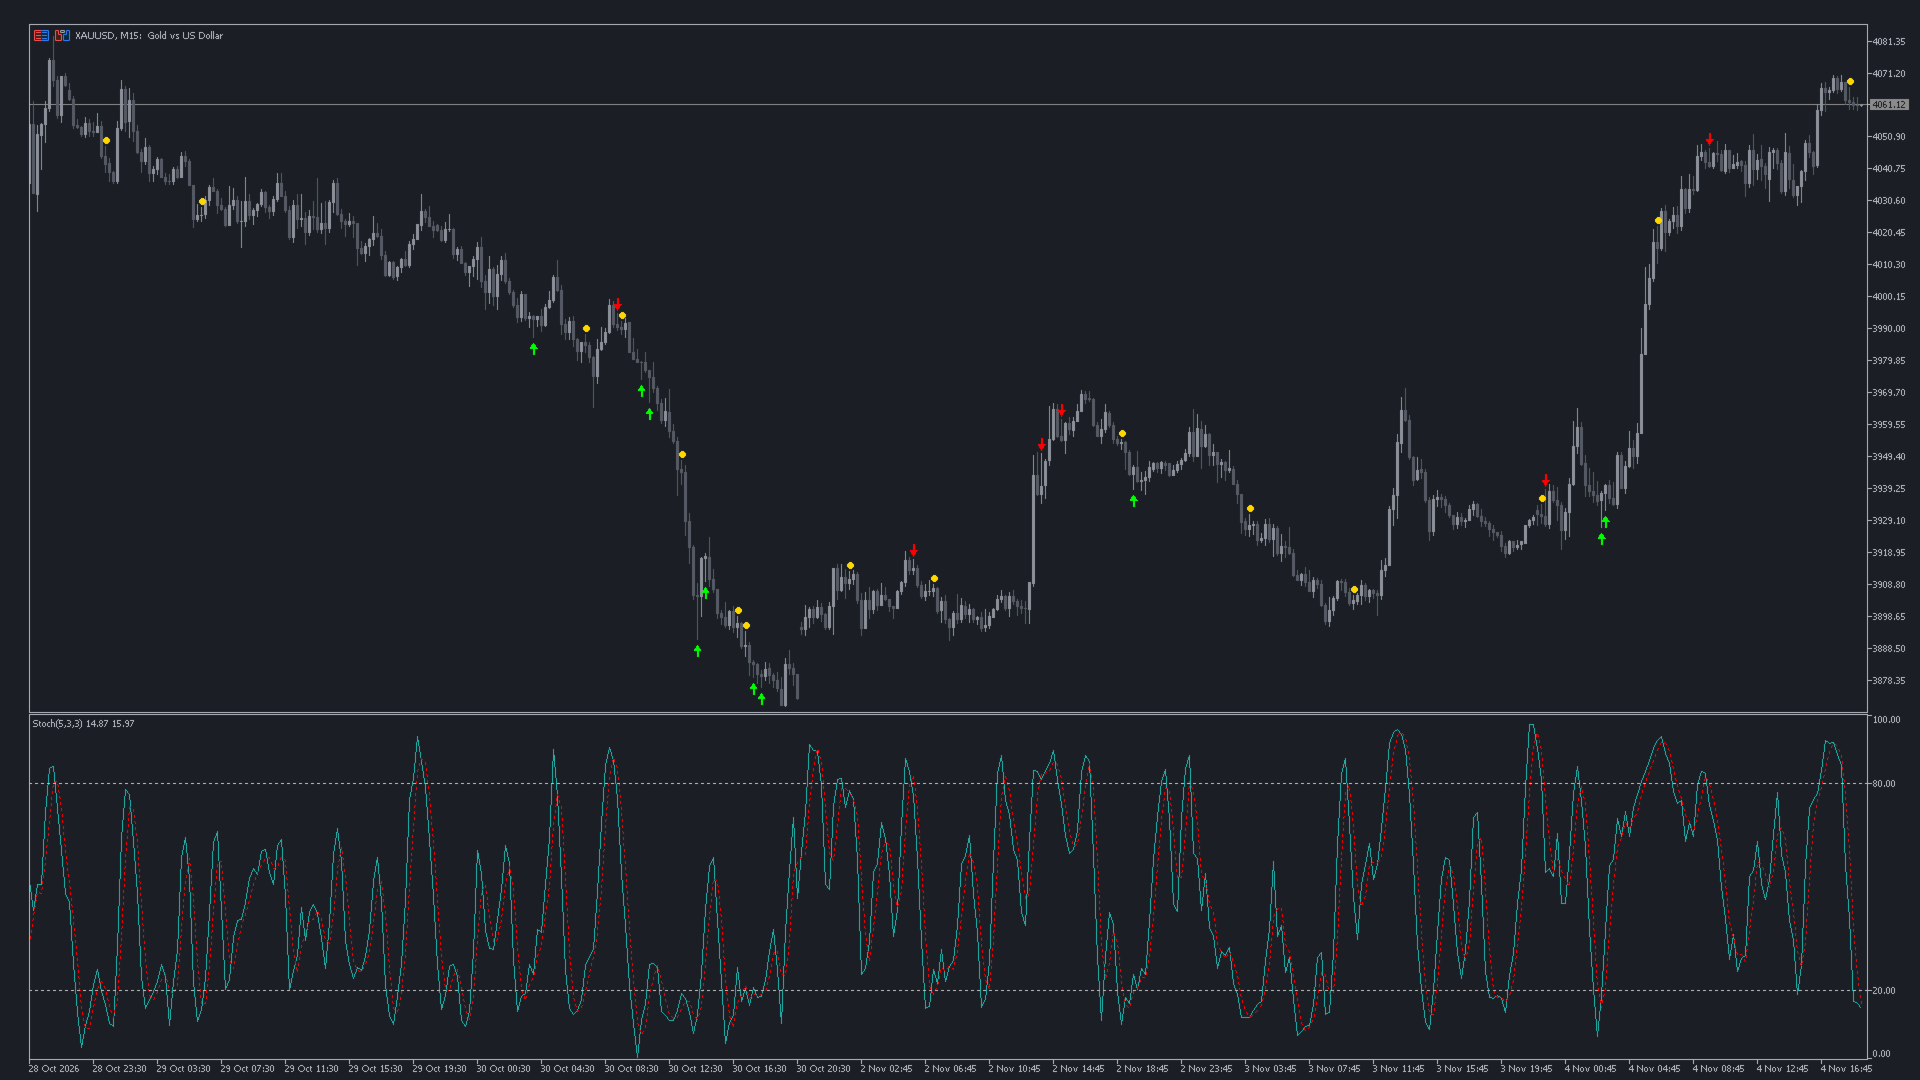
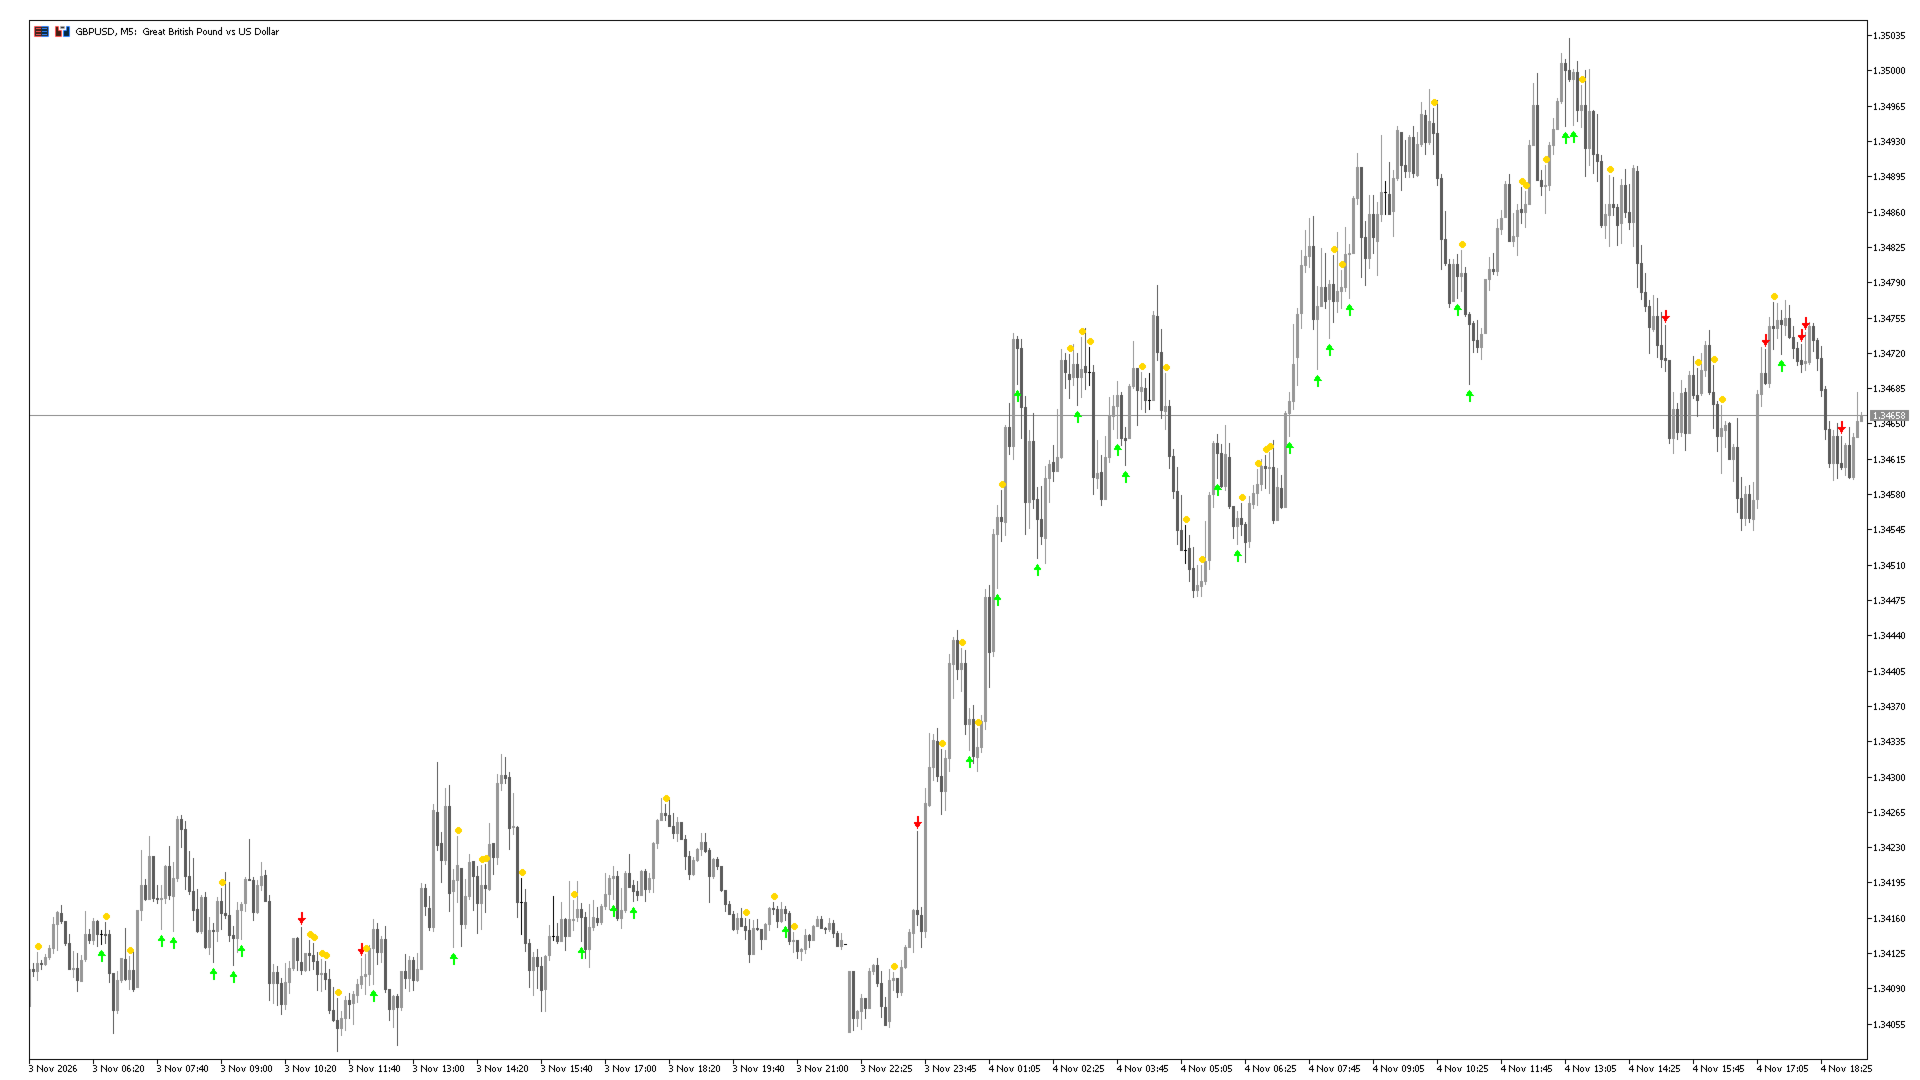
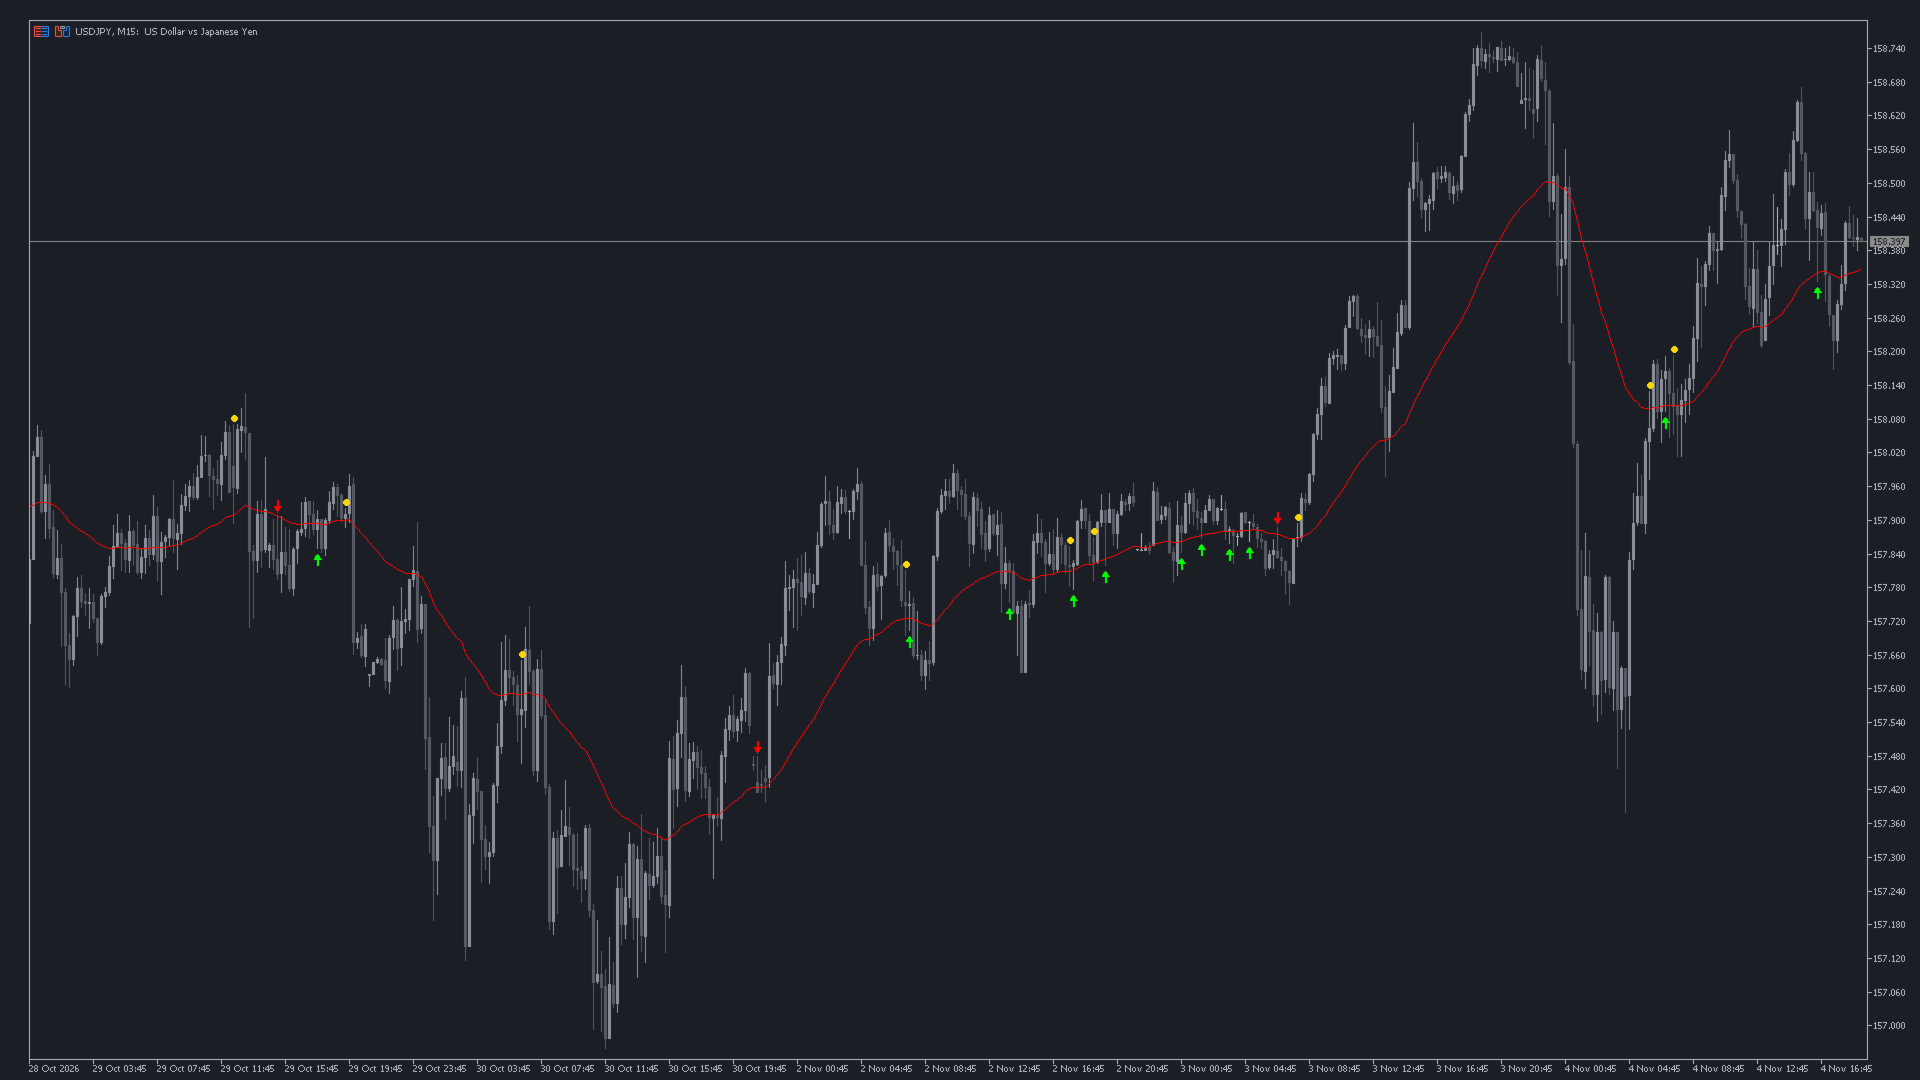
- Rejection from below (green arrow under the candle): hammer, dragonfly doji, bullish pin bar.
- Rejection from above (red arrow over the candle): inverted hammer, shooting star, gravestone doji.
- Rejection from both sides (gold dot, optional): long-legged doji and spinning top.
Three filters
Switch on any of them, alone or together. With all of them off you see every rejection candle.
- Stochastic: an arrow stays only when Stochastic agrees with it. Its settings are adjustable.
- Moving average: an arrow stays only when the candle is rejected at the moving average, used as support or resistance. Period and method are adjustable.
- Higher timeframe trend: an arrow stays only when it agrees with the trend of the next higher timeframe. This is chosen for you: M1 uses M5, M5 uses M15, M15 uses M30, M30 uses H1, H1 uses H4, H4 uses D1, D1 uses W1. The trend EMA period is adjustable.
- Each chart can run its own filters, for example the higher timeframe trend on one symbol and Stochastic on another.
Alerts
- Pop-up, sound, push notification to your phone and e-mail, once per new marked candle.
- The alert names the pattern and the filters it passed, for example: EURJPY M1: rejection from ABOVE - Inverted hammer / shooting star (confirmed: M5-trend).
Good to know
- Only closed candles are marked, so an arrow never appears or disappears while a candle is forming, and past arrows do not repaint.
- It runs light on many charts at the same time.
- It works on dark and light chart themes, and follows the chart as you scroll and zoom. Arrow size, distance and colours are adjustable.
- It does not open or manage trades.
- It has no output buffers and draws no chart objects that other programs can read.
- It does not calculate in the Strategy Tester's non-visual mode. Use it on a chart, or in the tester's visual mode.
- A free version, Rejection Candles, marks the same candles without the filters.
- A filtered rejection candle shows where price was turned back under the conditions you chose. It is not a prediction that price will keep moving that way. Use it together with your own analysis and risk management.