Five Stack Panel
- Indicatori
- Versione: 2.31
- Attivazioni: 5

One chart. Five classic indicators. Three periods each. No sub-window clutter.
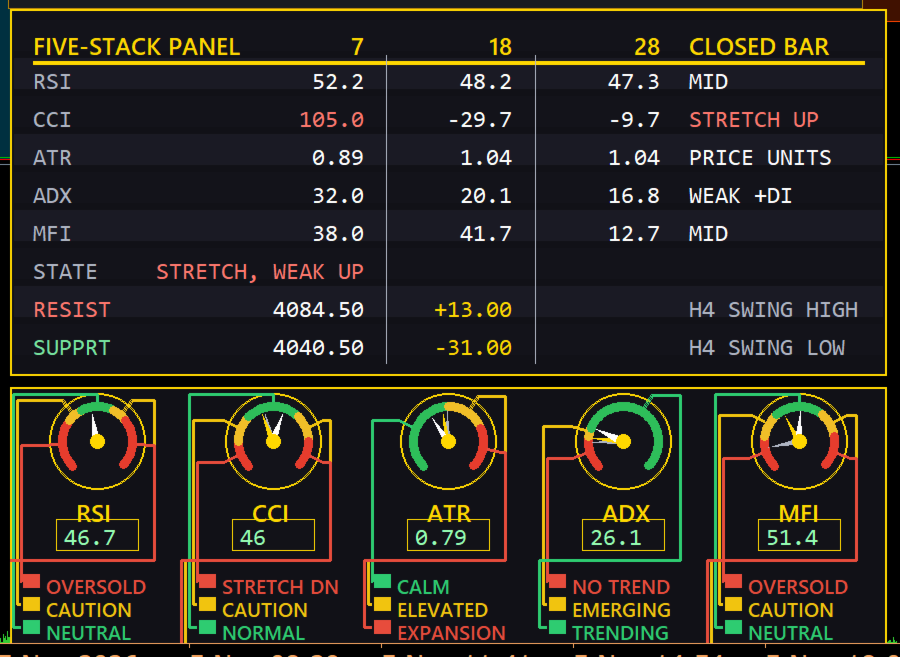
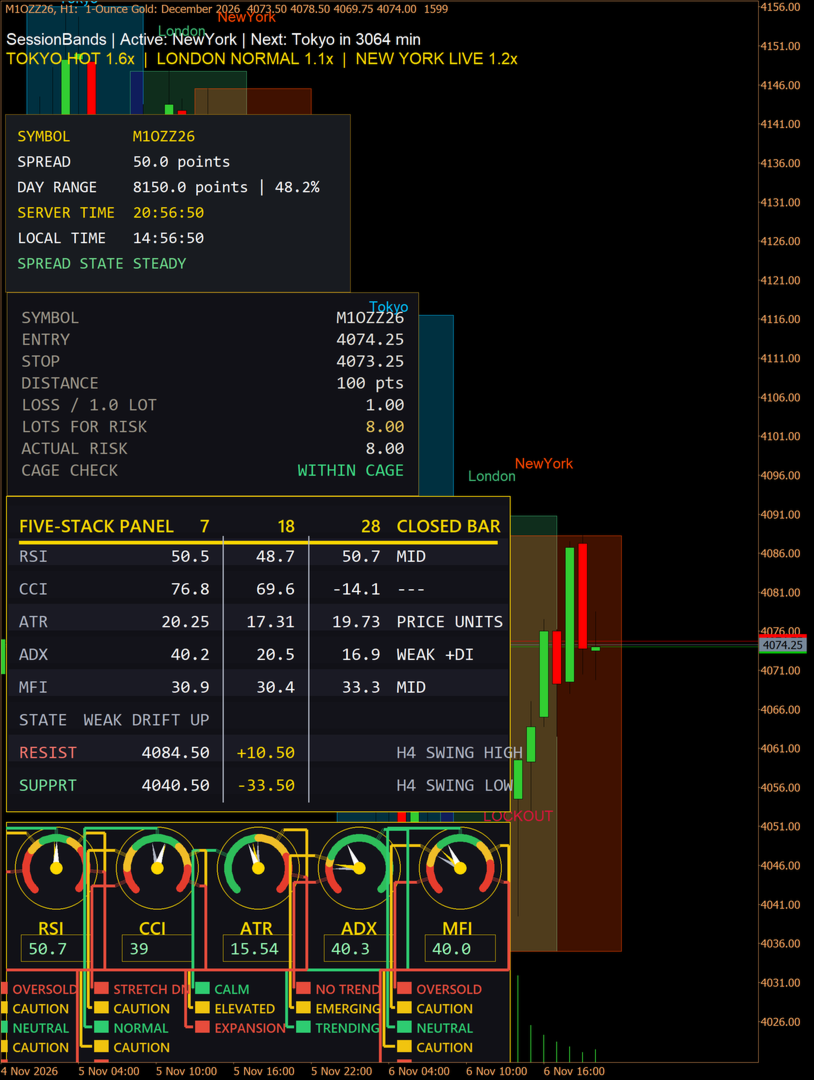
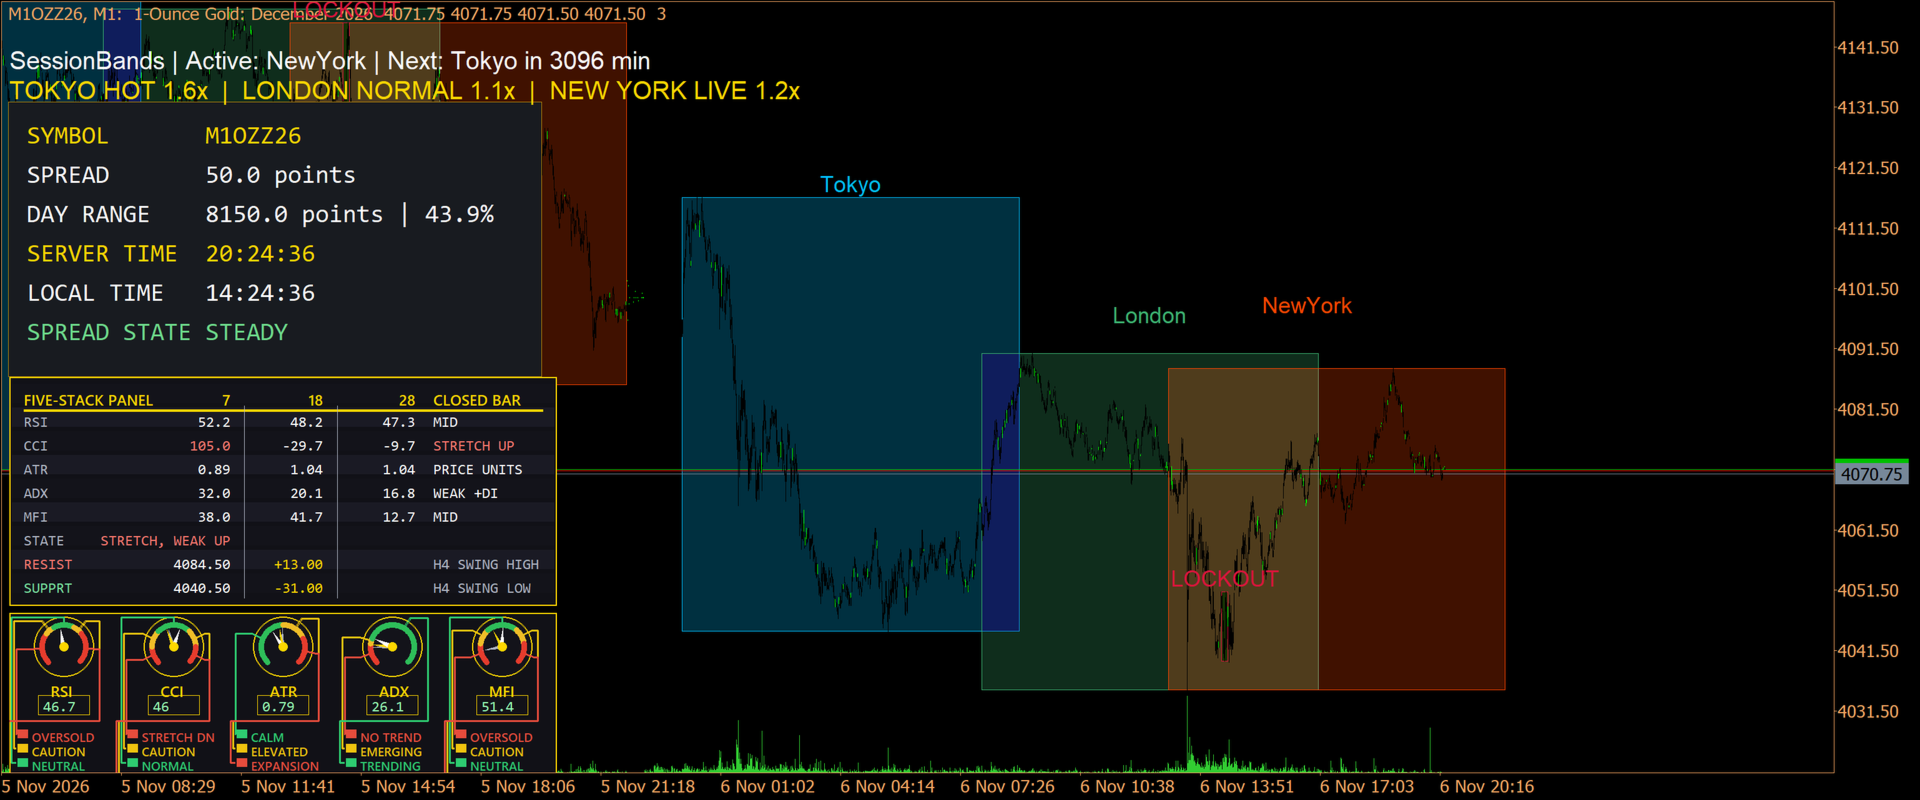
The Five-Stack Panel displays RSI, CCI, ATR, ADX and MFI at three periods simultaneously (defaults 7 / 18 / 28, all adjustable) in a compact on-chart panel, with a plain-language state tag for each reading:
- **RSI** — tag: OVERBOUGHT (≥70) / MID / OVERSOLD (≤30)
- **CCI** — tag: STRETCH UP (>+100) / STRETCH DN (<−100)
- **ATR** — shown in price units at your symbol's precision
- **ADX** — tag: CHOP (<20) / WEAK TREND (20–25) / TRENDING (>25), plus the +DI/−DI direction from the middle period
- **MFI** (tick-volume) — tag: OVERBOUGHT (>80) / MID / OVERSOLD (<20)
Reads the **last closed bar** by default (a setting switches it to the live bar), so the numbers on your screen are the numbers that don't repaint.
The table's verdict row is the **Stack State**: a proprietary fusion verdict computed from all five stacks at once — how many sit at extremes, the ADX regime, the +DI/−DI direction, and whether volatility is coiled (fast ATR under slow ATR). EXTREME STRETCH, STRETCH IN TREND, TRENDING, WEAK DRIFT, COILED IN CHOP, QUIET CHOP. One word for the whole stack's condition, from rules that exist in no other panel.
Under the Stack State sit the **Levels rows**: the nearest key **H4 resistance** above price and the nearest key **H4 support** below it — confirmed H4 swing highs and lows plus the H4 range extremes — each shown with its price, the distance from current price, and what the level is (H4 SWING HIGH, H4 HIGH, H4 SWING LOW, H4 LOW). The levels are always read from H4 bars, so changing chart timeframe never moves your boundaries, and they roll to the next level the moment price crosses one. Signals are only half a read; these are the boundaries they happen inside. And the panel holds its own ground: signal arrows and price tags from other indicators that land on the panel are tucked away while they sit under it and handed back the moment they move out, so the panel's face stays readable no matter what else is running on the chart.
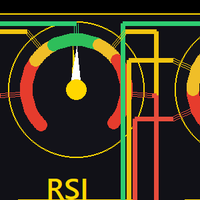
Under the table sits a **cockpit gauge strip**: five round WWII-style dials, one per stack, with aviation color zones — **green normal, yellow caution, red extreme** — three hands of one length fanning from one hub — a light hand for the fast period, a gold hand for the middle period, and a silver hand for the slow period, so agreement stacks into a single hand and divergence fans open at a glance — and under each dial sits an ordered key to its colored bands — a box filled with the band's color beside the band's name (OVERSOLD, CAUTION, NEUTRAL, OVERBOUGHT; STRETCH DN, NORMAL, STRETCH UP; CALM, ELEVATED, EXPANSION; NO TREND, EMERGING, TRENDING), with a thin leader line in the band's own color running from each key row around the dial to the band it names — and a **digital readout window under each dial** showing the exact value the fast hand points at. The gauges run **live on the forming bar**, tick by tick, while the table holds the closed-bar record.
Three built-in themes — **Dark, Light, and System**: System reads your chart's background and matches the panel to it automatically, and re-matches if you re-skin your chart. All geometry **scales to your display's DPI**, so the layout holds together on a 4K laptop and a plain monitor alike. Panel corner, position and font size are configurable. Any symbol, any timeframe. No DLLs, no external connections, no account access — it reads indicator values and draws. That is all it does.
This indicator displays information only. It does not open, close or manage trades, does not generate buy/sell signals, and makes no claim about future price movement. What you do with a clean dashboard is your own trading decision.
Runs on XAUUSD and other CFDs, and on futures contracts as well — including 1-ounce gold futures — any symbol your broker offers in MetaTrader 5.