Tick Volume Pressure

Tick Volume Pressure

MetaTrader 5 Indicator | Release: F2.0

Tick Volume Pressure

Overview

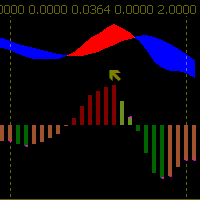
Tick Volume Pressure is a separate-window oscillator designed to visualize estimated bullish and bearish market pressure using candle movement and tick-volume activity.

The indicator combines a color-coded directional histogram, relative-strength highlighting, automatic symmetric scaling, and a configurable Power Summary panel in one compact view.

Its default configuration uses Hybrid calculation mode, ATR-based normalization, and a 5-minute Power Summary.

Visual Elements

  • Lime histogram: Regular bullish directional pressure.

  • Dark green histogram: Bullish pressure with relatively high strength.

  • Salmon histogram: Regular bearish directional pressure.

  • Maroon histogram: Bearish pressure with relatively high strength.

  • Zero line: Separates bullish and bearish directional pressure.

  • Symmetric scaling: Automatically adjusts the upper and lower boundaries to keep zero centered.

  • Power Summary panel: Displays accumulated bullish and bearish pressure over a configurable time window.

  • Delta histogram: Optionally displays the net difference between accumulated bullish and bearish pressure.

The histogram represents estimated directional pressure, not actual buy or sell transaction volume.

Inputs

Histogram Settings

Input Default Description
CalculationMode Hybrid Selects the directional-pressure measurement mode.
StrengthPeriod 20 Historical comparison period for relative-strength detection.
StrengthMultiplier 1.50 Sensitivity threshold for highlighting stronger histogram bars.
NormalizationMode ATR Selects the normalization method used for histogram values.
ATRPeriod 14 ATR reference period when ATR normalization is selected.
HistogramWidth 3 Histogram bar width, from 1 to 5.

Power Summary Panel

Input Default Description
ShowPowerSummary true Shows or hides the Power Summary panel.
ShowText true Shows panel statistics and labels. When disabled, only the graphical display remains.
SummaryDelta false Switches between separate bullish/bearish totals and net directional pressure.
SummaryMinutes 5 Time window used to accumulate directional pressure, in minutes.
SummarySide Right Positions the panel on the left or right side of the indicator window.
SummaryIncludeLiveBar true Includes the currently forming candle in the summary.
SummaryX 12 Horizontal panel offset in pixels.
SummaryY 22 Vertical panel offset in pixels.
SummaryWidth 205 Panel width in pixels.
SummaryHeight 155 Panel height in pixels.

Power Summary Colors

Input Default Description
SummaryBackground Black Background color of the summary panel.
SummaryTextColor Silver Color of the panel text and reference line.
SummaryBullColor Lime Color representing bullish pressure.
SummaryBearColor Salmon Color representing bearish pressure.

Interpretation

  • Positive histogram values indicate estimated bullish directional pressure.

  • Negative histogram values indicate estimated bearish directional pressure.

  • Increasing histogram magnitude indicates stronger estimated directional pressure.

  • Decreasing magnitude indicates weakening directional pressure.

  • Darker histogram colors identify relatively stronger readings compared with recent activity.

  • Repeated alternation around zero may indicate changing directional pressure or less consistent market movement.

  • Sustained pressure on one side of zero may suggest directional dominance, but does not guarantee trend continuation.

Power Summary

The Power Summary panel provides an aggregated view of directional pressure over a selected time window.

Standard Mode (SummaryDelta = false)

  • Displays accumulated bullish and bearish pressure separately.

  • Allows comparison of directional dominance within the selected period.

  • Displays relative power shares when text is enabled.

Delta Mode (SummaryDelta = true)

  • Displays net bullish pressure minus bearish pressure.

  • Positive values indicate bullish dominance.

  • Negative values indicate bearish dominance.

  • Values near zero indicate relatively balanced accumulated pressure.

The percentages represent relative indicator power, not actual percentages of market buy and sell transactions.

Notes

  • The indicator operates in a separate window and does not modify the main price chart.

  • Automatic symmetric scaling keeps the zero line centered and adjusts to the visible histogram values.

  • The current candle may change direction, magnitude, and color until it closes.

  • The Power Summary includes candles according to their opening times within the selected window.

  • The summary panel can be positioned on either side of the indicator window.

  • The graphical summary remains available when text display is disabled.

  • The summary panel may be hidden automatically when the indicator window is too small.

  • Results depend on the instrument, timeframe, broker tick-volume data, and historical data availability.

  • Short custom timeframes require an external chart or data source. The indicator does not generate custom timeframes.

  • The indicator does not open, modify, or close trades.

  • The displayed pressure values are analytical estimates, not direct exchange order-flow measurements.

Version F2.0

  • Updated the product name to Tick Volume Pressure.

  • Standardized the source header, version information, and copyright attribution.

  • Organized input parameters into clearly defined groups.

  • Preserved the directional histogram and relative-strength highlighting.

  • Retained multiple calculation and normalization modes.

  • Maintained the configurable Power Summary panel.

  • Supported separate bullish/bearish summaries and net-delta visualization.

  • Retained optional text display and left/right panel placement.

  • Maintained automatic symmetric scaling with a centered zero line.

  • Updated the product documentation for MQL5 Showcase.

Disclaimer

Tick Volume Pressure is provided for analytical and educational purposes.

The indicator estimates directional pressure using available market data. It does not measure actual buyer-initiated or seller-initiated transactions, guarantee future price direction, or provide guaranteed trading signals.

Trading decisions should consider additional market context and appropriate risk management. Past market behavior does not guarantee future results.


Prodotti consigliati
Heiken Ashi Smoothed Strategy is a very simple but powerful system to get forex market trend direction. This indicator is actually 2 indicators in 1 pack, Heiken Ashi and Heiken Ashi Smoothed Moving Average both included. Because HA (Heiken Ashi) and HAS (Heiken Ashi Smoothed) are calculated in the same one system event with necessary buffers and loop only, so it is the FAST, OPTIMIZED and EFFICIENT HA having the combined indicator of MetaTrader 5. You can choose to display HA and HAS in the sam
Технический индикатор Universal Oscillator является комбинацией торговых сигналов самых популярных и широко используемых осцилляторов. Индикатор представлен гистограммами, а также линиями fast и slow MA, что позволяет расширить список получаемых торговых рекомендаций и работать как по тренду, так и в боковом движении рынка. Таким образом, гистограммы позволяют определить момент пробоя ценовых значений и движение в новой фазе рынка, а линии указывают на зоны перекупленности и перепроданности.  Ос
This indicator is the same as the popular Heiken Ashi Smoothed. The Heikin Ashi indicator for MetaTrader 5 already exists, but it has two disadvantages: It paints the candles not accurate. It's not possible to change the candle width. See also Heikin Ashi in MQL5 Code Base . In this version there are no such disadvantages.
The Accumulation / Distribution is an indicator which was essentially designed to measure underlying supply and demand. It accomplishes this by trying to determine whether traders are actually accumulating (buying) or distributing (selling). This indicator should be more accurate than other default MT5 AD indicator for measuring buy/sell pressure by volume, identifying trend change through divergence and calculating Accumulation/Distribution (A/D) level. Application: - Buy/sell pressure: above
Breakout Divergence RSI MultiFilter is a modular technical analysis indicator for MetaTrader 5 designed to identify Regular and Hidden RSI Divergences alongside confirmed trendline breakout continuation opportunities. Equipped with an algorithmic multi-layer filtering engine comprising 16 technical filter systems, this indicator provides an analytical bridge between momentum divergence recognition and structural price action confirmation. 1. TECHNICAL OVERVIEW AND ARCHITECTURE Breakout Diverge
MACD Advanced
Stanislav Korotky
This indicator provides you with MACD formula applied to volume-aware Accumulation/Distribution and OnBalance Volumes indicators. In addition to tick volumes it supports special pseudo-real volumes, synthesized for Forex symbols where real volumes are unknown. More details on the volume surrogates may be found in description of another indicators - TrueVolumeSurrogate and OnBalanceVolumeSurrogate (algorithm of the latter is used internally in MACDAD for AD and OBV calculation before they procee
TapeResilience — Volume Flow and Price Impact Analysis Volume Analysis | Order Flow | Price Impact | Market Response TapeResilience is a market activity analysis indicator for MetaTrader 5, designed to help traders study the relationship between trading volume, directional pressure, price impact, and subsequent market reactions. Instead of relying on traditional Buy/Sell signals alone, TapeResilience evaluates unusual market activity and observes how prices respond after significant directional
Rapid Pulse Scalper
Muhammad Mustajab Bajwa Muhammad Ri
Rapid Pulse Scalper Fast Signals. Precise Entries. Smart H1 Scalping Control. Rapid Pulse Scalper is a professional MT5 scalping indicator designed for traders who want clean, fast, and filtered Buy/Sell signals on major forex pairs using the H1 timeframe . It uses a multi-confirmation signal system to help reduce market noise and focus on higher-quality trading opportunities. This indicator is built for disciplined traders who want simple chart signals, structured trade levels, and smart trade
Buy Sell Smart
Syamsurizal Dimjati
BUY and SELL smart The BUY and SELL Smart Indicator is a next-generation trading tool engineered for precision scalpers, intraday strategists, and professional analysts who demand both speed and clarity in market visualization. It seamlessly integrates smart candle-based analytics, adaptive ATR logic, and real-time economic event awareness — giving you a fully synchronized view of market volatility and momentum. Through an elegant and optimized interface, FlashScalp delivers   instant signal fee
The Super Arrow Indicator provides non-repainting buy and sell signals with exceptional accuracy. Key Features No repainting – confirmed signals remain fixed Clear visual arrows: green for buy, red for sell Real-time alerts via pop-up, sound, and optional email Clean chart view with no unnecessary clutter Works on all markets: Forex, gold, oil, indices, crypto Adjustable Parameters TimeFrame Default:   "current time frame" Function:   Sets the time frame for indicator calculation Options:   Can
Type(1EMA,2DEMA,3TEMA) FastPeriod SlowPeriod SignalPeriod PriceApplied ( HIGH(H) LOW(L) OPEN(O) CLOSE(C) MEDIAN(HL) TYPICAL(HLC) WEIGHTED(HLCC) ) Deviate Up Deviate Down Deviate Bar What Is Moving Average Convergence/Divergence (MACD)? Moving average convergence/divergence (MACD, or MAC-D) is a   trend-following   momentum   indicator that shows the relationship between two   exponential moving averages (EMAs)   of a   security’s   price. The MACD line is calculated by subtracting the 26-peri
Smart Trend Trading System — MetaTrader 5 Dopo l'acquisto, inviami un messaggio su MQL5 per ricevere GRATUITAMENTE Smart Universal Expert Advisor, insieme al corso online, al manuale PDF e all'accesso al gruppo privato. STTS riunisce la direzione del trend, i segnali di entrata e uscita, le zone di inversione e i livelli di prezzo importanti direttamente sul grafico. Segui il sistema manualmente oppure collega un EA compatibile separato per eseguire le operazioni automaticamente con le impostazi
Gfx Institutional Order Flow Pro MT5 v3.02   Live results:  https://www.mql5.com/en/ Advanced Institutional Order Flow Analytics — analyzes market structure, liquidity, order blocks, imbalances, and institutional trading conditions. Adaptive Institutional Intelligence — dynamically evaluates market conditions and setup quality using multi-factor institutional analytics. Multi-Timeframe Market Confirmation — combines structure and directional information across multiple timeframes for stronger
DAILY OH/OL SDEV QUANT MODEL - STATISTICAL TRADING WITH PRECISION RISK MANAGEMENT TRADE WITH MATHEMATICAL CERTAINTY - KNOW YOUR EXACT STOP-LOSS AND TAKE-PROFIT BEFORE YOU ENTER This indicator analyzes 5,000+ days of price history to give you: Exact entry levels (sigma bands locked at daily open) Exact stop-loss distance (from M
TRI Visualizer
Yoshimi Mon 三 Ura
TRI Visualizer MT5 – Thermodynamic Market Analysis Overview The TRI (Thermal Range Indicator) Visualizer Enhanced is a rare market analysis indicator that goes beyond conventional technical analysis, applying principles of thermodynamics from physics. It interprets market price fluctuations as “thermodynamic energy,” enabling the highly accurate detection of subtle market changes that are often overlooked. Innovative Mechanisms 1. Dual Calculation Engines Classic TRI Mode Formula: |Close
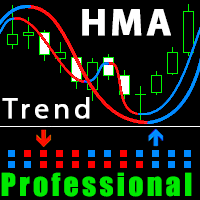
HMA Trend Professional MT5
Pavel Zamoshnikov
4.25 (4)
Improved version of the free HMA Trend indicator (for MetaTrader 4) with statistical analysis. HMA Trend is a trend indicator based on the Hull Moving Average (HMA) with two periods. HMA with a slow period identifies the trend, while HMA with a fast period determines the short-term movements and signals in the trend direction. The main differences from the free version: Ability to predict the probability of a trend reversal using analysis of history data. Plotting statistical charts for analyzi
Enhanced Elliott Wave Pro – Advanced Market Structure & Wave Analysis   Enhanced Elliott Wave Pro is a lightweight, institutional-grade MT5 indicator that eliminates chart clutter by detecting and displaying only the current, active market structure: the 1-2-3-4-5 Impulse wave and the subsequent A-B-C Correction.   Built with classic Prechter wave rules and ATR-adaptive pivot detection, it delivers clean, real-time wave counts without bogging down your terminal.   ――――――――――――――――――――――――――――
SafePair Manual Trader Pro MultiPairs SafePair Manual Trader Pro MultiPairs è un Expert Advisor avanzato per MetaTrader 5, progettato per supportare il trading manuale professionale, la gestione semi-automatica delle operazioni, il monitoraggio multi-simbolo, la pianificazione del rischio e l’analisi intelligente del mercato tramite un unico potente pannello di controllo. Questo EA è pensato per trader che necessitano di esecuzione manuale rapida, controllo strutturato del rischio, assistenza in
GoldPro Max
Taher Ahmed Mohamed Taha Elshafei
GOLDPRO MAX Advanced Multi-Timeframe and Smart Money Market Analysis for MetaTrader 5 GoldPro Max is a professional market analysis indicator for MetaTrader 5 designed to help traders study market direction, price structure, liquidity, market imbalance and potential trading areas from multiple perspectives. The indicator combines Multi-Timeframe Analysis, Smart Money Concepts, Market Structure, Liquidity Analysis, Order Blocks, Fair Value Gaps, Premium and Discount analysis, Smart Analytical Eng
MA Simulator — Simula le variazioni della media mobile prima che il prezzo raggiunga il livello specificato MA Simulator è un indicatore analitico per MetaTrader 5 che simula come cambierebbe una media mobile (MA) se la barra corrente raggiungesse un prezzo specificato. Puoi controllare in anticipo il livello calcolato della MA e la pendenza a quel prezzo, senza dover attendere che il prezzo raggiunga effettivamente quel livello. Lo strumento è progettato per supportare l'analisi nella valut
Passband Filter Pro Passband Filter Pro is a trend and cycle oscillator for MetaTrader 5. It is built on the Ehlers Super Passband Filter, a band pass filter that removes long term trend drift and short term noise so that only the dominant market cycle remains. The result is a clean oscillator with a color cloud that shows overbought and oversold conditions, cycle turns, and momentum on forex, gold, indices, stocks and crypto. Most traders enter too early or too late. Simple moving averages la
This indicator presents an alternative approach to identify Market Structure. The logic used is derived from learning material created by   DaveTeaches (on X) Upgrade v1.10: + add option to put protected high/low value to buffer (figure 11, 12) + add  Retracements  value to buffer when Show Retracements When quantifying Market Structure, it is common to use fractal highs and lows to identify "significant" swing pivots. When price closes through these pivots, we may identify a Market Structure S
Price Pressure Book
Joas Da Silva Veiga
Time and Sales, Time and Sales Indicator, Tape Reading, Pressure Book, Buy Sell Pressure, Tick Analysis, Market Pressure, Tick Data, Price Movement Analysis, Tick Strength, Momentum Analysis, Buy Sell Movement, Movement Sequences, Real-Time Tick Monitor, Trading Dashboard, Points Analysis, Customizable Alerts, MT5 Indicator Pressure Book - Tick Analysis and Buy/Sell Pressure Indicator for MT5 Pressure Book is a MetaTrader 5 indicator designed to monitor tick-based price movements and display es
Mini Chart (Canvas) is a lightweight, interactive sub-chart that overlays directly onto your main MetaTrader 5 chart. Designed for traders who want a compact, customizable view of another symbol or timeframe, this tool delivers real-time price action in a clean, resizable canvas — perfect for multi-symbol monitoring, scalping setups, or visual strategy overlays.  Key Features: • Multi-Symbol & Multi-Timeframe Support: Display any symbol and timeframe independently from the main chart. • Resizab
Order Flow Strength
Vincent Jose Proenca
Order Flow Strength (OFS) Descrizione: Indicatore che misura la forza del flusso di ordini analizzando dove si trova la chiusura all’interno del range di ogni candela, ponderata per il volume . Mostra pressione d’acquisto (verde) e pressione di vendita (rossa) in un pannello separato. Formula Order Flow Strength = Close − Low High − Low × Volume \text{Order Flow Strength} = \frac{\text{Close} - \text{Low}}{\text{High} - \text{Low}} \times \text{Volume} Order Flow Strength = High − Low Close − L
Auto Trade Journal with Screenshots Registra automaticamente ogni operazione con uno screenshot dell'istante esatto Tenere un diario di trading è l'abitudine che ogni mentore raccomanda e che quasi nessuno riesce a mantenere, perché farlo a mano è lento e facile da saltare. Un diario scritto può annotare i numeri, ma non potrà mai mostrare come appariva realmente il grafico nell'istante in cui si è entrati o usciti, ed è proprio lì che si trova la lezione. Auto Trade Journal with Screenshots lo
The Premier League indicator links the price in a cyclical-wave relationship. Crossing points can be used as potential market reversal points. Thus, all crossing points will be optimal points at which the movement changes taking into account the indicator period. But do not forget that the approach must be complex, the indicator signals require additional information to enter the market.
An indicator of pattern #31 ("Long Island") from Encyclopedia of Chart Patterns by Thomas N. Bulkowski. The second gap is in the opposite direction. Parameters: Alerts - show alert when an arrow appears   Push - send a push notification when an arrow appears (requires configuration in the terminal) GapSize - minimum gap size in points ArrowType - a symbol from 1 to 17 ArrowVShift - vertical shift of arrows in points   ShowLevels - show levels ColUp - color of an upward line ColDn - color of a d
**   All Symbols   x   All Timeframes   scan just by pressing scanner button ** Discount: The price is 100$, But now it is just 39$, Limited time offer is active. *** Contact me  to send you instruction and add you in "Trend Reversal group" for sharing or seeing experiences with other users. + FREE   Trading Utility MT5 - Big Update: 2026/10/22 Introduction: Trendlines are the most famous technical analysis in trading . Trendlines continually form on the charts of markets across all the differe
Renko + ATR Trend Envelope PRO+ (Non-Repainting) Renko + ATR Trend Envelope PRO+ is a clean trend-filter indicator that combines a Renko-style step histogram with an ATR-based trend envelope. It highlights trend direction, volatility expansion/contraction and trend reversals with arrows and optional alerts. This tool is ideal for: Trend following strategies Breakout confirmation Filtering false entries during choppy markets Visualizing volatility using ATR envelopes Key Features Renko-Style Hi
Gli utenti di questo prodotto hanno anche acquistato
Trend Sniper X
Sarvarbek Abduvoxobov
4.86 (43)
Trend Sniper X è un indicatore trend-following multi-timeframe per MetaTrader 5 che aiuta i trader a identificare la direzione del trend e i potenziali punti di inversione con chiarezza e precisione. per MT4: https://www.mql5.com/en/market/product/193245 Informazioni sul prezzo: Il prezzo attuale è promozionale ed è soggetto a modifiche con il rilascio di futuri aggiornamenti e nuove funzionalità. Offerta Bonus: Per ricevere GRATIS l'Auto-Trade Assistant EA per questo indicatore, invia un messa
Un nuovo Re in città - Indicatore + Gestione ordini (TP1 + TP2 + TP3) + Invio opzionale di segnali Telegram INCLUSO (GRATIS) (SISTEMA COMPLETO DI TRADING e SEGNALI) Il nostro miglior EA per l’Oro: Gold Slayer Questo indicatore include una strategia avanzata, un sistema di trading con gestione ordini personalizzabile e un sistema mean reversion che combina estensioni di envelope, supportato da molteplici filtri intelligenti di conferma come RSI per individuare ingressi di inversione ad alta proba
Zoryk Gold
Reda El Koutbane
4.78 (18)
ZORYK — Sistema avanzato di segnali XAUUSD per MetaTrader 5 Conosci sicuramente questa sensazione. Passi molto tempo ad analizzare l’oro. Aspetti il punto d’ingresso corretto. Finalmente apri l’operazione e il prezzo inizia immediatamente a muoversi contro di te. Chiudi troppo presto, sposti lo Stop Loss o esiti per alcuni secondi. Successivamente il mercato raggiunge esattamente l’obiettivo che avevi previsto inizialmente, ma senza di te nella posizione. Il problema non era sempre la direzione.
M5 Sniper
MeanFX
5 (4)
Porta il tuo vantaggio nel trading sotto i riflettori! M5 Sniper è un nuovo indicatore di MeanFX. Combina segnali di trading precisi con livelli TP/SL adattivi , creando così le migliori operazioni statistiche possibili! Il prezzo aumenta ogni 5 acquisti, il prossimo prezzo è di 69$ Scrivimi dopo l'acquisto per ricevere consigli/guida e un EA bonus Cosa lo rende diverso? Performance statistica comprovata su Gold XAUUSD ( funziona su quasi ogni asset , concentrandosi sulla padronanza di un singol
SuperScalp Pro
Van Minh Nguyen
4.54 (37)
SuperScalp Pro - Professional Multi-Layer Confluence Scalping System SuperScalp Pro è un indicatore di scalping avanzato che potenzia il Supertrend classico con diversi filtri intelligenti di conferma. Aiuta a individuare opportunità di trading Buy/Sell con una maggiore probabilità di successo, riducendo significativamente i falsi segnali. Le frecce Buy e Sell vengono visualizzate chiaramente direttamente sul grafico, insieme ai livelli di Stop Loss e Take Profit basati sull’ATR, calcolati autom
Gold Trend Coach MT5
Cristhian Alexander Gaibor Cuasquer
4.2 (10)
Gold Trend Coach è un indicatore di trend per l'oro (XAUUSD) su MetaTrader 5 con segnali di acquisto e vendita, stop loss e tre take profit confermati alla chiusura della candela (non ridisegna), un coach che ti guida dall'ingresso fino al TP3, un pannello multi-timeframe e avvisi sul telefono e su Telegram. Pensato per lo scalping su M1 e M5 e l'intraday su M15 nelle sessioni di Londra e New York. BONUS: EA di auto-trading GRATIS per Gold Trend Coach. Scrivimi dopo l'acquisto e ti invio l'EA ch
Entry Points Pro vi mostra dove entrare, dove mettere lo stop e con quale lotto operare — prima di piazzare l'ordine. PREZZO Ora 149 USD, ed è l'ultima copia a questo prezzo. Dopo il prezzo sale a 199 USD, e il prezzo finale è di 349 USD. Guadagno facendo trading sui mercati e lo dimostro, quindi non ho bisogno di vendere questo indicatore a tutti. È uno strumento per trader che ragionano con la propria testa, non un pulsante magico. La freccia compare alla chiusura della candela e non si ridis
GoldenX Entry MT5
VividMind Digital Solutions
5 (17)
GoldenX Entry è un indicatore per MT5 con un algoritmo adattivo Smart Entry Trend, un sistema di scoring dei segnali, un rilevatore del regime di mercato e un filtro di volatilità. Ogni segnale include un livello di ingresso calcolato, tre livelli di Take-Profit (TP1, TP2, TP3) e un livello di Stop-Loss. È costruito su più livelli analitici progettati per adattarsi a diverse condizioni di mercato, combinando un sistema analitico multilivello con un ottimizzatore integrato e un sistema di traccia
SMC Intraday Formula
VividMind Digital Solutions
5 (26)
Cominciamo con la verità. Nessun indicatore da solo ti renderà profittevole. Se qualcuno ti dice il contrario, ti sta vendendo un sogno. Qualsiasi indicatore che mostra frecce perfette di acquisto/vendita può essere reso impeccabile — basta ingrandire la giusta sezione della storia e catturare solo i trade vincenti. Noi non lo facciamo.  SMC Intraday Formula è uno strumento. Legge la struttura del mercato per te, identifica le zone a più alta probabilità e ti mostra esattamente come appare la t
Ultra Indicator
Ihor Otkydach
5 (1)
ULTRA è un indicatore tecnico che funziona secondo un approccio “tutto in uno”: analizza autonomamente il mercato, genera segnali di trading, visualizza i livelli per l’impostazione degli ordini stop-loss e suggerisce quando chiudere le operazioni per realizzare profitti o ridurre al minimo le perdite. In altre parole, non importa se non sai come analizzare il mercato, determinare i livelli — dove impostare lo stop-loss — o se hai difficoltà con la gestione del capitale. ULTRA farà tutto questo
Gann Made Easy è un sistema di trading Forex professionale e facile da usare che si basa sui migliori principi del trading utilizzando la teoria di mr. WD Gann. L'indicatore fornisce segnali ACQUISTA e VENDI accurati, inclusi i livelli di Stop Loss e Take Profit. Puoi fare trading anche in movimento utilizzando le notifiche PUSH. CONTATTAMI DOPO L'ACQUISTO PER RICEVERE GRATUITAMENTE LE ISTRUZIONI DI TRADING E OTTIMI INDICATORI EXTRA! Probabilmente hai già sentito parlare molte volte dei metodi d
M1 Sniper MT5
Oleg Rodin
5 (7)
M1 SNIPER   è un sistema di indicatori di trading facile da usare. Si tratta di un indicatore a freccia progettato per l'intervallo temporale M1. L'indicatore può essere utilizzato come sistema autonomo per lo scalping sull'intervallo temporale M1 e come parte del tuo sistema di trading esistente. Sebbene questo sistema di trading sia stato progettato specificamente per il trading sull'intervallo temporale M1, può comunque essere utilizzato anche con altri intervalli temporali. Inizialmente ho p
Prossimo aggiornamento — Versione 2.52 in arrivo! [NOVITÀ] Preparati a 4 nuove funzionalità principali progettate per migliorare la tua analisi di mercato e il tuo flusso di lavoro nel trading Portiamo l’analisi di mercato a un livello superiore con 4 nuove funzionalità progettate per soddisfare le tue esigenze di trading. Ecco le novità: 1. TRADE OVERVIEW DASHBOARD 2. CONFLUENCE AT ZONE 3. STRONG & WEAK HIGH/LOW 4. OTE 1. TRADE OVERVIEW DASHBOARD Una dashboard che ti aiuta a comprendere più fa
Adaptive Price Action Engine Acquista un indicatore, ricevi l'EA gratis Analisi Auto-Ottimizzata del Trend e dei Pattern Candlestick Multi-Timeframe I mercati cambiano continuamente e non tutti i pattern di Price Action hanno lo stesso valore in ogni condizione di mercato. Adaptive Price Action Engine è progettato per adattarsi alle condizioni di mercato in continua evoluzione, combinando struttura del trend, analisi Multi-Timeframe, pattern Candlestick e ottimizzazione statistica in un unico fr
FiboSniper Pro
Van Minh Nguyen
5 (4)
FiboSniper Pro – Multi-Filter Fibonacci System with Auto SL/TP and Control Panel FiboSniper Pro è un indicatore tecnico che combina Fibonacci Envelopes dinamici con diversi filtri di conferma per generare segnali Buy e Sell selezionati. I livelli di Fibonacci vengono calcolati sulla base di Moving Average e ATR e successivamente filtrati tramite ADX, EMA, RSI, ATR, Volume, Time e struttura delle candele. L’indicatore visualizza direttamente sul grafico i livelli automatici di Stop Loss e Take Pr
Auto Optimized SpeedAngle è un sistema di vettorizzazione del momento di livello istituzionale che elimina l'overfitting ( curve-fitting ) attraverso l'ottimizzazione continua Walk-Forward (WFO). Invece di affidarsi a input statici che si degradano quando i regimi di mercato cambiano, l'indicatore recalibra dinamicamente i suoi parametri utilizzando la validazione Out-of-Sample (OOS), assicurando che i segnali visualizzati rappresentino reali vantaggi statistici anziché anomalie storiche. Quadro
Boba Analysis Suite
Trade Ready Solutions LLC
5 (2)
Boba Analysis Suite Boba Analysis Suite è un indicatore di analisi per MetaTrader 5. Riunisce la struttura del mercato, le zone di prezzo rilevanti e il contesto generale del mercato in un’unica visualizzazione del grafico. Sviluppato sulla base dell’esperienza pratica come trader e formatore di trading, supporta un processo di analisi strutturato: valutare la direzione del mercato, individuare livelli importanti e analizzare congiuntamente più intervalli temporali. Analisi nel contesto del merc
ScalpPoint
Temirlan Kdyrkhan
ScalpPoint is a powerful trading companion designed to generate high-probability entry signals with dynamic TP/SL/DP levels based on volatility. Built-in performance tracking shows win/loss stats, PP1/PP2 hits, and success rates — all updated live. Key Features: Buy/Sell signals with adaptive volatility bands Real-time TP/SL/DP levels based on ATR Built-in MA Filter with optional ATR/StdDev volatility Performance stats panel (Success, Profit/Loss, PP1/PP2) Alerts via popup, sound, push, or emai
ARICoins
Temirlan Kdyrkhan
ARICoin is a powerful trading companion designed to generate high-probability entry signals with dynamic TP/SL/DP levels based on volatility. Built-in performance tracking shows win/loss stats, PP1/PP2 hits, and success rates all updated live. Key Features: Buy/Sell signals with adaptive volatility bands Real-time TP/SL/DP levels based on ATR Built-in MA Filter with optional ATR/StdDev volatility Performance stats panel (Success, Profit/Loss, PP1/PP2) Alerts via popup, sound, push, or email Cust
Crystal Heikin Ashi Signals
Muhammad Jawad Shabir
5 (5)
Crystal Heikin Ashi Signals—Professional Trend & Signal Detection Indicator Advanced Heikin Ashi Visualization with Intelligent Signal System for Manual & Automated Trading Final Price: $149 ---------> Price goes up $10 after every 10 sales . Limited slots available — act fast . Overview User Guide PDF Crystal Heikin Ashi Signals is a professional-grade MetaTrader 5 indicator that combines pure Heikin Ashi candle visualization with an advanced momentum-shift detection system. Designed for both m
Scalper Vault è un sistema di trading potente e completo, progettato per i trader che desiderano ottenere risultati costanti nel trading intraday. Questo indicatore ad alta precisione funge da sistema di trading autonomo, offrendo analisi di livello istituzionale sia per il mercato Forex che per le Opzioni Binarie. CONTATTAMI DOPO L'ACQUISTO PER RICEVERE I MIEI CONSIGLI DI TRADING E UN FANTASTICO BONUS! Eliminando le congetture e le complesse analisi manuali, Scalper Vault ti permette di concen
Azimuth Pro
Ottaviano De Cicco
5 (7)
Azimuth Pro V2: Synthetic Fractal Structure and Confirmed Entries for MT5 Overview Azimuth Pro is a multi-level swing structure indicator by Merkava Labs . Four nested swing layers, swing-anchored VWAP, ABC pattern detection, three-timeframe structural filtering, and closed-bar confirmed entries — one chart, one workflow from micro-swings to macro-cycles. This is not a blind signal product. It is a structure-first workflow for traders who care about location, context, and timing. Halloween P
Trend Catcher ind mt5
Ramil Minniakhmetov
5 (18)
INDICATORE TREND CATCHER L'indicatore Trend Catcher analizza i movimenti dei prezzi di mercato, utilizzando una combinazione di indicatori di analisi del trend proprietari dell'autore e personalizzati. Identifica la vera direzione del mercato filtrando il rumore a breve termine e concentrandosi sulla forza del momentum sottostante, sull'espansione della volatilità e sul comportamento della struttura dei prezzi. Utilizza inoltre una combinazione di indicatori personalizzati di smoothing e filtr
Volatility Master for MetaTrader is a real-time dashboard tool that scans up to  50 symbols  to identify high-volatility , trending markets instantly. With bullish/bearish signals, customizable alerts, and a user-friendly interface, it helps you avoid range-bound conditions and focus on high-probability trades. Clarity leads to confidence. Trade confidently and protect your capital effectively with this powerful dashboard. We don't offer free or bonus indicators in exchange of reviews from you.
Apex Patterns PRO Acquista l'indicatore - Ottieni GRATUITAMENTE l'Expert Advisor basato su di esso. Intelligenza auto-ottimizzante per pattern grafici e breakout Gli scanner di pattern tradizionali si basano su input fissi, registrando spesso prestazioni inferiori quando la volatilità e le strutture del mercato cambiano. Apex Patterns PRO è progettato per adattarsi alle mutevoli condizioni di mercato combinando il riconoscimento dei pattern grafici strutturali, il filtraggio del momentum e l'au
Unix Scalper
Issam Kassas
4 (4)
Unix Scalper — MetaTrader 5 Dopo l'acquisto, inviami un messaggio su MQL5 per ricevere GRATUITAMENTE Smart Universal Expert Advisor, insieme al corso online, al manuale PDF e all'accesso al gruppo privato. Individua il setup. Esamina il piano. Scegli come operare. UNIX Scalper riunisce analisi di mercato, indicazioni BUY/SELL/WAIT e livelli Entry, Stop Loss, TP1 e TP2 in un unico pannello organizzato. VISUALIZZA IL SEGNALE E IL PIANO • Indicazioni chiare: BUY, SELL o WAIT. • Livelli definiti: E
Neuro Poseidon MT5
Daria Rezueva
4.68 (53)
Neuro Poseidon is a new indicator by Daria Rezueva. It combines precise trading signals with adaptive TP/SL levels - creating best possible trades as a result! Message me and get  Neuro Poseidon Assistant  as a gift to automize your trading process! What makes it stand out? 1. Proven profitability on all assets and timeframes 2. Only confirmed BUY and SELL signals present on the chart 3. Adaptive TP & SL levels generated by the software for each trade 4. Easy to understand - suitable for al
SIO Oscillator: oscillatore auto-ottimizzante dello squilibrio di semivarianza Acquista l’indicatore e ricevi GRATIS l’Expert Advisor (EA) basato su di esso. La maggior parte degli oscillatori tratta ogni movimento di prezzo allo stesso modo. SIO separa la pressione rialzista da quella ribassista e misura lo squilibrio tra le due, mostrando quale parte controlla davvero il mercato: compratori o venditori. Quando lo squilibrio raggiunge un estremo, SIO genera un segnale chiaro con livelli di ingr
Atomic Analyst MT5
Issam Kassas
4.5 (64)
Atomic Analyst — MetaTrader 5 Dopo l'acquisto, inviami un messaggio su MQL5 per ricevere GRATUITAMENTE Smart Universal Expert Advisor, insieme al corso online, al manuale PDF e all'accesso al gruppo privato. Atomic Analyst riunisce l’azione del prezzo, la direzione del trend, i segnali di entrata e uscita, lo Stop Loss e diversi livelli di Take Profit direttamente sul grafico. INDIVIDUA IL SEGNALE. COMPRENDI IL CONTESTO OPERATIVO. Atomic Analyst organizza la sua analisi in informazioni visive ch
Smc Pro ToolKit
Talal N Z Aljarusha
5 (14)
SMC PRO TOOLKIT — SMART MONEY ANALYSIS & STRUCTURED TRADE PLANNING SMC Pro ToolKit is a professional Smart Money Concepts analysis workspace for MetaTrader 5. It combines market structure, multi-timeframe analysis, institutional price zones, setup evaluation, confirmation tools, volume context, alerts, and risk planning inside one organized chart environment. One workspace. Multiple layers of confirmation. One structured trading plan. OPEN COMPLETE USER GUIDE MULTI-CONDITION SETUP ENGINE At
Altri dall’autore
Floating P/L Price Line A lightweight MT5 indicator that displays your current floating profit or loss directly on the chart, following the current price level. Features: Real-time floating P/L display Profit and loss color indicators Symbol and Magic Number filters Customizable font, colors, and position Optional swap and account currency display Adjustable refresh interval A simple way to monitor open-position performance without opening the Trade tab.
FREE
Price to EMA Mean Histogram Version 1.10 for MetaTrader 4 Overview Price to EMA Mean Histogram is a separate-window oscillator that expresses the distance between price and a configurable moving-average mean as a percentage. It combines a close-price histogram, candle-extreme shadows, dynamic reference levels, and an optional fast EMA line in one compact view. The default configuration uses EMA 50 as the mean and EMA 14 as the fast reference. Visual Elements Bright bullish histogram: candle clos
Filtro:
Nessuna recensione
Rispondi alla recensione