 MetaTrader 5
 Experts
 Indicatori
 librerie
 Utilità
 Widget
 Regole
Guarda i video tutorial del Market su YouTube
Come acquistare un Robot di Trading o un indicatore
Esegui il tuo EA
hosting virtuale
hosting virtuale
Prova un indicatore/robot di trading prima di acquistarlo
Vuoi guadagnare nel Market?
Come presentare un prodotto per venderlo con successo
Nuovi indicatori tecnici per MetaTrader 5 - 129
 I segnali degli indicatori tecnici giocano un ruolo cruciale nell'apertura e nella chiusura delle transazioni sui mercati azionari e Forex. L'essenza degli indicatori è una trasformazione matematica del prezzo di un simbolo finanziario, finalizzata alla previsione dei cambiamenti futuri dei prezzi. Prova gli indicatori tecnici, per prevedere al meglio il comportamento del mercato e ricavarne dei guadagni.

ShiftedPriceDensitySet – Advanced Price Density Level Analysis with Time Shifts Input parameters TopLevelsToShow 10 Levels in each set NumberOfShifts 10 Number of sets ShiftSpacing 20 Shift step between sets BaseDepth 100 Starting depth DepthStep 20 Depth increment per set PriceStep 0.0001 Minimum price difference between levels PriceSource PRICE_CLOSE Source price type LevelColor clrDodgerBlue Level line color LevelWidth 2 Level line thickness Prefix "" Object prefix for namin
Pointer Trend Switch — precision trend reversal indicator Pointer Trend Switch is a high-precision arrow indicator designed to detect key moments of trend reversal based on asymmetric price behavior within a selected range of bars. It identifies localized price impulses by analyzing how far price deviates from the opening level, helping traders find accurate entry points before a trend visibly shifts. This indicator is ideal for scalping, intraday strategies, and swing trading, and performs equa
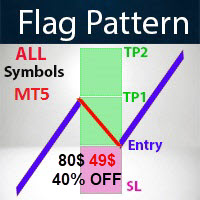
- Real price is 80$ - 50% Discount (It is 35$ now) Contact me for instruction, any questions! Related Product: Gold Trade Expert MT5 , Professor EA - Non-repaint - Lifetime update free I just sell my products in Elif Kaya Profile , any other websites are stolen old versions, So no any new updates or support.
Introduction Flag patterns are an important tool for technical traders. Flags are generally considered to be a period of consolidation where the price of a security is caught in a ran
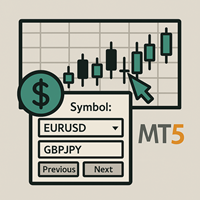
Chart Changer – Switch Symbols with One Click Boost your trading efficiency by quickly switching between multiple charts without hassle. This lightweight indicator displays customizable buttons for your favorite symbols, letting you jump between charts instantly with a single click. Key Features: Supports a flexible list of symbols you can set up in seconds Customizable button design (colors, font size, spacing) Works seamlessly on any chart timeframe Saves time and improves workflow for active
Includes:
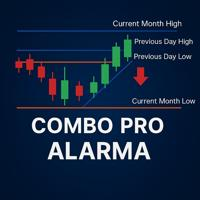
2 indicators + 2 Level 1 PDF books + 3+ hours of video course + 1 risk‑management template + 1 month VIP signals channel access This combo is part of our 3‑Level Book Set , designed to guide you step by step from the fundamentals to advanced trading. Perfect for anyone who wants to start strong with professional tools from day one. Explore all paths. Choose your journey. Build your strategy. What’s included in this Combo? 1. Indicators (single .ex5 file) MonthlyWeeklyDaily Previous Hi

Introducing VFI (Volume Flow Indicator) – a trading indicator that analyzes the relationship between volume and price movement to identify key trading opportunities. The indicator displays the strength and direction of volume flow, providing clear signals about potential entry and exit points. Signals are formed based on zero line crossovers, crossovers between the VFI line and its exponential moving average (EMA), and when the indicator exits overbought and oversold zones.
Attention! This stra
FREE
Hunter Spike
This indicator consists of two regression channels calibrated with the current movement of the synthetic index algorithm, for any Deriv or Weltrade broker.
Each channel has a signal, a target that alerts us when the price touches them, indicating buys on booms or gains and sells on crashes or pains.
-configuration for booms or gains: Channel zone 1 (30) Channel zone 2 (0)
-configuration for crashes or pains: Channel zone 1 (100) Channel zone 2 (70)
Zones freely configurable by

Quantum Profile System is a fully-fledged professional trading system with advanced algorithms, combining everything needed for confident and stable trading. This indicator merges trend direction analysis, volume concentration at key levels, dynamic adaptation to market volatility, and generation of trading signals with no delay or repainting. Quantum Profile System integrates a Linear Regression Volume Profile with an adaptive ATR-based trend channel. It includes an extended Volume Profile modu

Automate Your Strategy! Use the Daily Drop Analyzer Expert Advisor to automatically execute the strategy, with configurable filters, parameters, and order management.
Check it out here: Daily Drop Analyzer EA
The Step Analysis Indicator performs an automated backtest of a simple daily strategy: buy when the price drops a certain percentage from the previous close and sell at the same day's close (or vice versa for short strategy). It tests multiple entry percentages ("steps") and displays the
FREE

Automate Your Strategy! Use the Expert Advisor Daily Drop Analyzer to automatically execute the strategy, with filters, configurable parameters, and order management.
Check it here: Daily Drop Analyzer EA
Daily Drop Analyzer is a technical indicator for MetaTrader 5 that performs historical tests based on daily percentage drops. It analyzes up to 200 Market Watch symbols to identify recurring entry levels within a configurable range. The calculation uses daily candles (default: 120 days) and
FREE
Historical Pivot Zones - Fibonacci Indicator MT5 Automatically draws Fibonacci retracement and projection zones based on historical price pivots. This MT5 indicator intelligently selects pivot points from different timeframes (weekly, monthly, or 6-month ranges) and creates visual Fibonacci zones around key levels. Features include: Smart Mode Selection - Auto-adjusts based on your chart timeframe
Clean Visual Zones - Highlighted areas instead of just lines
Essential Fib Levels - 9 retrace
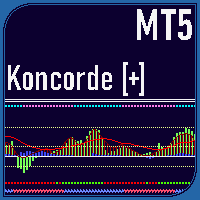
The Koncorde Plus Indicator is a sophisticated and versatile technical analysis tool for MetaTrader 5 (MT5), meticulously converted and enhanced from the acclaimed Koncorde [+] indicator on TradingView. Optimized for Forex volume analysis while preserving the original algorithm for all volume-based markets, it integrates six core components—four trend-based (RSI, MFI, Bollinger Bands, Stochastic) and two volume-based (Positive Volume Index (PVI) and Negative Volume Index (NVI))—to deliver a comp

Market Heartbeat is in your hand! *** Contact me to send you " Trend Finder indicator " FREE 1 and add you in "Market Heartbeats group" for sharing or seeing experiences with other users. ++ FREE 2 Trading Utility MT5
Introduction The Market Heartbeat indicator with a special enhanced algorithm (volume, money flow, cycle of market and a secret value) is a very repetitive trend finder with a high success rate . Interestingly, this Winner indicator indicates that the trend has change

** All Symbols x All Timeframes scan just by pressing scanner button ** *** Contact me to send you instruction and add you in "Head & Shoulders Scanner group" for sharing or seeing experiences with other users. + FREE Trading Utility MT5 Introduction: Head and Shoulders Pattern is a very repetitive common type of price reversal patterns. The pattern appears on all time frames and can be used by all types of traders and investors. The Head and Shoulders Scanner indicator Scans
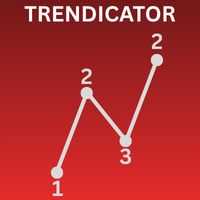
Functions Analyzes the current market trend Displays a numbering system based on trend structure (see below) Colors the chart background depending on trend direction Displays the ZigZag indicator Display Fibonacci Retracement with custom defined levels at the lates corrective trend movement Display Fibonacci Expansions with custom defined levels at the latest progressive trend movement Buffers for all relevant Trend parameters so EAs can access the trend information
Background Information The

Multi Anchor VWAP Pro MT5 – Pure Anchored VWAP | Adaptive σ-Bands | Smart Alerts Precision VWAP anchoring, no clutter. One-click anchors, dynamic σ-bands or %-bands, and instant multi-channel alerts—built for scalpers, intraday and swing traders who demand institutional-grade fair-value mapping. Public channel: CLICK HERE
Full User Guide – Need MT4? Click here WHY PROFESSIONAL TRADERS CHOOSE MULTI ANCHOR VWAP PRO VWAP is the institutional benchmark for fair value. Multi Anchor VWAP Pro stri
VFI Pro is an advanced implementation of the Volume Flow Indicator by Dubravaspb, enhanced with comprehensive analytical tools. The indicator displays the relationship between price and volume, showing clear signals for market entries and exits, while providing extensive analytics with detailed assessment of market conditions. It is optimized to work with any trading instruments and timeframes. Note! This strategy is not fundamental; each currency pair may require specific settings. Main Featu

Smart HORIZON — Volume + SMC Indicator Smart HORIZON is a TradingView indicator that combines volume profile levels with Smart Money Concepts (SMC) components to provide structured chart analysis.
It highlights market structure elements and key reference zones, making it easier to monitor price interaction with institutional-style levels. Core Features Volume Profile Levels Weekly & Monthly VAH (green dashed line) and VAL (red dashed line). Untested levels can be extended until touched. Optiona

Reversal Hunter PRO – Smart Detection of Market Turning Points Reversal Hunter PRO is a non-repaint custom indicator designed to detect potential market reversal zones using a unique combination of: RSI overbought/oversold signals Volume spike analysis Smart candlestick pattern recognition This tool is perfect for traders who want early confirmation of trend exhaustion and reversal opportunities on any time frame and pair , especially scalpers and swing traders. Features: Non-repa
FREE
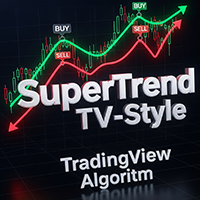
SuperTrend TV-Style replicates the classic SuperTrend indicator from TradingView, now available for MetaTrader. It uses ATR-based volatility to detect trend direction and plot dynamic buy/sell zones on the chart. Green line: uptrend Red line: downtrend Arrows: buy/sell signals at trend shifts Customizable source price (HL2, HLC3, etc.) and ATR method Simple, fast, and familiar - ideal for traders switching from TradingView or looking for a clean trend-following tool.
FREE

This simple yet powerful indicator identifies the Asian session, its levels, the London session, the NY trap, and the timing shadows where the algorithm tends to manipulate and move. Fully customizable colors and times.
Not sure when to enter a trade?
Wait for price to grab liquidity... and strike with precision.
This indicator brings together all key elements of the daily cycle into a single visual tool. Identify zones where price is likely to seek liquidity before making its true move
Alpha Edge Pro – The Manual Trader’s Edge - If you prefer trading manually without stress, this indicator is for you. Get your copy now. Tired of missing the big moves or holding on to losing trades too long? Alpha Edge Pro is your new secret weapon. This high-performance, plug-and-play MT5 indicator gives you crystal-clear BUY and SELL signals — so you can trade with confidence, precision, and speed. If you prefer manual trading profitably , this indicator is made for you. Alpha Edge Pro does
FREE
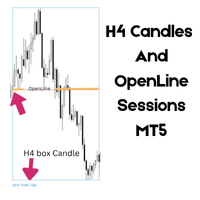
H4 Candles And OpenLine Sessions MT5 is a professional indicator for MetaTrader 5 that visualizes your trading sessions and key 4-hour candle ranges with clear, customizable boxes and stylish opening price lines. Highlight Asia , London , and New York market sessions plus up to 6 custom H4 candle ranges — each with fully adjustable colors, line styles, thickness, opacity, and labels. The powerful OpenLine feature marks the exact opening price for each session or H4 range, helping you instantly s

Adaptive SR Zones – Breakout Edition Adaptive SR Zones is a next-generation MetaTrader 5 indicator that automatically maps support and resistance zones and tracks breakout activity in real time. Designed for traders who rely on market structure and zone confluence, it combines multi-timeframe analysis , breakout confirmation logic , and customizable alerts into one powerful tool. No repainting. Core Features Dynamic Support & Resistance Mapping Detects zones from swing highs/lows and reaction po

Logic Trade Solution Indicator (Standalone)
Idea by Suresh Dhuraisami | Code by Rafilathif Description The Logical Trading System (LTS) is a powerful multi-timeframe indicator for MetaTrader 5, designed around the concept of Valid Reversal Zones (VRZ). It generates precise trading signals and delivers comprehensive alerts, ideal for traders who value structured price action and zone-based strategies. Key Features VRZ Zone Detection: Identifies high-probability reversal zones using swing hig
FREE

Канал фрактальной дивергенции базируется на паттернах фрактальной дивергенции , представляя их в виде канала, границы которого изменяются в момент появления очередного паттерна. Верхняя граница канала соответствует верхней части последнего найденного медвежьего паттерна фрактальной дивергенции. Нижняя граница канала - это нижняя часть последнего найденного бычьего паттерна (см. скриншот 1). По отношению к индикатору FractalDivergence_Patterns , канальная версия обладает теми же параметрами,
FREE

Time your trades perfectly with the Ultimate Candle Timer . This professional tool for MetaTrader 5 gives you a precise and smooth countdown to the next candle without any lag. It's built for traders who need reliable performance and runs efficiently without slowing down your computer. Unlike other timers, it provides a steady, second-by-second countdown that works perfectly even when the market is slow.
FREE

Purpose : The AllAverages indicator plots a moving average line on the chart, with options to select from a wide range of MA types and price applications. It also displays buy and sell signals as arrows when the trend changes, and supports alerts (sound, email, push notifications) for these signals. Key Features : Supports multiple moving average types (e.g., SMA, EMA, HMA, TEMA, etc.). Allows customization of the price type (e.g., Close, Open, High, Low, Heiken Ashi variants). Displays a colore

The Color Change MA is a versatile custom indicator designed for MetaTrader 4, providing clear visual signals on trend direction and momentum. It features a Moving Average (MA) line that intelligently changes color based on the MA's position relative to the current candle's open and close prices, with an optional but powerful RSI (Relative Strength Index) filter for enhanced confirmation. Key Features: Dynamic Color-Changing MA: Green: Indicates a bullish bias. By default, this occurs when t

This indicator is deliberately constructed to avoid repainting. Once a candle has closed, the output it produces remains fixed and unchanged. This behavior ensures accuracy during backtesting and provides reliability in real-time strategy execution.
Unlike traditional methods such as linear or polynomial regression, kernel-based methods don't assume any specific form or distribution for the data. Instead, they rely on a kernel function —a mathematical tool that assigns influence to each nearb
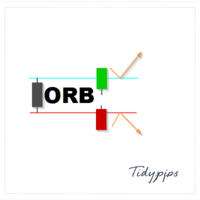
The Market Open ORB Indicator is a powerful and customizable tool designed for traders seeking to capitalize on the Opening Range Breakout (ORB) strategy. This indicator identifies the high, low, and midline of a user-defined time window after the market opens, providing clear visual cues for potential buy or sell opportunities when the price breaks out of these levels. Tailored for MetaTrader 5, it offers unmatched flexibility and precision for forex, stocks, and other markets. Key Features Cus

Fractal Pivot Lines — Indicator Overview Fractal Pivot Lines is a custom trend-structure indicator for MetaTrader 5 .
It automatically connects key fractal highs and lows with dynamic lines so you can see how price is respecting local structure, building channels, and preparing for potential reversals. Instead of staring at dozens of candles and guessing where the real pivots are, the indicator turns fractals into clear support/resistance paths and trend channels . What the Indicator Does

The Jurik Moving Average (JMA) is a sophisticated, adaptive moving average designed to reduce lag while maintaining smoothness. Unlike traditional moving averages (e.g., SMA, EMA), JMA adjusts dynamically to market volatility, making it more responsive to price changes. It’s particularly useful in trading for identifying trends and generating signals with less noise. Input Parameters : inpJmaPeriod (default: 14): The period for calculating the JMA and ATR. inpJmaPhase (default: 0): Controls the

Generates Buy/Sell Signals : Buy Signal : An upward arrow ( DRAW_ARROW ) appears when the JMA changes from a downtrend (red) to an uptrend (green). Sell Signal : A downward arrow ( DRAW_ARROW ) appears when the JMA changes from an uptrend (green) to a downtrend (red). Arrows are placed below (buy) or above (sell) the candle for visibility. Trend Following : Green Line : Indicates an uptrend. Consider holding or entering long positions. Crimson Line : Indicates a downtrend. Consider holding or en
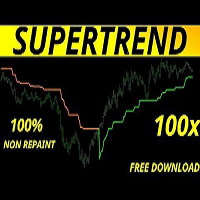
Purpose : The SuperTrend indicator tracks price trends, plotting a line that follows the trend direction (up or down) and optionally fills the area between the trend line and the closing price Plots : SuperTrend Line : A colored line (green for uptrend, red for downtrend) plotted below the price in uptrends and above in downtrends. Filling : Optional filled area (bisque/pale green) between the SuperTrend line and the closing price, shown only if Show_Filling is true. Logic : Calculates ATR usin

Bears vs Bulls Market Sentiment Indicator
DESCRIPTION: The Bears vs Bulls Market Sentiment Indicator is a powerful tool for analyzing market sentiment and identifying potential trading opportunities. This indicator combines multiple technical analysis methods to provide a clear visual representation of whether bulls or bears are dominating the market.
KEY FEATURES: • Dual Histogram Display: Shows both bullish and bearish strength simultaneously • Multi-Indicator Analysis: Combines RSI, Moving
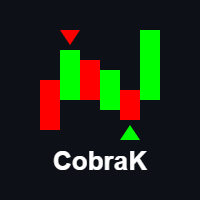
软件名称: CobraK 软件简介: CobraK是一款专为交易者设计的裸K指标,基于裸K线价格行为分析,能够精准识别多种经典K线形态,包括锤子、吞没、平底、早晨之星、黄昏之星和底部孕线等。当这些关键形态出现时,软件会在K线上自动标识出向上或向下的箭头符号,直观地提示交易机会,帮助交易者快速做出决策,把握市场节奏,提升交易效率和成功率。 核心功能: 精准识别形态:通过先进的算法,对K线形态进行实时分析,确保形态识别的准确性和及时性。 直观标记提示:在K线上以箭头符号清晰标识形态方向,向上箭头代表潜在的买入机会,向下箭头代表潜在的卖出机会。 多形态支持:涵盖多种经典且实用的K线形态,满足不同交易策略的需求。 简洁易用:界面简洁,操作直观,无需复杂设置,新手也能快速上手。 实时更新:与市场数据同步更新,确保交易者能够第一时间获取关键信息。 适用人群: 初入交易市场的新人,帮助快速掌握K线形态分析技巧。 有一定经验的交易者,作为交易决策的辅助工具,提升交易效率。 专业交易团队,用于快速筛选潜在交易机会,优化交易策略。 软件优势: 高效识别:快速捕捉关键形态,节省分析时间。 精准提示:通过箭

ARIPoint is a powerful trading companion designed to generate high-probability entry signals with dynamic TP/SL/DP levels based on volatility. Built-in performance tracking shows win/loss stats, PP1/PP2 hits, and success rates all updated live. Key Features: Buy/Sell signals with adaptive volatility bands Real-time TP/SL/DP levels based on ATR Built-in MA Filter with optional ATR/StdDev volatility Performance stats panel (Success, Profit/Loss, PP1/PP2) Alerts via popup, sound, push, or email Cu

Momentum Hunter – Indicatore Avanzato di Momentum senza Ridisegno Momentum Hunter è un indicatore potente e affidabile, progettato per rilevare nuovi impulsi e aiutare i trader a catturare i movimenti di mercato con precisione. Ottimizzato appositamente per il timeframe M1 , funziona perfettamente anche su timeframe più alti, risultando ideale sia per scalper che per swing trader. Caratteristiche principali: Nessun ridisegno e nessun ritardo : I segnali sono stabili e le frecce appaiono solo
FULL FOREX MARKET VIEW Indicatore Dashboard MT5 Questo è un indicatore personalizzato creato per la piattaforma MT5, progettato per offrire ai trader una visione completa di ciò che accade sul mercato. Utilizza dati in tempo reale per analizzare il mercato e mostra tutte le informazioni necessarie per fare trading con successo. INSTALLAZIONE: Prima di collegare questo indicatore al grafico, vai nel pannello “Osservazione del Mercato” di MT5 e NASCONDI tutte le coppie di valute che non ti servono

Scopri la Strategia delle "Agulhadas" Ispirata a concetti popolari nel mercato brasiliano, questa strategia combina cinque indicatori tecnici per identificare potenziali punti di entrata e uscita basati su tendenza, forza del mercato e momentum. Tra gli indicatori utilizzati c’è il famoso Indice Didi, sviluppato da Odair Aguiar, noto per rappresentare l'incrocio delle medie mobili. Scarica qui lo Scanner Azionario Indicatori Utilizzati Indice Didi ADX Bande di Bollinger Trix Stocastico Come Funz
FREE

Semplicemente, puoi iniziare a fare trading quando il movimento dei numeri bianchi — noti come "pips" — inizia ad apparire accanto alla candela corrente. I "pips" bianchi indicano che un'operazione di acquisto o vendita è attualmente attiva e si sta muovendo nella direzione corretta, come indicato dal colore bianco. Quando il movimento dei pips bianchi si interrompe e diventa di colore verde statico, questo segnala la fine della spinta attuale. Il colore verde dei numeri rappresenta il profitto

Sblocca potenti intuizioni di mercato con questo indicatore che mostra un libro ordini visivo sul grafico, ispirato al Visual Book di Profit di Nelogica. Visualizza barre orizzontali che rappresentano i volumi di acquisto (blu) e di vendita (rosso), con evidenziatura in giallo per i volumi elevati, facilitando l'identificazione delle zone ad alta liquidità. Il prezzo tende a muoversi verso le aree con le maggiori concentrazioni di ordini, rendendolo uno strumento essenziale per individuare livel
FREE
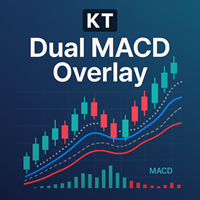
Due MACD di timeframe diversi su un solo grafico KT Dual MACD Overlay combina un MACD veloce del grafico attivo con un MACD più lento proveniente da un timeframe superiore e mostra entrambi direttamente sul prezzo. In questo modo il momentum di breve periodo e la direzione del trend generale sono riuniti in una vista coordinata. Le linee verticali blu e arancioni evidenziano l'inizio delle fasi rialziste e ribassiste, mentre ulteriori incroci MACD aiutano a individuare opportunità di continuazio
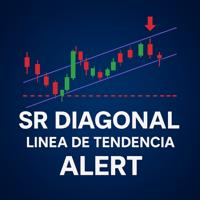
Linee di tendenza al livello successivo! Questo indicatore automatizza il disegno di linee di tendenza diagonali basate su pivot configurabili e mostra avvisi visivi sul grafico quando il prezzo interagisce con esse. Dimentica il disegno manuale: ogni volta che il prezzo tocca o rompe la proiezione, vedrai la notifica direttamente sulla candela. Caratteristiche principali Pivot flessibile: regola il numero di barre ( PivotBars ), anche se consigliamo di mantenere il valore predefinito per salvag

Indicatore Market Structure ICT 1. Struttura di Mercato Automatizzata Il vantaggio principale è la riduzione degli errori dovuti all'interpretazione soggettiva. Identificazione precisa del trend: Identifica automaticamente BOS (Rottura della Struttura) per la continuazione e CHoCH (Cambio di Carattere) per l'inversione. Classificazione degli Swing: L'utente può scegliere il tipo di struttura (breve, medio o lungo termine), adatto sia agli Scalper che agli Swing Trader. 2. Dashboard Professional

AI Core Trading Master Pro - Complete Technical Analysis Suite Transform your trading with the most comprehensive technical analysis indicator for MT5, featuring 10 proven indicators, AI predictions, and a professional real-time dashboard. Core Features 10 High-Performance Technical Indicators: RSI (71.6-87.1% win rate) with divergence analysis Bollinger Bands (74.3-81.3% win rate) with squeeze detection MACD (60-75% win rate) with histogram analysis Stochastic (65-78% win rate) with overbought
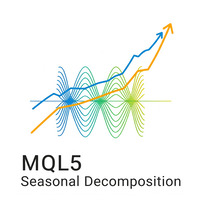
L' Indicatore di Decomposizione Stagionale per MQL5 è uno strumento potente progettato per aiutare i trader a identificare e analizzare le tendenze sottostanti e i pattern stagionali all'interno dei dati delle serie temporali finanziarie. Decomponendo i movimenti di prezzo nei loro componenti principali, questo indicatore fornisce un quadro più chiaro delle dinamiche di mercato, consentendo decisioni di trading più informate. Caratteristiche Principali: Linea di Tendenza: Visualizza chiaramente

Range Filtered AlgoAlpha è uno strumento di analisi tecnica progettato per identificare potenziali opportunità di trading analizzando la volatilità del mercato. Questa versione MetaTrader dell'indicatore originale TradingView di AlgoAlpha combina diversi metodi analitici per fornire una valutazione visiva del mercato. Caratteristiche tecniche
Utilizza il filtraggio di Kalman (Kalman Filtering) per livellare i prezzi
Include bande basate sull'ATR (ATR-based Bands) per misurare la volatilità
Inte
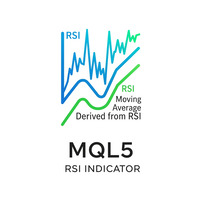
RSI con Media Mobile Integrata Questo indicatore combina la potenza dell'Indice di Forza Relativa (RSI) con la sua media mobile integrata, offrendo una visione più chiara e dinamica del momentum del mercato. A differenza dell'RSI standard, che può essere soggetto a falsi segnali, questa versione migliorata aiuta i trader a confermare le tendenze e a identificare potenziali inversioni con maggiore fiducia. Caratteristiche Principali: Media Mobile Integrata: L'indicatore traccia una media mobile p

Pendenza della Media Mobile con Segnale Questo indicatore innovativo va oltre una semplice media mobile fornendo un'analisi dinamica e potente della sua pendenza. Calcola e visualizza non solo la pendenza di una media mobile, ma anche una media mobile di tale pendenza, creando un segnale altamente efficace per i cambiamenti di tendenza e i cambiamenti di momentum. Questa analisi a doppio strato aiuta i trader a filtrare il rumore e a identificare la vera forza della tendenza e le potenziali inve

Media Mobile con Multi-Timeframe e Impostazioni Personalizzabili La Media Mobile è uno strumento fondamentale per ogni trader. Il nostro indicatore avanzato di Media Mobile va oltre lo standard, offrendoti una flessibilità e un controllo senza precedenti. Questo indicatore ti consente di visualizzare una media mobile da qualsiasi timeframe sul tuo grafico attuale, fornendo una prospettiva unica e aiutandoti a individuare tendenze che altrimenti potresti perdere. Caratteristiche principali: Funzi

Presentiamo il STC MT5, un indicatore di trading avanzato progettato per analizzare efficacemente le tendenze e i cicli di mercato, rendendolo uno strumento essenziale per i trader che cercano di migliorare il loro processo decisionale. Questo indicatore è utile sia per i trader principianti che per quelli esperti che desiderano identificare punti di ingresso e uscita ottimali basati su movimenti ciclici dei prezzi e cambiamenti di momentum. Il STC MT5 offre vantaggi significativi fornendo segna
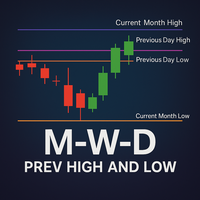
Potenzia la tua analisi con un solo sguardo! Questo indicatore disegna automaticamente i livelli chiave in cui il prezzo ha recentemente rimbalzato o rotto, fornendo zone oggettive di supporto e resistenza senza doverle tracciare manualmente. Basta applicarlo al tuo grafico per vedere le linee degli alti e bassi precedenti di ciascun periodo. Cosa rappresenta ogni linea? Previous Month High
‣ Massimo del mese precedente: prezzo più alto registrato nel periodo mensile precedente. Previous Month

BreakEven Finder è un indicatore gratuito e leggero per MetaTrader 5, progettato per scalper e trader intraday. Analizza le posizioni aperte e mostra chiaramente il punto di pareggio sul grafico. Caratteristiche principali: Mostra il livello di pareggio per ogni posizione Calcolo automatico della media su più operazioni Interfaccia semplice e intuitiva Funziona su qualsiasi strumento e timeframe Grafica pulita e minimale Ideale per: Scalper Trader intraday Trader con PnL fluttuante Vanta
FREE

ElohimTrade Ultimate Confluence Pro — L'indicatore di confluencia multi–timeframe più potente al mondo Scopri tutto il potenziale del tuo trading con ElohimTrade Ultimate Confluence Pro : lo strumento di analisi tecnica più avanzato, creato per trader che cercano precisione, affidabilità e una visione profonda del mercato. Questo indicatore avanzato unisce la potenza di più indicatori leader — EMA, RSI, MACD, Bande di Bollinger, Stocastico e ADX — analizzandoli contemporaneamente su tre timefram
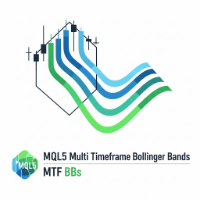
Indicatore Bande di Bollinger Multi-Timeframe Migliora la tua analisi di trading con il nostro indicatore Bande di Bollinger Multi-Timeframe per MQL5! Questo potente strumento ti consente di visualizzare le Bande di Bollinger su cinque diversi timeframe contemporaneamente, utilizzando la stessa impostazione del periodo . Ottieni una comprensione più chiara della volatilità del mercato e delle potenziali inversioni di tendenza a colpo d'occhio. Semplifica la tua analisi multi-timeframe e prendi d
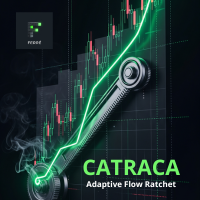
Title: Adaptive Flow Ratchet - The Intelligent Trailing Stop Tired of being stopped out on a minor pullback only to watch the price explode in your analyzed direction? Have you ever given back most of the profits from a great trade because your stop was too wide when the trend lost steam? The Adaptive Flow Ratchet by Dan Ferre is designed to solve exactly these problems. This is more than a trailing stop; it's a trade management system that adapts in real-time to the true strength of the market.

VWAP Ultimate Pro MT5 – Persistent Anchored VWAP | Session VWAP | Dynamic Bands & Smart Alerts Elevate Your Trading Edge with an Advanced, Professional VWAP Indicator
WHY PROFESSIONAL TRADERS CHOOSE VWAP ULTIMATE PRO?
VWAP (Volume-Weighted Average Price) is widely used by institutions and professional traders to evaluate fair value, market positioning and intraday bias. VWAP Ultimate Pro MT5 brings this workflow to retail traders through an all-in-one indicator combining multi-mode VWAP, pers
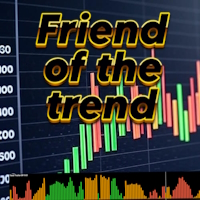
Friend of the Trend: Your Trend Tracker Master the market with Friend of the Trend , the indicator that simplifies trend analysis and helps you identify the best moments to buy, sell, or wait. With an intuitive and visually striking design, Friend of the Trend analyzes price movements and delivers signals through a colorful histogram: Green Bars : Signal an uptrend, indicating buying opportunities. Red Bars : Alert to a downtrend, suggesting potential selling points. Orange Bars : Represent cons
FREE

Hello traders!
I'm here to introduce you to a new project called (Scalpeer Deriv)
which is based on trend hunting on M5 / M15 / M30 / H1 and H4 time frames!!!
for DERIV pairs (SYNTHETIC INDICES)
Volatility 75, Boom 1000, Crash 1000, Crash 500, Boom 500, Crash 300, and Boom 300
with Volume 5 and Time 500 parameters
providing buy and sell signals to hunt a good trend!!!
Highly recommended!
The first 5 copies will cost $149 / Final price $299!!
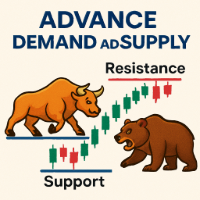
This Demand & Supply Zone Indicator with Volume Filtering is a technical analysis tool for MetaTrader that identifies key price zones where buying (demand) or selling (supply) pressure is concentrated. It uses fractals, volume analysis, and price action to detect and highlight these zones on the chart. Key Features: Zone Detection Based on Fractals Identifies demand (support) and supply (resistance) zones using fractal patterns (local highs/lows). Zones are formed from open prices ar
FREE

RSIBandsTREND is a custom trend-focused indicator that enhances the classic RSI approach by visualizing dynamic upper and lower bands based on RSI calculations.
It plots three clean bands (upper, lower, and midline) directly on the chart, helping traders identify overbought and oversold zones with precision. Features: Three-band system: upper, lower, and center RSI lines EMA-smoothed RSI band calculation Clear trend zone visualization on chart Works on all timeframes (M1 to Monthly) Ideal
FREE
ZeroLag T 3 Signal Suite The Ultimate All-in-One Trading Companion for XAU USD 15-Minute Charts Join the Group Chat - Community Group Download the Free Simple Trade Utility making your pending order placement simple. Unlock the power of precision trading with the ZeroLag T 3 Signal Suite —an advanced indicator designed for traders who demand speed , accuracy, and actionable insights . Built on the renowned Zero Lag T 3 smoothing algorithm, this tool delivers lightning-fast trend d

Overview
SmartComboSignalDashboard is a multi-strategy signal scanner and visual dashboard for MetaTrader 5. It combines six technical indicator combinations to detect Buy/Sell opportunities and visualize them on the chart. It includes:
Signal table with real-time updates
Push notifications (with time-frame-based throttling)
Visual on-chart entry levels (Buy/Sell stops)
Interactive buttons per strategy for toggling entry levels
Setup & Installation
Open MetaEdito

This is a powerful indicator that groups multiple Expert Advisors (EAs) by strategy and displays aggregated performance results directly on the chart. Grouping is optional — you can use it even without organizing EAs into groups. It automatically calculates and visualizes performance within a specified aggregation period. You can exclude specific magic numbers or aggregate results across multiple magic numbers as a group. Additionally, by using partial string matching based on EA names, you can

The algorithm scans the price history on a specified timeframe to identify relevant Order Blocks. Key features of EA_OB_v10.0: Intelligent analysis of Order Blocks across multiple timeframes Trend filtering using a secondary timeframe Graphical display of OB zones on the chart for better readability Flexible configuration for entry, Stop Loss, Take Profit, trailing stop, risk management, etc. Built-in protection against excessive losses (daily or cumulative) Optimized examples provided for XAUUS
tak.VWAP – Volume Weighted Average Price A reliable and lightweight VWAP indicator designed for traders who require flexibility and visual clarity. Key Features: Two calculation modes: Rolling VWAP: Based on a configurable number of candles. Daily VWAP: Automatically resets at the start of each trading day. Fully customizable line style : color, width, visibility, and line type. Clean input structure with grouped sections for ease of use. EA-friendly : exposes buffer for use in Expert Advisors

Liquidity Swings SMC Zones Liquidity Swings SMC Zones is a professional indicator for MetaTrader 5 that automatically detects, displays, and updates liquidity-based swing high and swing low zones directly on your chart. This tool is designed for traders who use Smart Money Concepts (SMC), supply and demand, or support and resistance trading methods. Features Automatic Zone Detection:
Identifies significant swing highs and swing lows based on customizable pivot settings. Clear Visual Zones:
Hi

Unlock Market Insights: Dynamic Trend Analysis with Statistical Precision for MT5 Are you seeking a deeper understanding of market movements? Many traditional tools may not fully capture the complex, non-linear dynamics often seen in financial markets. This can sometimes lead to uncertainty in identifying subtle trend shifts. Introducing Adaptive PolyBands Optimizer – an advanced MQL5 indicator designed to enhance your market analysis. Unlike some conventional tools, Adaptive PolyBands Optimizer
FREE
Sai perché MetaTrader Market è il posto migliore per vendere strategie di trading e indicatori tecnici? Non c'è bisogno di pubblicità o di protezione del software, nessun problema di pagamento. Tutto ciò è fornito da MetaTrader Market.

Ti stai perdendo delle opportunità di trading:
- App di trading gratuite
- Oltre 8.000 segnali per il copy trading
- Notizie economiche per esplorare i mercati finanziari
Registrazione
Accedi
Accetti la politica del sito e le condizioni d’uso
Se non hai un account, registrati