Guarda come scaricare robot di trading gratuitamente
Ci trovi su Facebook!
Unisciti alla nostra fan page
Unisciti alla nostra fan page
Ti è piaciuto lo script? Provalo nel Terminale MetaTrader 5
- Visualizzazioni:
- 16147
- Valutazioni:
- Pubblicato:
- Aggiornato:
-
Hai bisogno di un robot o indicatore basato su questo codice? Ordinalo su Freelance Vai a Freelance
Author: mandorr
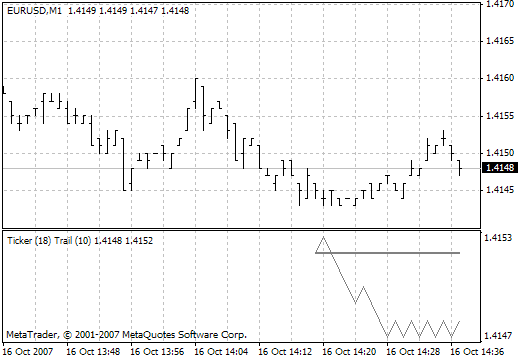
Here, the trail line is used instead of the signal line. Trail is the line that is distanced from the current price no more than the trailing length. If the difference between the price and the trail line is less than the trailing length, then the trail line does not move. The trail line is a good filter with a delay by price and not by time, unlike the signal line.

Calculated as the difference between the fast and the slow trail. Since this is an oscillator, there is no ticker line on the chart. The indicator values vary in the range from -100 to +100. The change of the TrailCD line direction can serve as a trading signal. In another version, the signal is the zero line crossing. A very strong signal is the indicator line reaching the value of -100 or +100. It is necessary to accumulate a quite large number of bars for the indicator signals to become significant.
Here, the trail line is used instead of the signal line. Trail is the line that is distanced from the current price no more than the trailing length. If the difference between the price and the trail line is less than the trailing length, then the trail line does not move. The trail line is a good filter with a delay by price and not by time, unlike the signal line.

Calculated as the difference between the fast and the slow trail. Since this is an oscillator, there is no ticker line on the chart. The indicator values vary in the range from -100 to +100. The change of the TrailCD line direction can serve as a trading signal. In another version, the signal is the zero line crossing. A very strong signal is the indicator line reaching the value of -100 or +100. It is necessary to accumulate a quite large number of bars for the indicator signals to become significant.
Tradotto dal russo da MetaQuotes Ltd.
Codice originale https://www.mql5.com/ru/code/7492
 Ticker MACD
The chart contains the main line (the difference between the fast EMA and the slow EMA, applied to the Ticker line) and the signal line (obtained by applying the SMA to the main line).
 Ticker Awesome Oscillator
It is calculated as the difference between two simple moving averages: SMA(5) and SMA(34). Type of the chart: histogram with green and red colored bars.
 Trend continuation factor2
This indicator is created to determine the trend and its direction.
 TrendStrength
The indicator used to determine the global trend.