Unisciti alla nostra fan page

Cumulative_Volume - indicatore per MetaTrader 5
- Visualizzazioni:
- 7595
- Valutazioni:
- Pubblicato:
-
 Ti stai perdendo delle opportunità di trading:
- App di trading gratuite
- Oltre 8.000 segnali per il copy trading
- Notizie economiche per esplorare i mercati finanziari
Registrazione AccediAccetti la politica del sito e le condizioni d’uso
Se non hai un account, registrati -
 Hai bisogno di un robot o indicatore basato su questo codice? Ordinalo su Freelance
Vai a Freelance
Hai bisogno di un robot o indicatore basato su questo codice? Ordinalo su Freelance
Vai a Freelance
This oscillator indicator provides an interesting method for presenting volume data. It displays the total volume over the selected period.
Volume data can be represented in several ways:
- Combined
- Absolute
- Relative
- Separated
- Absolute
- Relative
Volumes can be displayed in relative or absolute values, as well as in a combined or a separated way.
The indicator has three input parameters:
- Period - calculation period;
- Combined - show data either in a combined or in a separated way (Yes/No);
- Relative - choose between relative/absolute values (Yes/No).
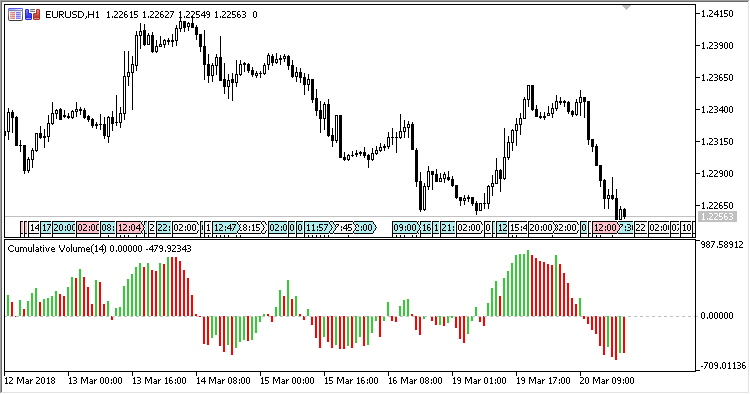
Fig.1. Combined, relative representation
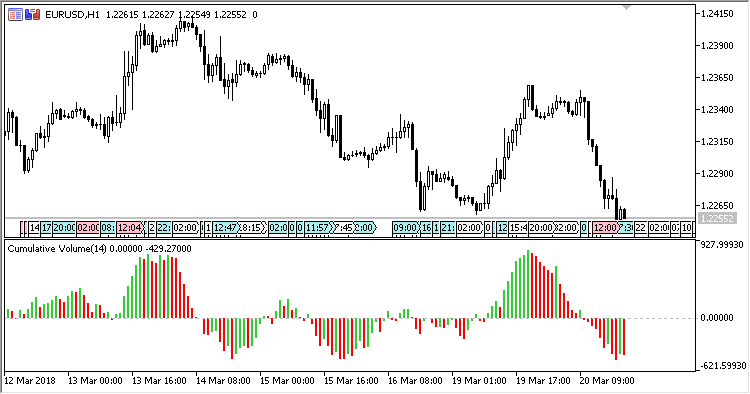
Fig.2. Combined, non-relative representation
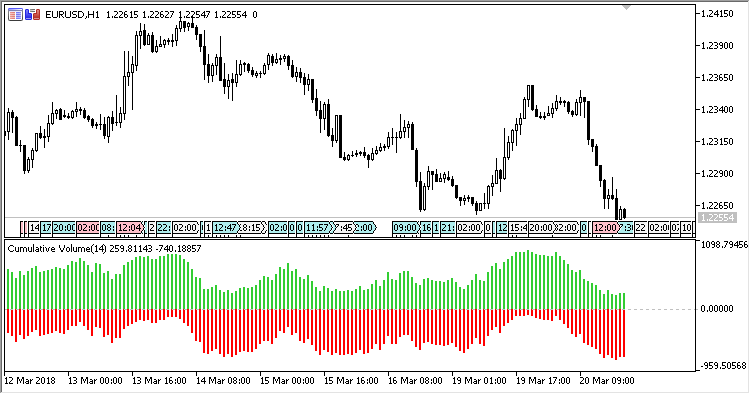
Fig.3. Non-combined, relative representation
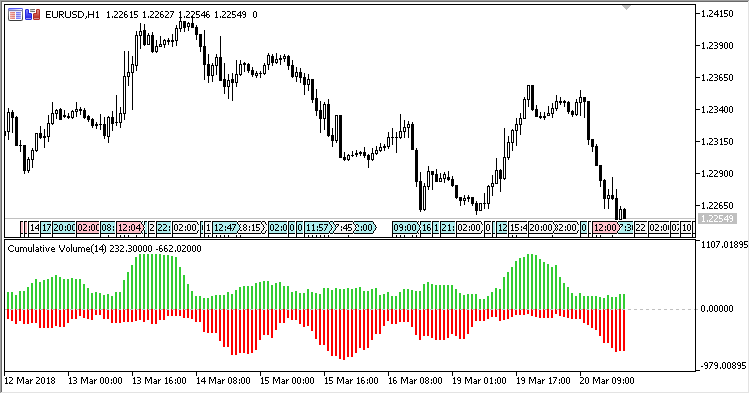
Fig.4. Non-combined, non-relative representation
Tradotto dal russo da MetaQuotes Ltd.
Codice originale https://www.mql5.com/ru/code/20267
SHL_MA_Band
A trend indicator: Smoothed High/Low Linear regression band.
HL_MA_Band
A trend indicator: High/Low Linear regression band.
MA_Difference
An oscillator indicator showing a difference between MA and the price.
Period_Open_Line
The indicator shows the open price of a period.