Unisciti alla nostra fan page

Stochastic DeMarker - indicatore per MetaTrader 5

- Visualizzazioni:
- 8131
- Valutazioni:
- Pubblicato:
-
 Ti stai perdendo delle opportunità di trading:
- App di trading gratuite
- Oltre 8.000 segnali per il copy trading
- Notizie economiche per esplorare i mercati finanziari
Registrazione AccediAccetti la politica del sito e le condizioni d’uso
Se non hai un account, registrati -
 Hai bisogno di un robot o indicatore basato su questo codice? Ordinalo su Freelance
Vai a Freelance
Hai bisogno di un robot o indicatore basato su questo codice? Ordinalo su Freelance
Vai a Freelance
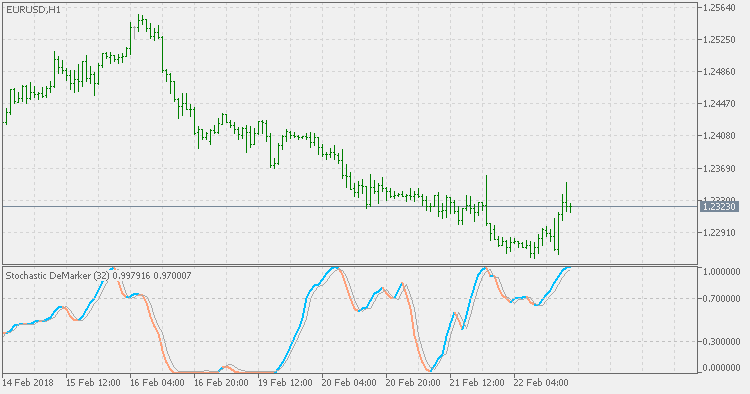
DeMarker indicator is used in technical analysis to compare the most recent price action to the previous period's price in an attempt to measure the demand of the underlying asset. This indicator is generally used to identify price exhaustion and can also be used to identify market tops and bottoms. This oscillator is bounded between 0 and 1 and, unlike many other oscillators, it does not use smoothed data.
Technical traders primarily use this indicator as a method of identifying the riskiness of the levels in which they wish to place a transaction. Generally, values above 0.6 are indicative of lower volatility and risk, while a reading below 0.4 is a sign that risk is increasing.
This version uses the "help" of smoothed Stochastic to emphasize the states of DeMarker and to help in easier trend assessment.
Balance of Power
Balance of Power, introduced by Igor Livshin, attempts to measure the strength of buyers vs. sellers by assessing the ability of each to push price to an extreme level. Livshin published this indicator in the August 2001 issue of Stocks and Commodities Magazine. This version of indicator calculates the BOP exactly as it is described in the article where it was published.
T3 levels
T3 is very similar to EMA in calculating way and it makes it suitable for this way of calculation. As an extension of EMA levels it might prove to be useful but by all means do some experimenting in order to get the best results for specific symbol/timeframe combination.
Instantaneous Trend Line
Instantaneous Trend Line is one of the series of indicators created by John Ehlres.
Instantaneous Trend Line Bands
This version extends the Instantaneous Trend Line indicator with a sort of bands to make it easier to spot trend change and to filter out some false signals that can be produced if only the slope of the ITL indicator is takes for a signal.