Unisciti alla nostra fan page

Smoothed Rate of Change - indicatore per MetaTrader 5

- Visualizzazioni:
- 11156
- Valutazioni:
- Pubblicato:
-
 Ti stai perdendo delle opportunità di trading:
- App di trading gratuite
- Oltre 8.000 segnali per il copy trading
- Notizie economiche per esplorare i mercati finanziari
Registrazione AccediAccetti la politica del sito e le condizioni d’uso
Se non hai un account, registrati -
 Hai bisogno di un robot o indicatore basato su questo codice? Ordinalo su Freelance
Vai a Freelance
Hai bisogno di un robot o indicatore basato su questo codice? Ordinalo su Freelance
Vai a Freelance
Smoothed Rate of Change (Smoothed-RoC) is a refinement of Rate of Change (RoC) indicator that was developed by Fred G Schutzman. It differs from the RoC in that it based on Exponential Moving Averages (EMAs) rather than on price closes. Like the RoC, Smoothed RoC is a leading Momentum indicator that can be used to determine the strength of a trend by determining if the trend is accelerating or decelerating. The Smoothed RoC does this by comparing the current EMA to value that the EMA was a specified periods ago. The use of EMAs rather than the price close eliminates the erratic tendencies of the RoC.
RoC is calculated in three steps. First, the EMA is calculated. Then the Momentum of the change in the EMA is calculated by subtracting the previous value of the EMA from the current EMA. Finally, the result is divided by the previous value of the EMA and multiplied by 100 to give a percentage. As the Smoothed-RoC is a RoC of EMA, it takes two periods:
- EMA period (13 by default).
- RoC period (21 by default).
The formula is:
where the previous EMA is the value that the EMA was at specified period ago. The result is a percentage that is plotted as an oscillator that oscillates between 100% and -100%.
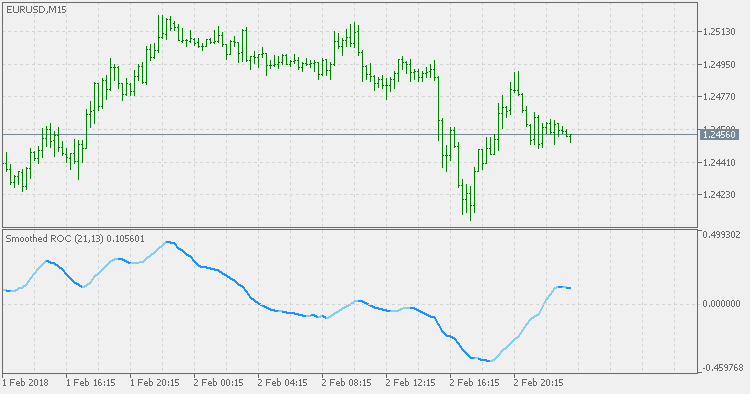
As with the RoC oscillator, the key consideration when using Smoothed-RoC is the center line. When the price of the underlying security is in an uptrend, a buy signal is generated when the Smoothed-RoC falls below its center line and starts to turn back up. When the price of the underlying security is in a downtrend, a sell signal is generated when the Smoothed-RoC moves above its center line and starts to turn back down.
Percentage Price Oscillator Extended
The Percentage Price Oscillator Extended (PPO) is a technical Momentum indicator showing the relationship between two Moving Averages. To calculate the PPO, subtract the 26-day Exponential Moving Average (EMA) from the nine-day EMA, and then divide this difference by the 26-day EMA. The end result is a percentage that tells the trader where the short-term average is relative to the longer-term average.
Percentage Price Oscillator
The Percentage Price Oscillator (PPO) is a technical Momentum indicator showing the relationship between two Moving Averages. To calculate the PPO, subtract the 26-day Exponential Moving Average (EMA) from the nine-day EMA, and then divide this difference by the 26-day EMA. The end result is a percentage that tells the trader where the short-term average is relative to the longer-term average.
Kase DevStops
Kase DevStops. What all of this boils down to is that we need to take variance and skew into consideration when we are establishing a system for setting stops. Three steps that we can take in order to both better define and to minimize the threshold of uncertainty in setting stops are: 1. Consideration of the variance or the standard deviation of range. 2. Consideration of the skew, or more simply, the amount at which range can spike in the opposite direction of the trend. 3. Reformation of our data to be more consistent (this step is examined in detail in Chapter 81, while minimizing the degree of uncertainty as much as possible).
DevStops
A variation of Deviation Stops (DevStops) indicator. Some are wrongly calling this version a Kase DevStops (which it is not - Kase DevStops indicator is calculated in a quite different way), but this version has its good points too and can be used in regular support/resistance mode. Additionally each DevStop value is colored according to the slope (trend) of the line - when all are aligned in the same direction, it can be treated as a confirmed trend change.