• Aperçu
  • Avis
  • Commentaires

Volumes Direction MT5

VOLUMES DIRECTION MT5

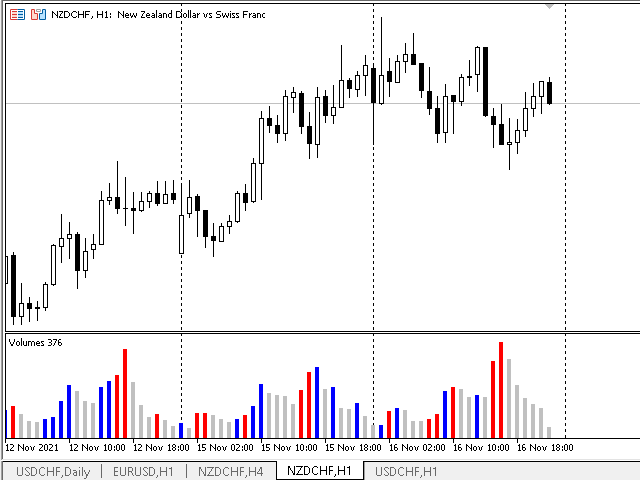
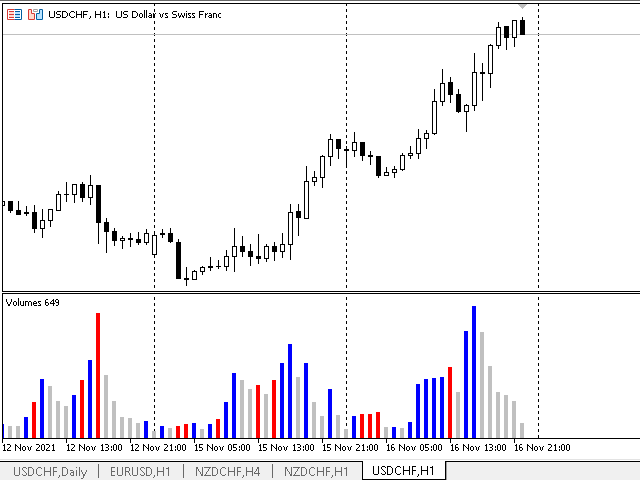
Normalement, l'indicateur de volume a un changement de couleur par défaut lorsque le volume actuel est plus élevé que le précédent, c'est important mais pas très utile.

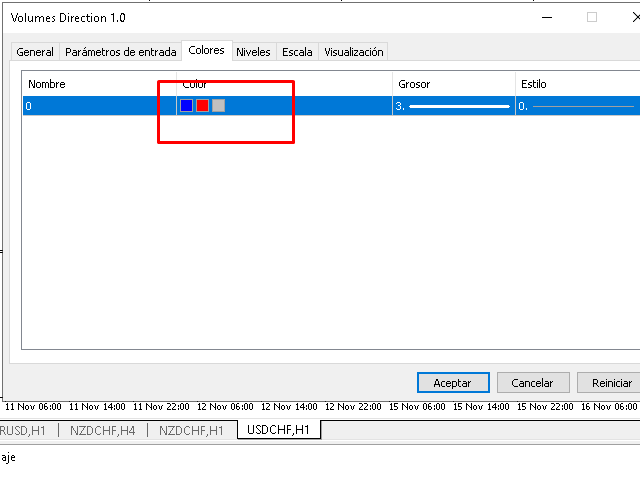
Pour cette raison, cet indicateur a été créé pour qu'en plus du volume normal, lorsque la bougie est haussière ou baissière, il les peint d'une couleur différente, par défaut bleu pour haussier et rouge pour baissier, mais ces couleurs peuvent être personnalisées selon le Le goût du commerçant.


N'oubliez pas de consulter mes autres indicateurs qui vous aideront à améliorer votre trading.
Produits recommandés
Wapv Price and volume
Eduardo Da Costa Custodio Santos
L'indicateur de prix et de volume WAPV pour MT5 fait partie de l'ensemble d'outils (Wyckoff Academy Wave Market) et (Wyckoff Academy Price and Volume). L'indicateur de prix et de volume WAPV pour MT5 a été créé pour faciliter la visualisation intuitive du mouvement du volume sur le graphique. Avec lui, vous pouvez observer les moments de pic de volume et les moments où le marché n'a aucun intérêt professionnel Identifiez les moments où le marché évolue par inertie et non par mouvement de "smart
Was: $249  Now: $99   Market Profile defines a number of day types that can help the trader to determine market behaviour. A key feature is the Value Area, representing the range of price action where 70% of trading took place. Understanding the Value Area can give traders valuable insight into market direction and establish the higher odds trade. It is an excellent addition to any system you may be using. Inspired by Jim Dalton’s book “Mind Over Markets”, this indicator is designed to suit the
Order Book, known also as Market Book, market depth, Level 2, - is a dynamically updated table with current volumes of orders to buy and to sell specific financial instument at price levels near Bid and Ask. MetaTrader 5 provides the means for receiving market book from your broker, but in real time only, without access to its history. The indicator OrderBook Cumulative Indicator accumulates market book data online and visualizes them on the chart. In addition, the indicator can show the market
BoxChart MT5
Evgeny Shevtsov
5 (7)
The market is unfair if only because 10% of participants manage 90% of funds. An ordinary trader has slim changes to stand against these "vultures". This problem can be solved. You just need to be among these 10%, learn to predict their intentions and move with them. Volume is the only preemptive factor that faultlessly works on any timeframe and symbol. First, the volume appears and is accumulated, and only then the price moves. The price moves from one volume to another. Areas of volume accumu
The Accumulation / Distribution is an indicator which was essentially designed to measure underlying supply and demand. It accomplishes this by trying to determine whether traders are actually accumulating (buying) or distributing (selling). This indicator should be more accurate than other default MT5 AD indicator for measuring buy/sell pressure by volume, identifying trend change through divergence and calculating Accumulation/Distribution (A/D) level. Application: - Buy/sell pressure: above
L'indicateur construit les cotations actuelles, qui peuvent être comparées aux cotations historiques et, sur cette base, faire une prévision de l'évolution des prix. L'indicateur dispose d'un champ de texte pour une navigation rapide jusqu'à la date souhaitée. Option : Symbole - sélection du symbole que l'indicateur affichera ; SymbolPeriod - sélection de la période à partir de laquelle l'indicateur prendra des données ; IndicatorColor - couleur de l'indicateur ; HorisontalShift -
Description The indicator uses market profile theory to show the most relevant trading zones, on a daily basis. The zones to be shown are LVN (low volume nodes) and POC (point of control). An LVN zone is one which represents price areas with the least time or volume throughout the day. Typically, these areas indicate a supply or demand initiative, and in the future, they can turn into important breakout or retracement zones. A POC zone is one which represents price areas with the most time or vo
This indicator allows you to enjoy the two most popular products for analyzing request volumes and market deals at a favorable price: Actual Depth of Market Chart Actual Tick Footprint Volume Chart This product combines the power of both indicators and is provided as a single file. The functionality of Actual COMBO Depth of Market AND Tick Volume Chart is fully identical to the original indicators. You will enjoy the power of these two products combined into the single super-indicator! Below is
Owl Smart Levels MT5
Sergey Ermolov
4.47 (36)
Version MT4   |  FAQ L' indicateur Owl Smart Levels est un système de trading complet au sein d'un seul indicateur qui comprend des outils d'analyse de marché populaires tels que les fractales avancées de Bill Williams , Valable ZigZag qui construit la structure d'onde correcte du marché et les niveaux de Fibonacci qui marquent les niveaux exacts d'entrée. sur le marché et les endroits où prendre des bénéfices. Description détaillée de la stratégie Mode d'emploi de l'indicateur Conseiller-Assis
Segmented Volume MT5
Eduardo Da Costa Custodio Santos
L'indicateur de volume segmenté MT5 a été créé pour faciliter ceux qui négocient en utilisant l'analyse des prix et des volumes, VSA, VPA, la méthode Wyckoff et le système Smart Money. Le volume segmenté fonctionne sur n'importe quel marché (Crypto, CFD, Forex, Futures, Actions...) et fonctionne à n'importe quel moment du graphique. Voyez à quel point votre interprétation est facile : #Vert : Volume bien supérieur à la moyenne du marché #Rose foncé : Volume supérieur à la moyenne #Bleu : Volume
No Demand No Supply MT5
Trade The Volume Waves Single Member P.C.
No Demand No Supply   This indicator identifies   No Demand –No Supply candles  to your chart and plots volume bars colored according to the signal. It can be applied to all timeframes or to a specific one only. It can also be used as regular volume indicator  with exceptional future of WEIGHTED VOLUME. Furthermore is has an alert notification, sound and email when a signals occurs. The indicator does not repaint but the alert will come on two candles back due to the definition of No Demand No S
Mini Chart Indicators
Flavio Javier Jarabeck
The Metatrader 5 has a hidden jewel called Chart Object, mostly unknown to the common users and hidden in a sub-menu within the platform. Called Mini Chart, this object is a miniature instance of a big/normal chart that could be added/attached to any normal chart, this way the Mini Chart will be bound to the main Chart in a very minimalist way saving a precious amount of real state on your screen. If you don't know the Mini Chart, give it a try - see the video and screenshots below. This is a gr
True Weis Wave
Atila Goncalves Firmino
A version based on David Waves' description in his book 'Trade About to Happen' of his adaptation of the Wyckoff wave chart. The indicator directionally accumulates volume, adding to each brick or candle close, with color indication for up and down. it can be used it with tick or real volume, it also changes color when the accumulated value of the previous wave is exceeded, being the trade signal. Yellow color is used for doji candlestick, it will continue with accumulation without zero the sum
VolumeDeltaBars
Stanislav Korotky
This indicator is a conventional analytical tool for tick volumes changes. It calculates tick volumes for buys and sells separately, and their delta on every bar, and displays volumes by price clusters (cells) within a specified bar (usually the latest one). The algorithm used internally is the same as in the indicator VolumeDeltaMT5 , but results are shown as cumulative volume delta bars (candlesticks). Analogous indicator for MetaTrader 4 exists - CumulativeDeltaBars . This is a limited substi
The Volume by Price Indicator for MetaTrader 5 features Volume Profile and Market Profile TPO (Time Price Opportunity). Get valuable insights out of currencies, equities and commodities data. Gain an edge trading financial markets. Volume and TPO histogram bar and line charts. Volume Footprint charts. TPO letter and block marker charts including split structures. Versatile segmentation and compositing methods. Static, dynamic and flexible ranges with relative and/or absolute visualizations. Lay
The professional tool of stock traders in now available on MetaTrader 5 . The Actual depth of market chart indicator visualizes the depth of market in the form of a histogram displayed on a chart, which refreshes in the real-time mode. Meet new updates according to user requests! Now Actual Depth of Market indicator displays the current ratio of volume of buy and sell requests (B/S ratio). It shows the share of volume of each type of requests in the entire flow of requests as well as the absol
Developed by Smart Trader - Smart Reversion Pattern is an indicator capable of identifying reversal patterns , both bullish reversals and bearish reversals. It is designed to provide fast, real-time awareness of patterns. We also thought about the interface part, creating a clean and pleasant look to identify formation patterns on the chart. Note: If any pattern you need is not listed, just contact us and request inclusion - we usually respond within a few hours. Bearish Reversal P
UPD1 Profile Levels MT5
Vitaliy Kuznetsov
5 (3)
L'indicateur trouve les niveaux de volume de prix maximum et minimum (profil de marché) sur l'histogramme de travail pour le nombre de barres spécifié.   Profil composite. La hauteur de l'histogramme est entièrement automatique et s'adapte à n'importe quel outil et période. L'algorithme de l'auteur est utilisé et ne répète pas les analogues connus. La hauteur des deux histogrammes est approximativement égale à la hauteur moyenne de la bougie. Smart alert vous permet de vous informer sur le prix
Key level wedge MT5
Presley Annais Tatenda Meck
The   Key level wedge MT5   indicator automatically draws rising wedge pattern and falling wedge pattern for you on the chart. This pattern is really good when used as a confirmation entry at key support & resistance, supply & demand and reversal zones. Advantages  The   Key level wedge MT5   block DOES NOT RE-PAINT, giving you confidence when a signal appears and also helps when looking back.  The   Key level wedge MT5   includes an on/off button on the chart to easily keep the charts cle
Bear Bull
Ignacio Agustin Mene Franco
Bear Bull! It is an indicator that marks with Heikin Ashi candles but modified, the sales and purchases long and short trend! with 2 colors green marks the purchase, purple marks the sale, works for any type of temporality, works for forex markets and synthetic indices! ideal for any pair, it also works for crypto pairs, Good profit! World Investor - World Inversor - 
Weis Waves
Flavio Javier Jarabeck
3.15 (26)
The original author is David Weis, an expert in the Wyckoff Method. The Weis Wave is a modern adaptation of the 1930's Wyckoff Method, another expert in Tape Reading techniques and Chart Analysis. Weis Waves takes market volume and stacks it into waves according to price conditions giving the trader valuable insights about the market conditions. If you want to learn more about this subject you can find tons of videos in YouTube. Just look for "The Wickoff Method", "Weis Wave" and "Volume Spread
FREE
WAPV Weis Wave Chart Forex
Eduardo Da Costa Custodio Santos
Le Weis Wave Chart Forex pour MT5 est un indicateur de prix et de volume. La lecture du prix et du volume a été largement diffusée par Richard Demille Wyckoff sur la base des trois lois qu'il a créées : l'offre et la demande, la cause et l'effet et l'effort contre le résultat. En 1900 R.Wyckoff utilisait déjà le wave chart dans ses analyses. De nombreuses années plus tard, vers 1990, David Weis a automatisé le diagramme d'onde de R. Wyckoff et aujourd'hui nous vous apportons l'évolution du diagr
This indicator provides an original mix of WPR, VSA, and volume delta. It shows ratio of buy/sell volumes scaled on 100% range based on total volume change for a selected period. The convetional VSA (Volume Spread Analysis) studies interconnections of price action and volume change in absolute values, whereas WPR (Williams Percent Range) offers a convenient approach of price moves normalization into the fixed percentage metric: 0 - 100%. Hence overbough and oversold states are easily spotted. N
Cumulative delta indicator As most traders believe, the price moves under the pressure of market buying or selling. When someone redeems an offer standing in the cup, the deal is a "buy". If someone pours into the bid standing in the cup - the deal goes with the direction of "sale". The delta is the difference between purchases and sales. A cumulative delta - the difference between the cumulative sum of purchases and sales for a certain period of time. It allows you to see who is currently contr
Alpha Trend Pro
Eslam Mohamed Abdelrady Shehata
Alpha Trend Pro: Your Ultimate Trading Companion Embark on a new era of trading with Alpha Trend Pro Indicator. Crafted with precision and innovation, Alpha Trend is designed to elevate your trading experience by seamlessly blending powerful elements to navigate various market conditions. **Key Features:** **1. Dynamic Adaptability:**    - In sideways market conditions, Alpha Trend acts as a dead indicator. Say goodbye to many false signals and welcome a tool that adapts seamlessly to mar
Each bar graph is a brick, take buy a bill now as an example, the brick that is in lowest position at the moment, go to the left, when the brick with the 3rd highest is in existence, take the height of this brick as a benchmark, when the price exceeds the height of this brick, can establish buy a bill, when appear opposite circumstance closes a position, establish empty order at the same time. This is a simple rule, need each friend grope by oneself.
Value Chart Candlesticks
Flavio Javier Jarabeck
4.67 (9)
The idea of a Value Chart indicator was presented in the very good book I read back in 2020 , " Dynamic Trading Indicators: Winning with Value Charts and Price Action Profile ", from the authors Mark Helweg and David Stendahl. The idea is simple and the result is pure genius: Present candlestick Price analysis in a detrended way! HOW TO READ THIS INDICATOR Look for Overbought and Oversold levels. Of course, you will need to test the settings a lot to find the "correct" one for your approach.
FREE
Waves PRO
Flavio Javier Jarabeck
For those who appreciate Richard Wyckoff approach for reading the markets, we at Minions Labs designed a tool derived - yes, derived, we put our own vision and sauce into this indicator - which we called Waves PRO . This indicator provides a ZigZag controlled by the market volatility (ATR) to build its legs, AND on each ZigZag leg, we present the vital data statistics about it. Simple and objective. This indicator is also derived from the great book called " The Secret Science of Price and Volum
To get access to MT4 version please click here . - This is the exact conversion from TradingView: "Stochastic Momentum Index" By "UCSgears". - This is a popular version of stochastic oscillator on tradingview. - This is a light-load processing and non-repaint indicator. - Buffers are available for the lines on chart. - You can message in private chat for further changes you need. Thanks for downloading
Il s'agit d'un indicateur MTF des niveaux de support et de résistance basé sur les   extremums de l'indicateur Advanced ZigZag Dynamic   et/ou   Extended Fractals   avec des étiquettes de prix (peut être désactivé). Des TF plus élevés peuvent être sélectionnés pour le mode MTF. Par défaut, les niveaux sont générés en fonction des points indicateurs ZigZag. Les points indicateurs de fractales peuvent également être utilisés avec ZigZag ou à sa place. Afin de simplifier l'utilisation et d'économis
Les acheteurs de ce produit ont également acheté
Tout d'abord, il convient de souligner que ce système de trading est un indicateur non repeint, non redessiné et non retardé, ce qui le rend idéal pour le trading manuel et automatisé. Le "Système de Trading Smart Trend MT5" est une solution de trading complète conçue pour les traders débutants et expérimentés. Il combine plus de 10 indicateurs premium et propose plus de 7 stratégies de trading robustes, ce qui en fait un choix polyvalent pour différentes conditions de marché. Stratégie de suivi
Atomic Analyst MT5
Issam Kassas
4.27 (11)
Tout d'abord, il convient de souligner que cet indicateur de trading n'est ni repainting, ni redrawing et ne présente aucun délai, ce qui le rend idéal à la fois pour le trading manuel et automatisé. L'Analyste Atomique est un indicateur d'action sur les prix PA qui utilise la force et le momentum du prix pour trouver un meilleur avantage sur le marché. Équipé de filtres avancés qui aident à éliminer les bruits et les faux signaux, et à augmenter le potentiel de trading. En utilisant plusieur
FX Volume MT5
Daniel Stein
4.94 (17)
Obtenez votre mise à jour quotidienne du marché avec des détails et des captures d'écran via notre Morning Briefing ici sur mql5 et sur Telegram ! FX Volume est le PREMIER et SEUL indicateur de volume qui fournit un VRAI aperçu du sentiment du marché du point de vue d'un courtier. Il fournit des informations impressionnantes sur la façon dont les acteurs institutionnels du marché, comme les courtiers, sont positionnés sur le marché des changes, bien plus rapidement que les rapports COT. Voir c
Quantum Trend Sniper
Bogdan Ion Puscasu
5 (37)
Présentation       Quantum Trend Sniper Indicator   , l'indicateur révolutionnaire MQL5 qui transforme la façon dont vous identifiez et négociez les inversions de tendance ! Développé par une équipe de traders expérimentés avec une expérience commerciale de plus de 13 ans,       Indicateur Quantum Trend Sniper       est conçu pour propulser votre parcours de trading vers de nouveaux sommets grâce à sa manière innovante d'identifier les inversions de tendance avec une précision extrêmement élevée
Gold Stuff mt5
Vasiliy Strukov
4.89 (166)
Gold Stuff mt5 est un indicateur de tendance conçu spécifiquement pour l'or et peut également être utilisé sur n'importe quel instrument financier. L'indicateur ne se redessine pas et ne traîne pas. Délai recommandé H1. Contactez-moi immédiatement après l'achat pour obtenir les réglages et un bonus personnel !   RÉGLAGES Dessiner la flèche - on off. dessiner des flèches sur le graphique. Alertes - activation et désactivation des alertes sonores. Notification par e-mail - activé désactivé.
Trend Screener Pro MT5
STE S.S.COMPANY
4.89 (61)
Indicateur de tendance, solution unique révolutionnaire pour le trading et le filtrage des tendances avec toutes les fonctionnalités de tendance importantes intégrées dans un seul outil ! Il s'agit d'un indicateur multi-période et multi-devises 100 % non repeint qui peut être utilisé sur tous les symboles/instruments : forex, matières premières, crypto-monnaies, indices et actions. Trend Screener est un indicateur de suivi de tendance efficace qui fournit des signaux de tendance fléchés avec des
RelicusRoad Pro MT5
Relicus LLC
4.82 (22)
Maintenant 147 $ (augmentant à 499 $ après quelques mises à jour) - Comptes illimités (PCS ou Mac) Manuel d'utilisation RelicusRoad + Vidéos de formation + Accès au groupe Discord privé + Statut VIP UNE NOUVELLE FAÇON DE REGARDER LE MARCHÉ RelicusRoad est l'indicateur de trading le plus puissant au monde pour le forex, les contrats à terme, les crypto-monnaies, les actions et les indices, offrant aux traders toutes les informations et tous les outils dont ils ont besoin pour rester renta
Tout d'abord, il convient de souligner que cet outil de trading est un indicateur non repeint, non redessiné et non retardé, ce qui le rend idéal pour le trading professionnel. L'indicateur Smart Price Action Concepts est un outil très puissant à la fois pour les nouveaux et les traders expérimentés. Il regroupe plus de 20 indicateurs utiles en un seul, combinant des idées de trading avancées telles que l'analyse du trader Inner Circle et les stratégies de trading Smart Money Concepts. Cet in
Top indicator for MT5   providing accurate signals to enter a trade without repainting! It can be applied to any financial assets:   forex, cryptocurrencies, metals, stocks, indices .  Watch  the video  (6:22) with an example of processing only one signal that paid off the indicator! MT4 version is here It will provide pretty accurate trading signals and tell you when it's best to open a trade and close it. Most traders improve their trading results during the first trading week with the help of
FX Power MT5 NG
Daniel Stein
5 (4)
Obtenez votre mise à jour quotidienne du marché avec des détails et des captures d'écran via notre Morning Briefing ici sur mql5 et sur Telegram ! FX Power MT5 NG est la nouvelle génération de notre très populaire indicateur de force des devises, FX Power. Et qu'est-ce que ce compteur de force de nouvelle génération offre ? Tout ce que vous avez aimé de l'original FX Power PLUS Analyse de la force de l'OR/XAU Des résultats de calcul encore plus précis Périodes d'analyse configurables individuel
Advanced Supply Demand MT5
Bernhard Schweigert
4.53 (15)
La meilleure solution pour tout commerçant débutant ou expert ! Cet indicateur est un outil de trading unique, de haute qualité et abordable car nous avons intégré un certain nombre de fonctionnalités propriétaires et une nouvelle formule. Avec cette mise à jour, vous pourrez afficher des zones à double horaire. Vous pourrez non seulement afficher un TF plus élevé, mais afficher les deux, le graphique TF, PLUS le TF supérieur : AFFICHAGE DES ZONES NICHÉES. Tous les traders Supply Demand vont ado
Auto Order Block with break of structure based on ICT and Smart Money Concepts Futures Break of Structure ( BoS )             Order block ( OB )            Higher time frame Order block / Point of Interest ( POI )    shown on current chart           Fair value Gap ( FVG ) / Imbalance   ,  MTF      ( Multi Time Frame )    Volume Imbalance     ,  MTF          vIMB Gap’s Equal High / Low’s     ,  MTF             EQH / EQL Liquidity               Current Day High / Low           HOD /
XQ Indicator MetaTrader 5
Marzena Maria Szmit
5 (1)
Step into the realm of Forex trading with confidence and precision using XQ, a cutting-edge Forex indicator designed to elevate your trading game to unprecedented heights. Whether you're a seasoned trader or just stepping into the world of currency exchange, XQ Forex Indicator empowers you with the insights and signals needed to make informed trading decisions. The signal conditions are a combination of three indicators, and XQ Forex Indicator only display  medium and long-term trends . The ind
ICT, SMC, SMART MONEY CONCEPTS, SMART MONEY, Smart Money Concept, Support and Resistance, Trend Analysis, Price Action, Market Structure, Order Blocks, BOS/CHoCH,   Breaker Blocks ,  Momentum Shift,   Supply&Demand Zone/Order Blocks , Strong Imbalance,   HH/LL/HL/LH,    Fair Value Gap, FVG,  Premium  &   Discount   Zones, Fibonacci Retracement, OTE, Buy Side Liquidity, Sell Side Liquidity, BSL/SSL Taken, Equal Highs & Lows, MTF Dashboard, Multiple Time Frame, BigBar, HTF OB, HTF Market Structure
Blahtech Supply Demand MT5
Blahtech Limited
4.57 (14)
Was: $299  Now: $99   Supply Demand uses previous price action to identify potential imbalances between buyers and sellers. The key is to identify the better odds zones, not just the untouched ones. Blahtech Supply Demand indicator delivers functionality previously unavailable on any trading platform. This 4-in-1 indicator not only highlights the higher probability zones using a multi-criteria strength engine, but also combines it with multi-timeframe trend analysis, previously confirmed swings
Le profit de la structure du marché change à mesure que le prix s'inverse et recule. L'indicateur d'alerte d'inversion de la structure du marché identifie le moment où une tendance ou un mouvement de prix approche de l'épuisement et est prêt à s'inverser. Il vous avertit des changements dans la structure du marché qui se produisent généralement lorsqu'un renversement ou un recul majeur est sur le point de se produire. L'indicateur identifie initialement les cassures et la dynamique des prix,
L'indicateur de Carré Gann est un puissant outil d'analyse du marché basé sur l'article "Formule Mathématique pour les Prédictions de Marché" écrit par W.D. Gann. Cet outil utilise des concepts mathématiques et des théories de Gann pour réaliser une analyse précise du marché. Il utilise les carrés de 144, 90, 52 et aussi le carré de 9. De plus, il intègre la méthode du  pour le carré de 9 et sa relation avec les canaux et le modèle en étoile de ce carré. Manuel d'Utilisateur et Application : Ava
AW Trend Predictor MT5
AW Trading Software Limited
4.76 (54)
La combinaison des niveaux de tendance et de panne dans un seul système. Un algorithme d'indicateur avancé filtre le bruit du marché, détermine la tendance, les points d'entrée, ainsi que les niveaux de sortie possibles. Les signaux indicateurs sont enregistrés dans un module statistique, qui vous permet de sélectionner les outils les plus appropriés, montrant l'efficacité de l'historique des signaux. L'indicateur calcule les marques Take Profit et Stop Loss. Manuel et instruction ->   ICI   / v
TrendLine PRO MT5
Evgenii Aksenov
4.78 (49)
The Trend Line PRO indicator is an independent trading strategy. It shows the trend change, the entry point to the transaction, as well as automatically calculates three levels of Take Profit and Stop Loss protection Trend Line PRO is perfect for all Meta Trader symbols: currencies, metals, cryptocurrencies, stocks and indices Advantages of Trend Line PRO Never redraws its signals The possibility of using it as an independent strategy It has three automatic levels Take Profit and Stop Loss lev
MetaBands M5
Vahidreza Heidar Gholami
4.67 (3)
MetaBands uses powerful and unique algorithms to draw channels and detect trends so that it can provide traders with potential points for entering and exiting trades. It’s a channel indicator plus a powerful trend indicator. It includes different types of channels which can be merged to create new channels simply by using the input parameters. MetaBands uses all types of alerts to notify users about market events. Features Supports most of the channel algorithms Powerful trend detection algorith
Présentation       Quantum Breakout PRO   , l'indicateur révolutionnaire MQL5 qui transforme la façon dont vous négociez les zones d'évasion ! Développé par une équipe de traders expérimentés avec une expérience commerciale de plus de 13 ans,       Évasion quantique PRO       est conçu pour propulser votre parcours commercial vers de nouveaux sommets grâce à sa stratégie de zone de discussion innovante et dynamique. Quantum Breakout Indicator vous donnera des flèches de signalisation sur le
Gartley Hunter Multi
Siarhei Vashchylka
5 (5)
Gartley Hunter Multi - An indicator for searching for harmonic patterns simultaneously on dozens of trading instruments and on all classic timeframes: (m1, m5, m15, m30, H1, H4, D1, Wk, Mn). Manual (Be sure to read before purchasing) | Version for MT4 Advantages 1. Patterns: Gartley, Butterfly, Shark, Crab. Bat, Alternate Bat, Deep Crab, Cypher 2. Simultaneous search for patterns on dozens of trading instruments and on all classic timeframes 3. Search for patterns of all possible sizes. Fr
Trend Line Map Pro MT5
STE S.S.COMPANY
4.67 (9)
Trend Line Map indicator is an addons for   Trend Screener Indicator . It's working as a scanner for all signals generated by Trend screener ( Trend Line Signals ) . It's a Trend Line Scanner based on Trend Screener Indicator.  If you don't have Trend Screener Pro Indicator,   the Trend Line Map Pro will not work.     LIMITED TIME OFFER : Trend Line Map Indicator is available for only 50 $ and lifetime. ( Original price 125$ ) By accessing to our MQL5 Blog,  you can find all our premium indica
TrendDecoder Premium MT5
Christophe, Pa Trouillas
5 (1)
Identifiez les ranges et les tendances fortes  |  Obtenez les premiers signaux   |    Obtenez des TP et des sorties   clairs   |    Repérer les niveaux Fibo que le prix va tester   |  Indicateur qui ne retrace pas, non retardé - idéal pour le trading manuel et automatisé - adapté à tous les actifs et à toutes les unités de temps - 50% discount   pour le lancement - puis retour à >>   149 $ Après votre achat,   contactez-moi sur ce canal  pour obtenir les réglages recommandés. Version MT4 :   cli
TPSpro TRENDPRO  - is a trend indicator that automatically analyzes the market and provides information about the trend and each of its changes, as well as giving signals for entering trades without redrawing! The indicator uses each candle, analyzing them separately. referring to different impulses - up or down impulse. Exact entry points into transactions for currencies, crypto, metals, stocks, indices!  -  Version MT4                  DETAILED DESCRIPTION        /       TRADING SETUPS       
Golden Spikes Detector
Batsirayi L Marango
5 (1)
Golden Spikes Detector Cet indicateur est basé sur une stratégie avancée principalement pour les pics de trading sur les indices Boom et Crash. Des algorithmes complexes ont été mis en œuvre pour détecter uniquement les entrées à forte probabilité. Il alerte sur les entrées potentielles d’achat et de vente. Pour échanger des pics sur le courtier Deriv ou Binary, prenez uniquement les alertes Buy Boom et Sell Cash. Il a été optimisé pour être chargé sur une période de 5 minutes, bien qu'une analy
Matrix Arrow Indicator MT5
Juvenille Emperor Limited
5 (14)
Matrix Arrow Indicator MT5   est une tendance unique 10 en 1 suivant un indicateur multi-période   100% non repeint   qui peut être utilisé sur tous les symboles/instruments:   forex ,   matières premières ,   crypto-monnaies ,   indices ,  actions .  Matrix Arrow Indicator MT5  déterminera la tendance actuelle à ses débuts, en rassemblant des informations et des données à partir d'un maximum de 10 indicateurs standard, qui sont: Indice de mouvement directionnel moyen (ADX) Indice de canal de m
IX Power MT5
Daniel Stein
5 (2)
IX Power   apporte enfin la précision imbattable de FX Power aux symboles non-Forex. Il détermine avec précision l'intensité des tendances à court, moyen et long terme de vos indices, actions, matières premières, ETF et même crypto-monnaies préférés. Vous pouvez   analyser tout ce que   votre terminal a à offrir. Essayez-le et découvrez comment   votre timing s'améliore considérablement   lors de vos transactions. Caractéristiques principales d'IX Power Résultats de calcul précis à 100 %,
Strong Support mt5
Vasiliy Strukov
5 (9)
Les niveaux de support et de résistance sont depuis longtemps un outil puissant pour l'analyse du marché. Strong support l'indicateur construit les niveaux de support sur les bas de prix locaux et les niveaux de résistance sur les hauts de prix locaux. Mes autres développements peuvent être consultés ici Il est recommandé d'utiliser conjointement avec un indicateur de tendance, par exemple, Gold Stuff - cela vous permettra de négocier sur la tendance et de définir simultanément des zones de
Smart Peak Bottom
Xiaoyu Huang
5 (2)
Il s'agit d'un indicateur clair pour juger des hauts et des bas, et cela fonctionne bien pour le marché oscillant. Prix promotionnel 49$ → 59$ caractéristiques bon pour juger des hauts et des bas Pas de redessin, pas de dérive Calcul rapide, pas de décalage Mode de rappel riche Plusieurs paramètres et couleurs peuvent être ajustés paramètre "======== Principal ========" HighLowPeriod1 = 9 HighLowPeriod2 = 60 HighLowPeriod3 = 34 HighLowEMAPeriod = 4 MASignalPeriod = 5 "======== Notifier ==
Plus de l'auteur
RSI Alarm Osw
William Oswaldo Mayorga Urduy
RSI ALARM (For Metatrader 5) This indicator works like a normal RSI with all its settings (Periodicity, colors, levels, etc), but additionally, alarms can be set at the upper and lower level (Example 70 and 30), with the possibility of adjusting these levels by moving the blue and red lines to establish the upper and lower levels. You can also turn on and off an additional function that creates an arrow on the chart when the expected upper or lower RSI is met.
SUPPORT LINES AND RESISTORS + COMMAND BLOCKS for METATRADER 5 A much more pleasant visual way to locate supports and resistance, unlike normal horizontal lines, these can be located from a specific point, without extending backwards, making the graph not look good, it also shows the name of the temporality in which it was created so that when you are operating, you can know to which temporality it belongs. You can also create order blocks in a comfortable and visual way, where you can also
GAPS Indicator MT5
William Oswaldo Mayorga Urduy
Indicateur GAPS Metatrader 5 Pour certaines des stratégies utilisées dans les indices, actions et autres actifs, le GAP de chaque chandelier est généralement mesuré, mais si nous voulons le faire manuellement, cela peut nous amener à faire des erreurs de calcul. Pour cette raison, "GAP Indicator" a été créé, qui affiche automatiquement la valeur PIPS de chacun des GAPS présentés entre chacune des bougies et génère une alarme lorsqu'elles apparaissent, si l'option est activée.
RSI Alarm Osw MT4
William Oswaldo Mayorga Urduy
RSI ALARM (For Metatrader 4) This indicator works like a normal RSI with all its settings (Periodicity, colors, levels, etc), but additionally, alarms can be set in the upper and lower level (Example 70 and 30), with the possibility of adjusting these levels by moving the upper and lower lines found on the indicator. You can also activate and deactivate an additional function that puts an arrow on the chart when the expected upper or lower RSI is met.
SORS Osw MT4
William Oswaldo Mayorga Urduy
THE SORS COMPLEXES (For Metatrader 4) This indicator is designed to draw the SORS lines on the graph, these are the modern way of calculating market points that it usually respects, they are comprised of supports and resistance, but unlike the classics, these are calculated from volatility endogenous and standard deviation, In the configuration you can change the color of each level linear and hide the ones that are not needed. A = Annual. M = Monthly. W = Weekly D = Daily.
Divergence Osw Metatrader 4
William Oswaldo Mayorga Urduy
DIVERGENCE OSW  (For Metatrader 4) This indicator works on divergences and has the following functions: Generate an alert when a divergence occurs. Create lines by calculating the Stoploss and Takeprofit according to projection waves of inverse waves. Create an arrow indicating the possible direction of the market. The signals sent by the indicator are given when the candle ends. The Trader must evaluate each divergence to take entries. Settings: Activation and deactivation of alerts. Alert inte
Trading Sesions MT4
William Oswaldo Mayorga Urduy
COMMERCIAL SESSIONS This indicator shows in the selected graph divided by tables each of the sessions ASIA, JAPAN, LONDON, NEW YORK: Allows you to configure: Session Color  ASIA, JAPON, LONDRES, NEW YORK Hide and show each session It works in the lowest timeframes on the market, among which H4, H1, M15, M5 and M1 are recommended. (Don't forget to check out our other indicators)
Automatic Support and Resistance Osw MT4 This Indicator graphs lines at the possible support and resistance points of the selected asset. it works in multiple temporalities. allows you to configure: Color of the lines. Width of the lines. Type of lines. When the indicator begins its operation, it analyzes the supports and resistances of higher levels for the temporality in which it is working.
Round Numbers Osw MT4
William Oswaldo Mayorga Urduy
ROUND NUMBERS (For Metatrader 4) This indicator allows you to add horizontal lines according to the round numbers that the asset contains. Unlike other indicators, this one calculates the closest levels dynamically and automatically as the price moves. works on currency pairs, indices, metals, stocks, etc. Round with 5 digits, 3 digits and integers of 10 100 or 1000. lines can be adjusted in parameters like: Hide the line or round number that you do not want to display. line col
SUPPORT LINES AND RESISTORS + COMMAND BLOCKS for METATRADER 4 A much more pleasant visual way to locate supports and resistance, unlike normal horizontal lines, these can be located from a specific point, without extending backwards, making the graph not look good, it also shows the name of the temporality in which it was created so that when you are operating, you can know to which temporality it belongs. You can also create order blocks in a comfortable and visual way, where you can also
Whatch and Candle Alarm Osw MT4
William Oswaldo Mayorga Urduy
Osw Watch for METATRADER 4 This is an indicator that shows the remaining time for the current candle to expire on a watch, this is always located next to the last candle following the price, the numbers are shown the same as in the images, and can be modified both in size and color. between your settings you can set: the size of the numbers showing the time. the color of the numbers showing the time. Also within the configuration you can activate and deactivate so that an alarm sounds
Alert Up Down MT4
William Oswaldo Mayorga Urduy
ALERT UP - DOWN FOR METATRADER 5 This indicator generates an alert when the price leaves the zone between the UP and DOWN lines. You can generate alerts of various types such as: > Sound > Message box > Message in the expert box > Mail (previously configured) > PUSH notifications (previously configured) The lines must be configured from the indicator properties and not from the lines properties, since if it is done from the lines properties, the finonacci may be affected.
Break Out Signal Osw
William Oswaldo Mayorga Urduy
SIGNAL D'ARRÊT OSW (METATRADER 4) Voulez-vous travailler avec des hauts et des bas ? c'est l'indicateur parfait pour prendre des signaux de ces types d'entrées. Dès que l'indicateur démarre, il ne vous montrera aucun signal, mais à mesure que le prix progresse, il lira le marché jusqu'à ce qu'il trouve le modèle parfait pour sortir. L'indicateur pour lire les hauts et les bas a une configuration spéciale pour le Zig Zag, ce qui permet de ne prendre que les plus appropriés. Comme tout
Automatic OrderBlocks Osw MT4
William Oswaldo Mayorga Urduy
BLOCS DE COMMANDE AUTOMATIQUES OSW (METATRADER 5) Cet indicateur est chargé de montrer les blocs de commande selon certaines règles préétablies, parmi lesquelles : > qu'il y a une impulsion qui brise l'impulsion précédente. >Lorsqu'il est trouvé, il se charge de trouver le modèle de chandelier formé, de calculer de la manière la plus efficace le haut et le bas de la place, de créer le haut et le bas du bloc d'ordre. > Une fois le bloc d'ordres créé, l'indicateur vérifie en permanence
SORS Osw
William Oswaldo Mayorga Urduy
THE SORS COMPLEXES This indicator is designed to draw the SORS lines on the graph, these are the modern way of calculating market points that it usually respects, they are comprised of supports and resistance, but unlike the classics, these are calculated from volatility endogenous and standard deviation, In the configuration you can change the color of each level linear and hide the ones that are not needed. A = Annual. M = Monthly. W = Weekly D = Daily.
Automatic Support and Resistance Osw MT5 This Indicator graphs lines at the possible support and resistance points of the selected asset. it works in multiple temporalities. allows you to configure: Color of the lines. Width of the lines. Type of lines. When the indicator begins its operation, it analyzes the supports and resistances of higher levels for the temporality in which it is working.
Round Number Osw MT5
William Oswaldo Mayorga Urduy
ROUND NUMBERS (For Metatrader 5) This indicator allows you to add horizontal lines according to the round numbers that the asset contains. Unlike other indicators, this one calculates the closest levels dynamically and automatically as the price moves. works on currency pairs, indices, metals, stocks, etc. Round with 5 digits, 3 digits and integers of 10 100 or 1000. lines can be adjusted in parameters like: Hide the line or round number that you do not want to display. line col
Multi Temporalities Osw MT5
William Oswaldo Mayorga Urduy
MULTI-TIMES FOR METATRADER 5 This indicator, in a lower window, shows the current chart in different timeframes, this can help you better decipher the market, taking into account the higher timeframes. Among the settings that you can modify are: view of prices in charts view of the temporalities in the graphs enable each of the graphics in the different temporalities (M1, M5, M15, H1, H4, D1, W1, MN1).
Whatch and Candle Alarm Osw MT5
William Oswaldo Mayorga Urduy
Osw Watch for METATRADER 5 This is an indicator that shows the remaining time for the current candle to expire on a watch, this is always located next to the last candle following the price, the numbers are shown the same as in the images, and can be modified both in size and color. between your settings you can set: the size of the numbers showing the time. the color of the numbers showing the time. Also within the configuration you can activate and deactivate so that an alarm sounds
Alert Up Down MT5
William Oswaldo Mayorga Urduy
ALERT UP - DOWN FOR METATRADER 5 This indicator generates an alert when the price leaves the zone between the UP and DOWN lines. You can generate alerts of various types such as: > Sound > Message box > Message in the expert box > Mail (previously configured) > PUSH notifications (previously configured) The lines must be configured from the indicator properties and not from the lines properties, since if it is done from the lines properties, the finonacci may be affected.
Master Calendar Osw
William Oswaldo Mayorga Urduy
CALENDRIER PRINCIPAL OSW Cet indicateur a été initialement créé pour mon usage personnel, mais je l'ai amélioré petit à petit et j'ai mis en place des fonctions pour m'aider dans mon trading quotidien et des fonctions continueront d'être mises en œuvre si elles sont utiles. DÉTAILS DU CALENDRIER. >Calendrier mobile et détaillé des actualités proches de la date actuelle, avec des données telles que : date, Pays, Devise, Secteur de l'actualité, Nom de l'actualité et Données précédentes, pré
Trade Panel Osw MT5
William Oswaldo Mayorga Urduy
PANNEAU COMMERCIAL OSW METATRADE 5 Ce panneau vous aidera à passer des ordres de marché, vous permettant de visualiser le coût de chaque opération, selon la devise établie dans le compte. MANUEL DE FONCTIONNEMENT : 1) Sélectionnez un STOPLOSS, avec les boutons ou par écrit (Vous pouvez activer ou désactiver l'option pour le mettre). 2) Sélectionnez un TAKEPROFIT, avec les boutons ou par écrit (Vous pouvez activer ou désactiver l'option pour le mettre). 3) Sélectionnez un VOLUME, avec
Signal Indicator to Expert MT5
William Oswaldo Mayorga Urduy
Vous avez un indicateur qui émet des signaux et vous souhaitez le convertir en Expert ? Avec cet expert vous pouvez le convertir sans avoir à reprogrammer ou adapter votre indicateur, il vous suffit de suivre les étapes pour le configurer correctement : 1) L'indicateur doit se trouver dans le dossier des indicateurs. 2) Vous devez sélectionner avec soin les tampons ACHETER et VENDRE fournis par l'indicateur. 3) Sélectionnez si vous souhaitez prendre toutes les opérations ou uniquement c
Local Copy Trading Osw
William Oswaldo Mayorga Urduy
COPY TRADING LOCAL OSW C'est un excellent outil si vous souhaitez copier des transactions d'un compte à un autre. Pour configurer l'Expert, vous devez suivre les étapes suivantes : 1) Vérifiez que le trading automatique est activé dans le terminal SLAVE. 2) Vérifiez que l'EA dispose des autorisations de négociation dans le terminal SLAVE. 3) Ajoutez l'expert à un diagramme MASTER et configurez-le en tant que MASTER. 4) Ajouter l'expert à un graphique SLAVE et configurer en tant que
Microlots Deriv
William Oswaldo Mayorga Urduy
MICROLOTS DÉRIVÉS Ce panneau remplace le panneau traditionnel, avec lequel vous pouvez saisir des micro lots lorsque le courtier ne permet pas de les placer, uniquement à condition que le courtier offre le pas de Volume inférieur au Volume minimum. Par exemple: si le Volume Minimum est de 0.20 et que le pas est de 0.01, et que vous voulez mettre 0.02, normalement vous ne pourrez pas le faire, mais cet outil se chargera de gérer l'envoi de la commande pour que la commande ouverte reste au
Heat Map OSW
William Oswaldo Mayorga Urduy
HEAD MAP OSW Cet indicateur est idéal pour connaître l'état actuel de toutes les combinaisons de devises et connaître leur variation. La variation est calculée par le mouvement en pourcentage du prix du prix actuel à il y a 24 heures, ou tout ce qui est configuré dans le menu. Pour connaître la variation d'une devise, il suffit de regarder la devise principale, exemple : dans l'EUR il faut regarder verticalement pour comparer avec les autres monnaies et au bout du compte, on trouve la m
ESS Enguifing Strategy Signals
William Oswaldo Mayorga Urduy
SIGNAUX STRATÉGIQUES ENGUIFANTS DU SSE Cet indicateur détecte les bougies de type enveloppe auxquelles un filtre est appliqué, ce filtre est composé de 3 stratégies ensemble, avec lesquelles il est possible d'identifier la plus grande efficacité possible dans les paramètres mesurables. Les signaux sont indiqués par des flèches vers le haut et vers le bas pour chacune des directions, et vous pouvez également activer ou désactiver les alertes, les e-mails et les messages push vers le mobile.
MultiTimeFrame Moving Average Osw
William Oswaldo Mayorga Urduy
MOYENNE MOBILE À ÉCHÉANCIER MULTIPLE OSW (METATRADER 5) Cet indicateur va vous permettre d'ajouter des moyennes mobiles de tous types de configuration, à la différence que si vous êtes dans une plage horaire, vous pouvez ajouter celle à un niveau supérieur, pour donner un exemple, si vous êtes dans une plage horaire de 5 minutes et que vous voulez voir l'exponentielle moyenne mobile de 20 de temporalité de 15 minutes, 1 heure et 4 heures, seulement en configurant les paramètres corrects dan
Points Candles Osw
William Oswaldo Mayorga Urduy
BOUGIES POINTES OSW (METATRADER 5) Avec cet indicateur, vous pouvez connaître la taille en points de chacune des bougies qui sont manipulées dans le graphique, vous donnant des informations sur la taille et la direction de chacune, l'indicateur pointera vers le haut s'il est haussier et vers le bas s'il est baissier . De plus, vous pouvez également masquer ou afficher toutes les bougies, uniquement les haussières ou uniquement les baissières, c'est pour les courtiers qui gèrent des actifs q
Break Out Signal Osw MT5
William Oswaldo Mayorga Urduy
SIGNAL DE RUPTURE OSW (METATRADER 5) Voulez-vous travailler avec des hauts et des bas ? c'est l'indicateur parfait pour prendre des signaux de ces types d'entrées. Dès que l'indicateur démarre, il ne vous montrera aucun signal, mais à mesure que le prix progresse, il lira le marché jusqu'à ce qu'il trouve le modèle parfait pour sortir. L'indicateur pour lire les hauts et les bas a une configuration spéciale pour le Zig Zag, ce qui permet de ne prendre que les plus appropriés. Comme to
Filtrer:
Aucun avis
Répondre à l'avis