The price trend MT4
- Indicateurs
- Version: 1.0
- Activations: 5
https://www.mql4.com
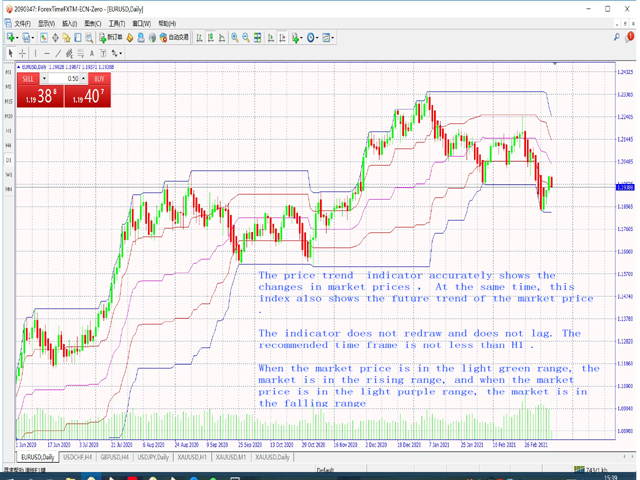
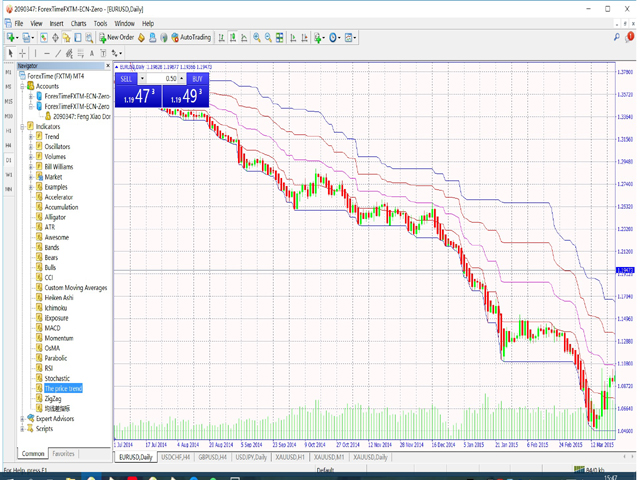
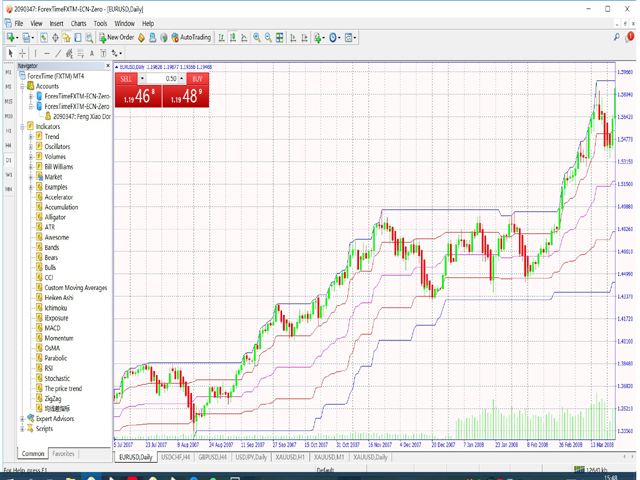
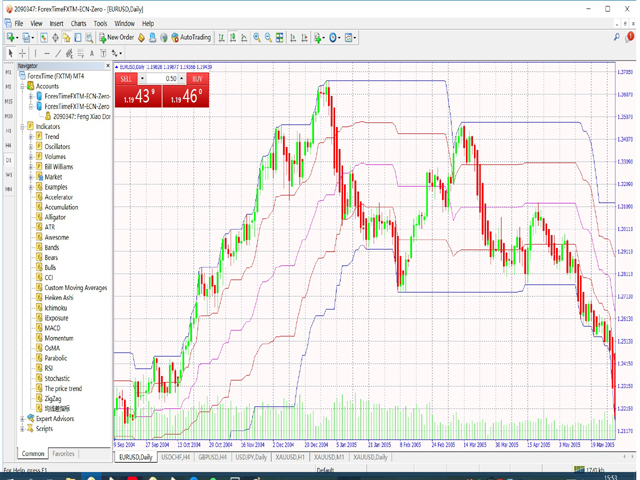
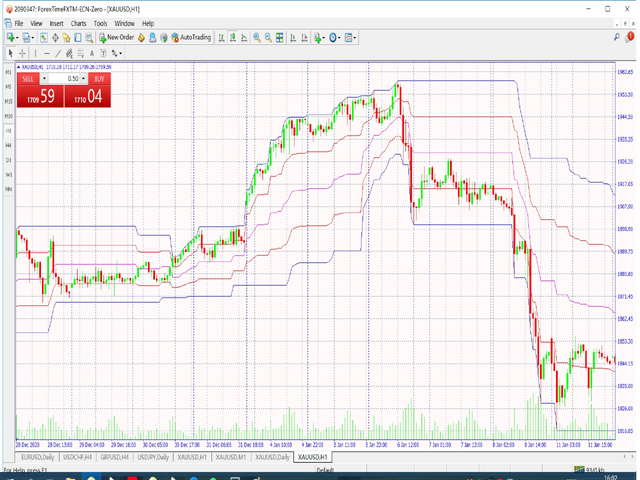
The price trend indicator
The price trend indicator accurately shows the changes in market prices , At the same time, this index also shows the future trend of the market price .
The indicator does not redraw and does not lag. The recommended time frame is not less than H1 .
When the market price is in the light green range, the market is in the rising range, and when the market price is in the light purple range, the market is in the falling range