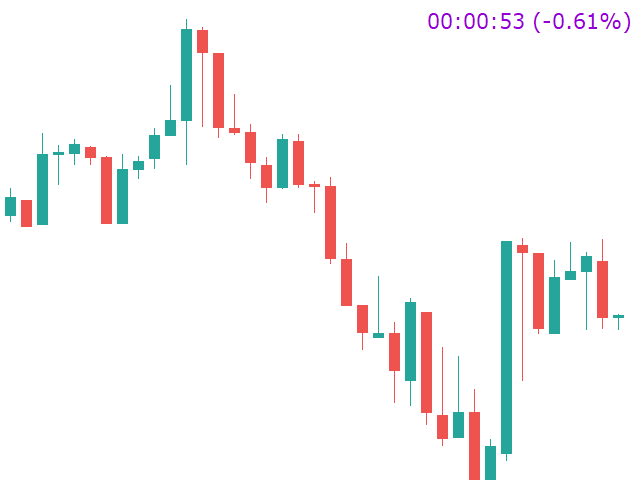
Candle Timer Countdown
- Indicateurs
-
JETINVEST
 Roberto Junqueira, is Trader for over 20 years and has been developing indicators and trading experts for more than 10 years for the Forex, Cryptocurrencies and Stock Exchanges markets.
 - Version: 4.0
- Mise à jour: 25 janvier 2022
Candle Timer Countdown displays the remaining time before the current bar closes and a new bar forms. It can be used for time management.
Feature Highlights
- Tracks server time not local time
- Configurable Text Color and Font Size
- Optional Visualization of the Symbol Daily Variation
- Optimized to reduce CPU usage
Input Parameters
- Show Daily Variation: true/false
- Text Font Size
- Text Color
If you still have questions, please contact me by direct message: https://www.mql5.com/en/users/robsjunqueira/


buena aplicacion. bien ubicada en la esquina superior derecha, nos da la informacion del tiempo de vencimiento de la vela cuando mas la necesitamos, solo tuve un problema con ella una vez instalada, no le pude cambiar el color y viene en default un color violeta dificil de ver, pero al tmar la precaucion de cambiar el color antes de instalar resolvi el problema