Pip Rider
- Indicateurs
- Version: 1.3
- Mise à jour: 29 juin 2021
- Activations: 10

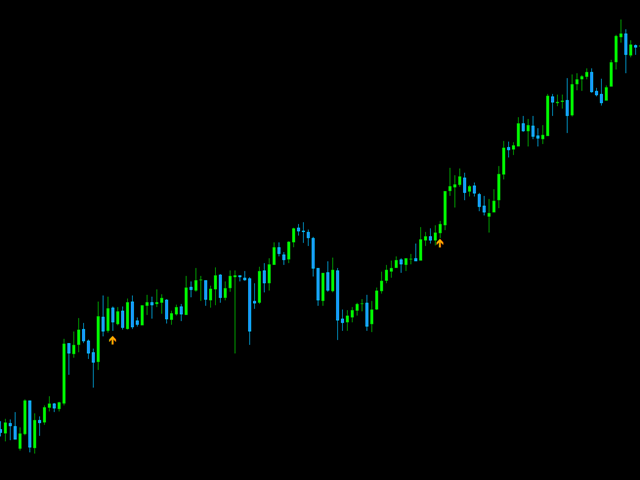
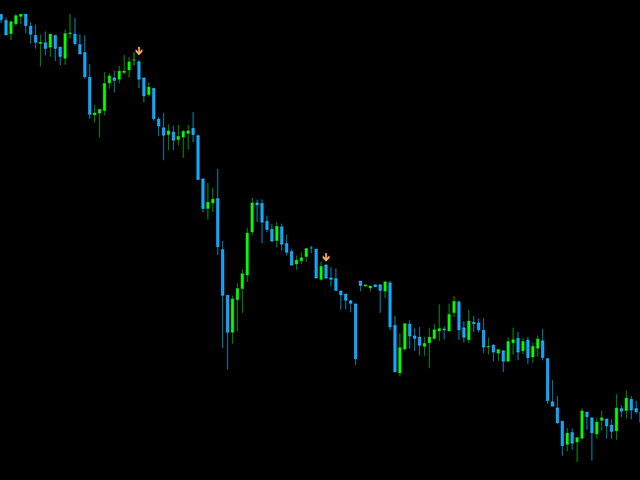
Tired of looking at indicator cluttered charts? Are you a trend trader? I have just the solution for you. Trend Boss.
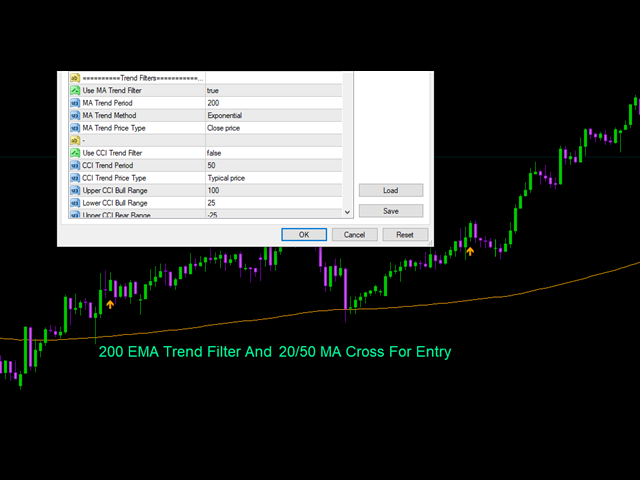
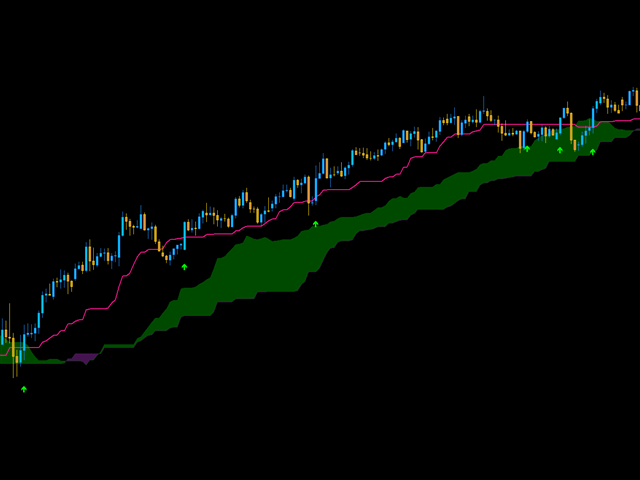
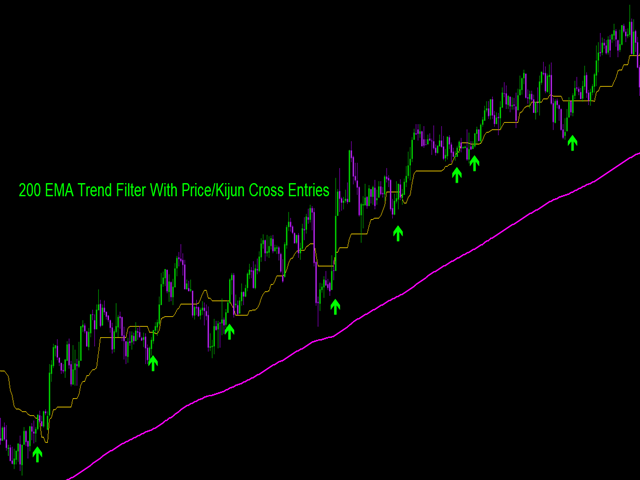
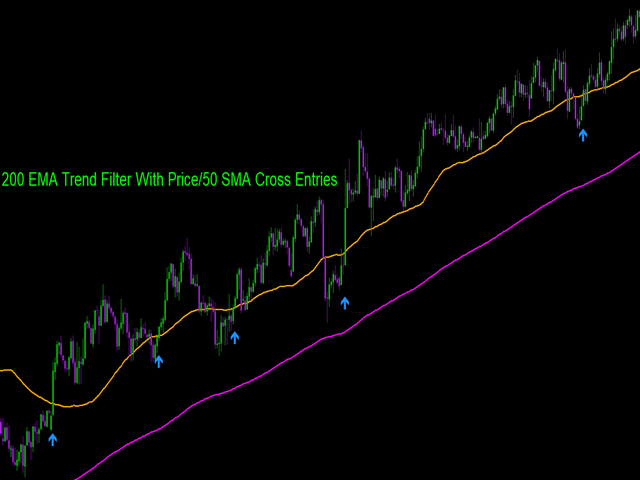
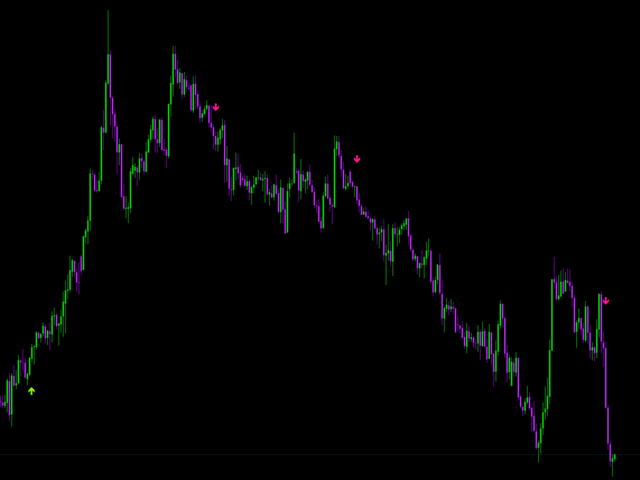
This indicator allows you to choose some of the most popular trend identifiers such as CCI(Supertrend) or Ichimoku and pair them with some of the most popular entries such as Kijun/Tenkan cross or MACD zero cross. You can now keep your charts clean by hiding all those oscillators and moving averages. Only arrows will be displayed depending on your entry criteria.
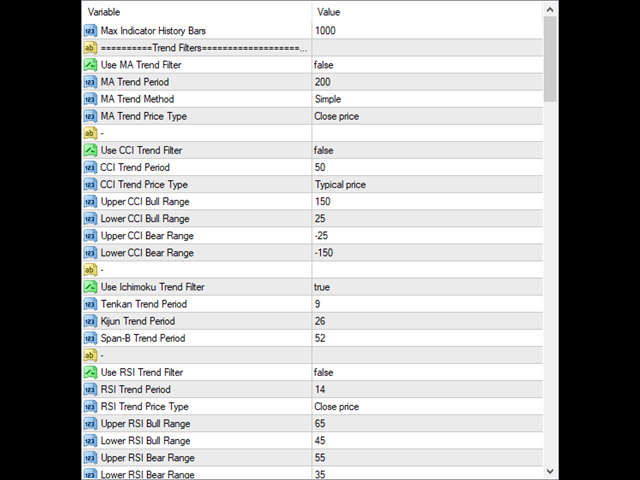
Trend filters
- Ichimoku
- CCI (Supertrend)
- RSI
- Moving average
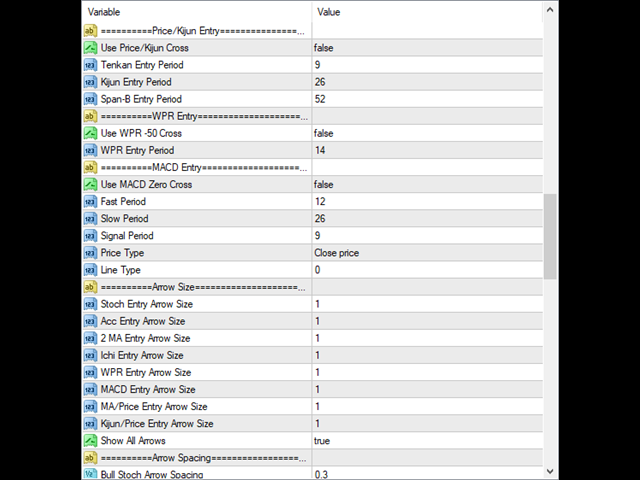
Entry options
- Kijun/Tenkan cross
- Price/Kijun cross
- Fast/Slow moving average cross
- Price/Moving average cross
- Williams percent -50 cross
- MACD zero cross
- Stochastic 80/20 cross
- Accelerator zero cross
Other features included
- When using RSI or CCI, you have the option to choose a bullish or bearish range.
- For example, use a CCI bullish max range value of 150 and minimum value of 25. This can help filter out signals during extreme levels
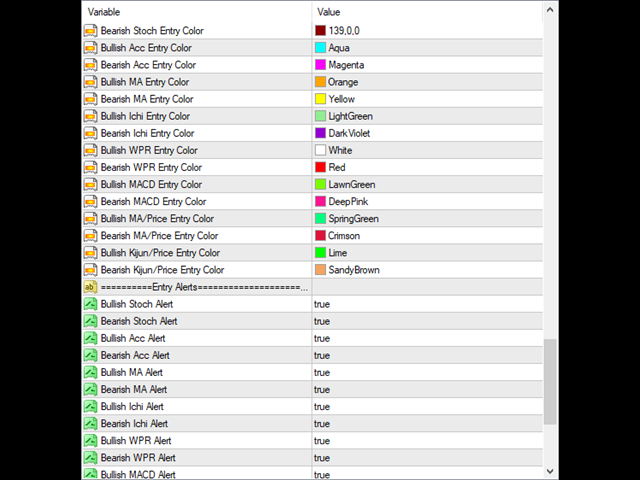
- Choose which signals to show or not show
- Fully customizable color template
- Set arrow spacing for each signal in order to show multiple arrows on one bar
- Option to use text, email, and popup alerts
- Set max bars for indicator history