Please feel free to join this Telegram group where users can share their strategies and settings that work for them using this indicator --> t.me/MTFMACS
This is the free version of the Multiple Timeframe Filtered Moving Average Crossover Indicator. It runs the complete signal engine — Early and Full crossovers, the MA validation stack, the MTF trend filter, RSI, MACD, and the Previous Candle Price filter — but with two constraints compared to the paid version:
1. Moving averages are chosen from a preset library of EMAs, WMAs, and SMAs at common periods from 1 up to 200.
2. The moving averages that drive the logic are computed in memory and never drawn on the chart. If you want to see them, you can add them manually one by one using the same periods you configured, then save the chart as a template.
For $30 you can upgrade to the paid version, which removes both constraints and adds VWMA and native MA plotting. Full detail at the bottom of this description.
Most moving average crossover indicators on the market do one thing: they watch two moving averages cross and fire an arrow the moment the cross happens. Every cross. Every time. Whether the market is ranging, whether the higher timeframe agrees, whether momentum supports the move, whether price is at a logical entry point — none of that matters to them. You get arrows. Lots of arrows. Most of them useless.
This indicator was built on a different premise — that a crossover is only as valuable as the context that confirms it.
Instead of two moving averages, you can stack more than ten moving averages on a single timeframe and require all of them to be in a specific order before a signal is considered valid. Instead of ignoring the higher timeframe, you can filter every signal through an MA trend check on any timeframe. Instead of ignoring momentum, you can require RSI and MACD to agree. Instead of ignoring where price actually is, you can require the signal to happen at a Fibonacci retracement level inside the previous higher-timeframe candle.
Combine as many or as few of these layers as your strategy demands. The result is not a flood of arrows and alerts — it is a small, deliberate set of signals that survived every filter you chose to enable.
After you apply the indicator and configure it, you will notice that no moving averages appear on the chart. This is a limitation of the free version. The MAs that drive the signal logic are computed in memory and never plotted.
The advantage of this limitation is that you get a chart free of MA noise — useful if you practise other forms of analysis on the same chart: drawing trendlines, marking order blocks, applying other indicators, or reading price action directly.
The disadvantage is that you cannot visually verify which MAs are where without extra effort. If you want to see them, add them manually — one by one — using the same periods you configured in the indicator's inputs. Once arranged, save the chart as a template, and next time loading that template restores all of them in a single click.
The paid version plots every MA that drives the logic directly — with per-MA color, width, and a visibility toggle — so you never need to add them manually.
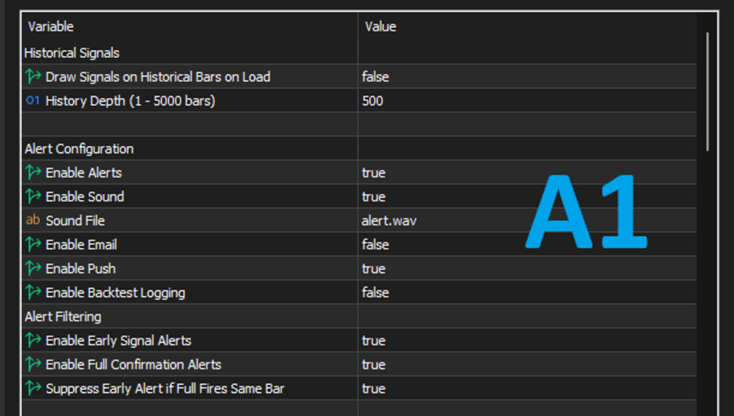
Decide how a signal reaches you. Each option is independent.
• Enable Alerts — pop-up alert window.
• Enable Sound — plays your chosen .wav file.
• Enable Email — sends to your terminal-configured email.
• Enable Push — sends to your MetaTrader mobile app.
• Enable Backtest Logging — writes diagnostic values to the Experts log for tuning.
2. ALERT FILTERING
• Enable Early Signal Alerts — receive Early signal alerts.
• Enable Full Signal Alerts — receive Full signal alerts.
• Suppress Early Alert if Full Fires Same Bar — when Early and Full fire on the same bar for the same direction, only the Full alert is sent, avoiding a duplicate notification.
3. ARROW APPEARANCE
• Draw Arrows — No Arrows (alerts only), Early + Full Signals, or Full Signals Only.
• Arrow Size — 1 to 5.
• Arrow Distance from Candle — pixel offset for the arrows.
Image A1 — Screenshot showing the indicator's arrow input section.
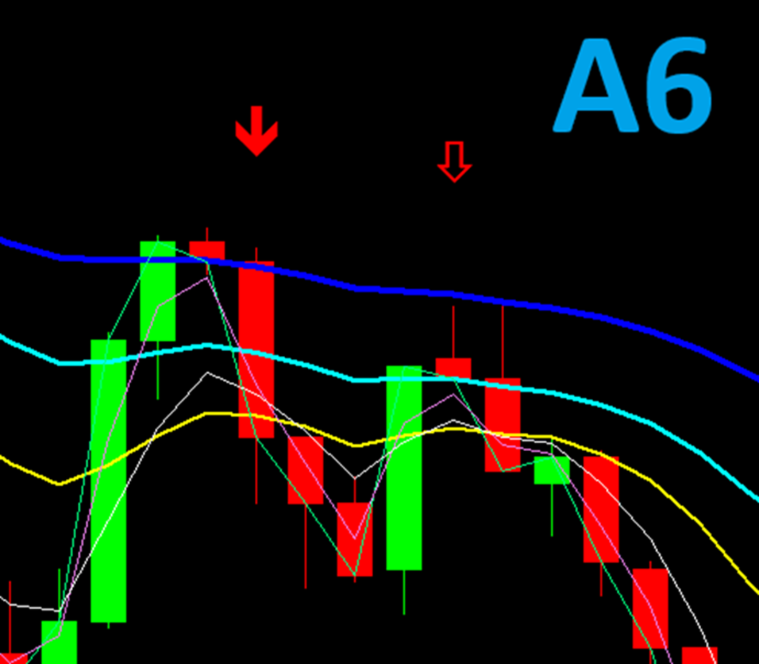
Image A6 — Screenshot showing the indicator's arrow appearance, with hollow arrows representing early signals and full body colored arrows representing full signals.
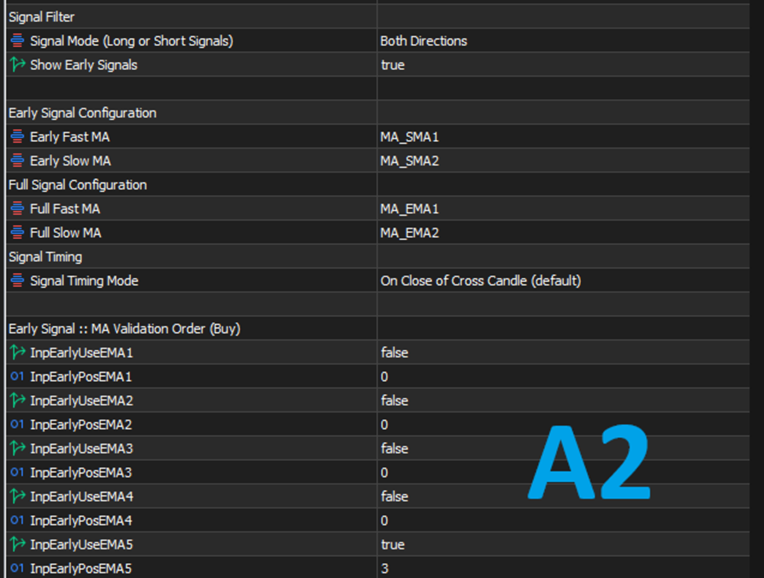
4. SIGNAL FILTER
• Signal Mode — Long Only, Short Only, or Both Directions.
• Show Early Signals — master switch for the Early subsystem.
5. EARLY SIGNAL CONFIGURATION
The Early signal is designed to detect the crossover earlier in its development — before the full validation stack lines up — giving you a heads-up that a Full signal may be forming.
• Early Fast MA — the fast moving average for the Early cross.
• Early Slow MA — the slow moving average for the Early cross.
Both are chosen from a large library that includes Exponential, Weighted, and Simple moving averages at every common period from 1 up to 200. You are not restricted to "EMA 9 and EMA 21" or any other preset pairing — pick whichever pair best matches the market you trade.
6. FULL SIGNAL CONFIGURATION
The Full signal is the confirmed crossover — the one that fires only when the crossover has occurred and all enabled validation and filter layers have agreed.
• Full Fast MA — the fast moving average for the Full cross.
• Full Slow MA — the slow moving average for the Full cross.
You can run a completely different MA pair here than you use for Early, which means you can build a two-stage system: an aggressive Early pair that gets your attention, and a stricter Full pair that confirms the trade.
7. SIGNAL TIMING
This is one of the most important settings in the entire indicator, and it deserves careful attention.
• Intrabar — signals are detected on the live, still-forming candle. The fastest detection but the noisiest — the candle can still change. Alerts fire, but no arrows are drawn in this mode, by design.
• On Close of Cross Candle — the default. Signals are detected only after the crossover candle has closed. Arrows are drawn. No repainting.
• One Candle After Close — the strictest mode. The crossover must have occurred on the previous closed candle and the relationship must still hold on the current closed candle. This eliminates false crosses that immediately reverse.
Image A2 — Screenshot showing the indicator's MA crossover input section.
8. THE MA VALIDATION ORDER — THE HEART OF THE INDICATOR
This is where the indicator leaves every other crossover tool behind. There are two identical sections in the inputs:
• Early Signal :: MA Validation Order (Buy)
• Full Signal :: MA Validation Order (Buy)
Each contains the full MA library (every EMA, WMA, and SMA from period 1 up to 200). For each MA you get two inputs: an Enable checkbox and a Position number.
HOW THE POSITION NUMBERING WORKS
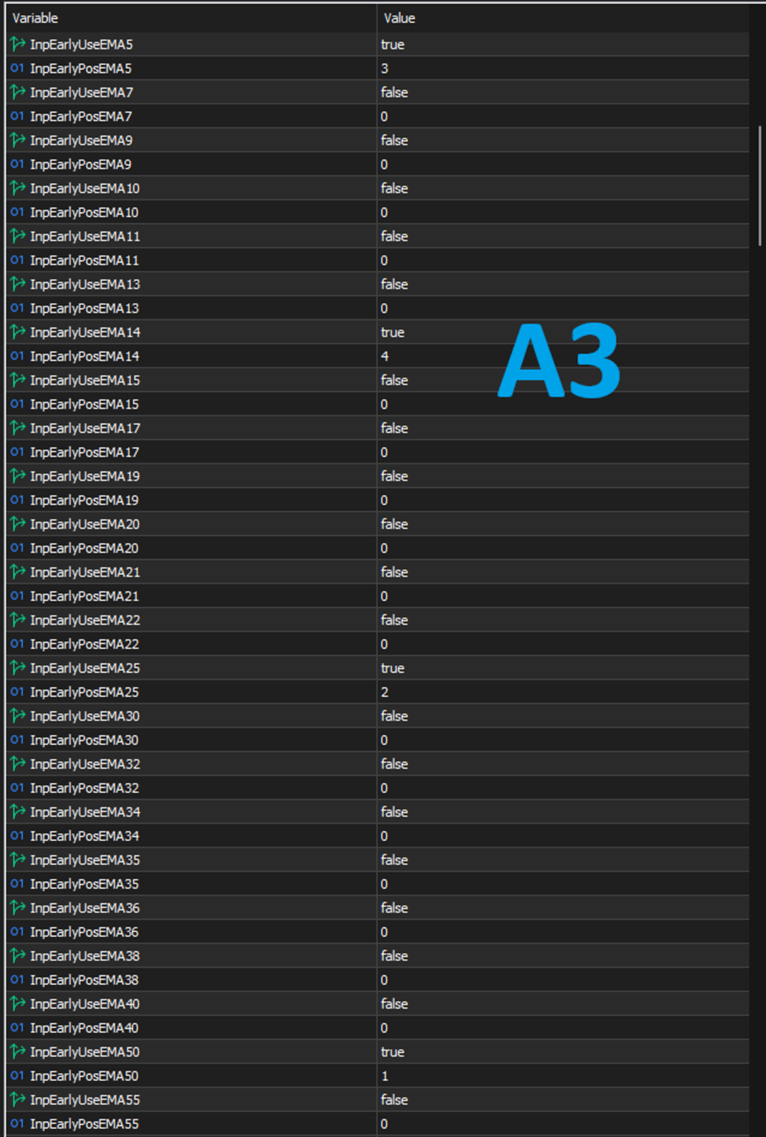
You enable the MAs you want to use — say, EMA 14, EMA 5, EMA 25, and EMA 50.
You assign each one a position number. The number is not the MA period — it is the slot that MA occupies in your validation stack. You are telling the indicator which MA is the strongest leg of your setup, which is second, and so on.
When a candidate crossover fires, the indicator collects the current values of every enabled MA, sorts them by the positions you assigned, and checks whether the sorted values are in the exact order you described:
• Buy signal — values must be in strictly descending order. The MA in the top slot must currently have the highest value, the next slot the next-highest, and so on.
• Sell signal — the same check in reverse: strictly ascending order.
If the order does not match exactly, the signal is rejected. No arrow, no alert.
A CONCRETE EXAMPLE
You want a bullish stack to look like this on the chart:
EMA 14 (top — highest value) > EMA 5 > EMA 25 > EMA 50 (bottom — lowest value)
You also want the early crossover to be 1 SMA crossing 2 SMA upwards for the bullish signal, and 1 EMA crossing 2 EMA upwards for the full confirmation signal.
You would set:
MA | Enable | Position
EMA 14 | yes | 4
EMA 5 | yes | 3
EMA 25 | yes | 2
EMA 50 | yes | 1
The indicator sorts these by position, giving [EMA 14, EMA 5, EMA 25, EMA 50]. For a Buy signal it then requires:
EMA 14 > EMA 5 > EMA 25 > EMA 50
If that chain holds at the moment of the crossover, the Buy is valid. If EMA 14 pokes above EMA 5, or EMA 25 above EMA 14, the signal is discarded.
Image A3 — Screenshot showing the indicator's MA validation order settings.
Image A6 — Screenshot showing how the example above would look for a bearish signal.
NOTE: If you want to include the moving averages involved in the crossover in the MA validation order section, you can — but only the Slow MA. If you include the Fast MA as well, the logic will not work.
WHY THIS MATTERS
Two-MA crossover indicators fail in one specific way: they generate signals in choppy, non-trending conditions where the two MAs tangle and cross repeatedly. By requiring a full stack of MAs to line up at the same moment, this indicator refuses to fire in those conditions.
You are effectively saying: "Only tell me about crossovers that happen when the market structure supports them."
Because you can enable up to 10+ MAs, the depth of validation is entirely up to you. Some traders use two MAs for a fast, loose filter. Others use eight or nine for an extremely strict one.
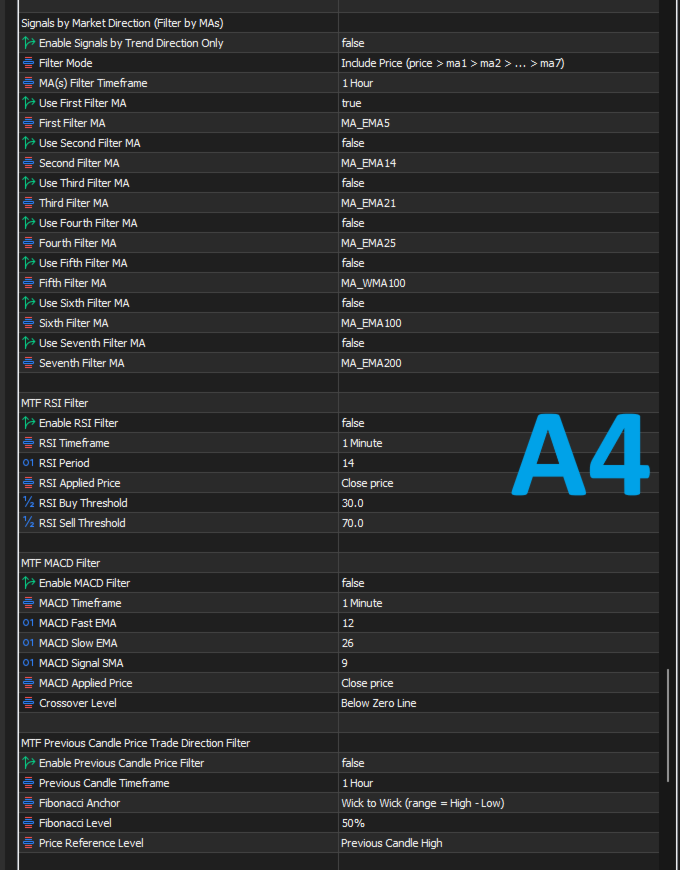
9. SIGNALS BY MARKET DIRECTION (FILTER BY MAs)
This is the higher-timeframe trend filter. It is separate from the validation stack above — validation checks the current timeframe, this checks another timeframe.
• Enable Signals by Trend Direction Only — on/off.
• Filter Mode — Include Price (chains Price > MA1 > MA2 > ... > MAn for buys) or MA Only (chains MA1 > MA2 > ... > MAn, ignoring price).
• MA(s) Filter Timeframe — the timeframe the filter MAs are evaluated on. Set this to whatever higher timeframe defines your trend.
• Use First through Seventh Filter MA — up to seven filter MAs, each with its own enable checkbox and MA type.
If you trade M5 but want to only take signals in the direction of the H1 trend, set the filter timeframe to H1, enable two filter MAs (say EMA 50 and EMA 200), and use MA Only mode. Every signal from your M5 engine is now checked against H1 first. If H1 says down and your signal is a buy, it is silently discarded.
10. MTF RSI FILTER
The same principle applied to momentum.
• Enable RSI Filter — on/off.
• RSI Timeframe — RSI is evaluated on a completely different timeframe from your chart.
• RSI Period, RSI Applied Price — standard RSI configuration.
• RSI Buy Threshold — Buy signals pass only if RSI is at or below this level (default 30).
• RSI Sell Threshold — Sell signals pass only if RSI is at or above this level (default 70).
11. MTF MACD FILTER
• Enable MACD Filter — on/off.
• MACD Timeframe, MACD Fast, MACD Slow, MACD Signal, MACD Applied Price — standard MACD configuration on any timeframe.
• Crossover Level — Below Zero (momentum reversal from a low) or Above Zero (continuation in an established trend).
12. MTF PREVIOUS CANDLE PRICE TRADE DIRECTION FILTER
This filter is one of the greatest strengths of this indicator. It implements what is often called the one-candle theory — a single completed higher-timeframe candle is enough to define a tradable range for the session or day. After a strong directional candle, price often retraces back into it before the trend continues. Wait for the retracement, and accept a crossover only when it fires inside a specific area of that candle, and you get an entry with natural context and a natural invalidation point.
The filter is off by default. When enabled, it becomes the final arbiter: any signal that does not fit inside the range you have defined is silently discarded, no matter how many other filters agreed.
THE ELEMENTS YOU CONFIGURE
1. Previous Candle Timeframe — the timeframe whose most recently closed candle defines the reference. Typically H4, D1, or W1. Must be higher than your chart timeframe; a lower setting is blocked on load with a clear error message.
2. Fibonacci Anchor — which part of the previous candle defines the 0% and 100% boundaries of the Fibonacci grid:
• Wick to Wick — from the candle's High (100%) down to its Low (0%). Wicks included.
• Body to Body — from the top of the body (100%) down to the bottom (0%). Wicks ignored. Useful when the previous candle had unusually long wicks, since it compresses the levels into the meaningful part of the candle.
3. Fibonacci Level — the retracement level price should reach before a crossover is accepted:
Level | Meaning
23.6% | Shallowest retracement
38.2% | Moderate
50.0% | Mid-candle
61.8% | Deep
78.6% | Very deep
100.0% | Full retracement to the opposite extreme
107.0% | Sweep past the opposite extreme — the stop-hunt zone
The 107% level exists for a specific reason. Many traders place stop losses just below the low of a bullish candle, or just above the high of a bearish candle. Price frequently spikes through those levels to trigger stops, then reverses and resumes the trend. If you want to catch that move, 107% is the level to select.
4. Price Reference Level — the second boundary of the acceptance zone, taken from the previous candle's actual OHLC: Open, High, Low, or Close.
The Fib level and the Reference level together define a zone. The crossover must occur with price inside that zone.
HOW THE ZONE IS BUILT
Two prices are extracted from the previous candle:
• Fib Price — the value of your chosen Fibonacci level across the anchor.
• Reference Price — the value of your chosen OHLC level.
The zone is the range between those two prices, sorted so it is always well-defined.
• Buy signal: the previous HTF candle must be bullish. Zone runs between the Fib level and the Reference level.
• Sell signal: the previous HTF candle must be bearish. Same construction, mirrored.
If the previous candle's direction does not match the signal, the signal is rejected before the zone is even computed.
WORKED EXAMPLE
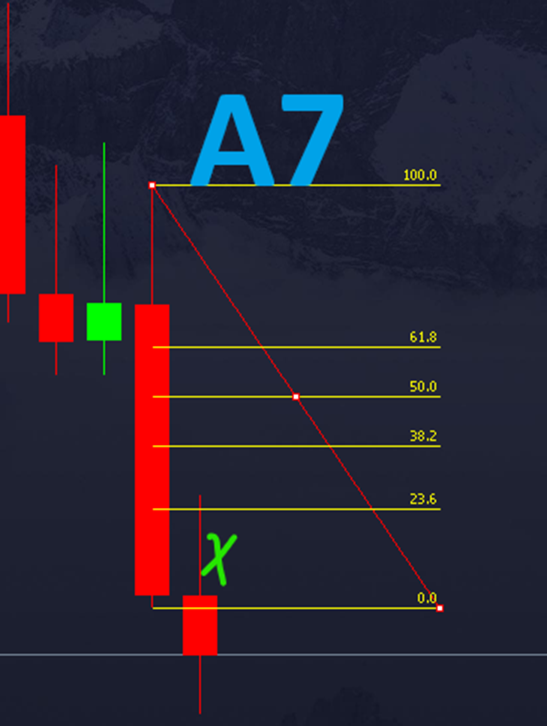
Look at reference image A7. The bearish previous candle is the large red body on the left. The Fibonacci grid is drawn from the 100% line at the top (high) to the 0% line at the bottom (low). The blue X marks the exact crossover point — it fired inside the 23.6% level of the previous bearish candle. Because the previous candle was bearish and the signal was a sell that occurred inside the retracement zone, the filter accepted it. The green X below shows where a subsequent signal would have been rejected — price had already broken past the 23.6% level, so the retracement was spent.
THE RULE THAT SURPRISES PEOPLE — DIPS ARE FORGIVEN
This is the single most important thing to understand about this filter. The check is evaluated only at the moment of the crossover. Past price action within the current period does not disqualify a signal.
SUGGESTED HTF PAIRINGS
If you are new to this one-candle method, here is a practical starting point:
• H4 reference candle → pair with M1 for the crossover signals.
• D1 reference candle → pair with M15 for the crossover signals.
• W1 reference candle → pair with H4 for the crossover signals.
These pairings are a starting point, not a rule. You are free to combine any higher-timeframe reference candle with any lower timeframe for the crossover signals — whatever best fits the market you trade and the pace at which you like to work.
Image A4 — Screenshot showing the indicator's MTF signals filter.
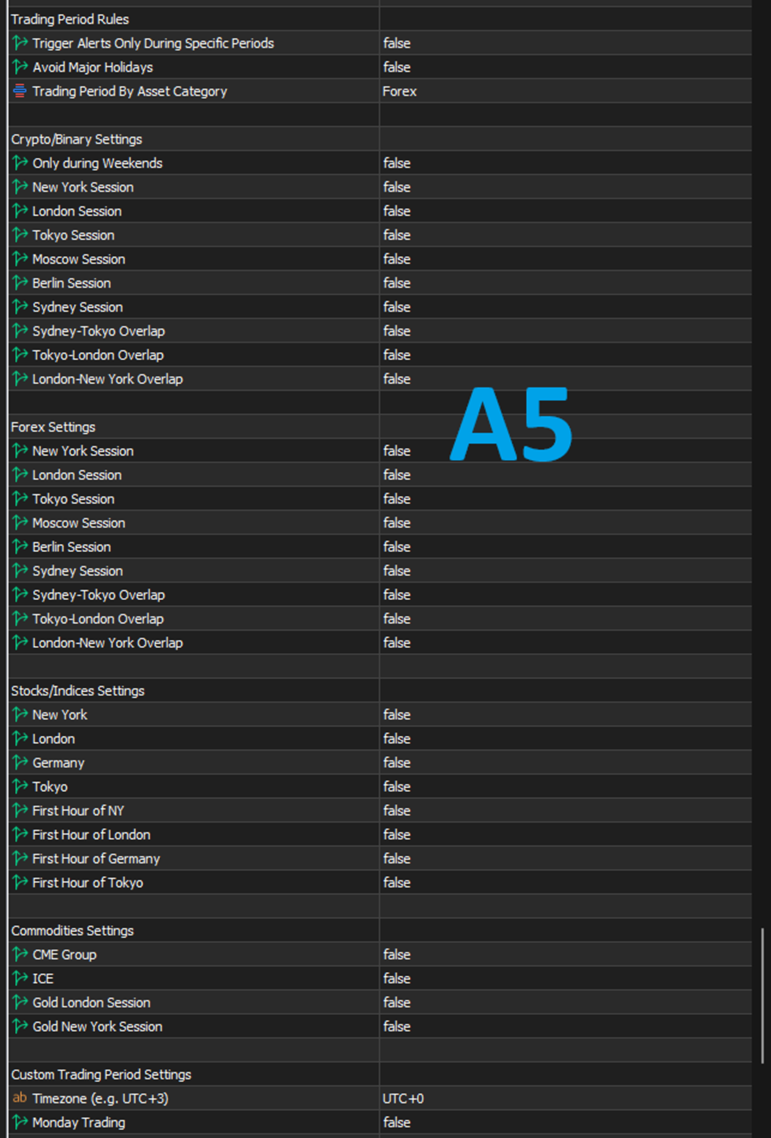
13. TRADING PERIOD RULES
Restrict signals to specific hours — London session, the first hour of the New York open, and so on.
• Trigger Alerts Only During Specific Periods — master on/off.
• Avoid Major Holidays — suppresses signals during New Year, Christmas, US Independence Day, and US Thanksgiving.
• Trading Period By Asset Category — pick the category that matches your instrument:
Crypto / Binary — including a weekends-only option.
Forex — New York, London, Tokyo, Moscow, Berlin, Sydney sessions, plus three overlap periods (Sydney–Tokyo, Tokyo–London, London–New York).
Stocks / Indices — NYSE, LSE, FWB, and TSE hours, plus first-hour-after-open filters.
Commodities — CME, ICE, London Gold, and New York Gold sessions.
Custom — your own day-by-day schedule with a timezone offset, start hour, and end hour per day.
The real strength of this indicator is not any single filter. It is that all the filters are independent and composable. You decide how strict you want to be.
A simple configuration looks like this:
• Multiple MAs in the validation stack (say four or five).
• On Close timing.
• Everything else off.
You will get more signals, filtered primarily by the MA structure.
A strict configuration looks like this:
• Six or more MAs in the validation stack.
• One Candle After Close timing.
• Trend filter on H4 using 3, 5, or 7 MAs.
• RSI filter on M15 with default thresholds.
• Previous candle filter on H4 at the 50% level.
• Trading periods restricted to London and New York.
You will get very few signals. Every one of them will have passed every single layer you turned on.
The indicator does not force a particular trading style on you. It gives you the building blocks and lets you assemble the combination that matches the way you actually trade.
Image A5 — Screenshot showing the indicator's signal filter by trading period rules.
The paid version — Multiple Timeframe Filtered Moving Average Crossover Indicator — runs the exact same signal engine you are using here, plus three upgrades that remove the free version's constraints:
1. FULL MA FREEDOM
Every moving average in the system — the Early crossover pair, the Full crossover pair, all eleven Early validation slots, all eleven Full validation slots, all eleven filter MAs — is now configured with three separate inputs:
• Period — any integer from 1 upward. No preset list.
• Shift — any integer, including non-zero. Useful if you want your MAs to lead or lag by one or two bars.
• Method + Applied Price — a 35-option dropdown.
The 35 options are built from five MA methods × seven applied prices:
Simple, Exponential, Smoothed, Linear Weighted, and Volume Weighted,
applied to Close, Open, High, Low, Median (HL/2), Typical (HLC/3), or Weighted Close (HLCC/4).
That is 5 × 7 = 35 combinations per MA slot. You can now do things like:
• EMA 17 applied to Typical Price — smoother through chop, more responsive to wicks that matter.
• SMMA 21 applied to Median Price — a quiet, smoothed filter that ignores extreme wick noise.
• LWMA 9 applied to Weighted Close — faster reaction to the final bars of the candle.
• VWMA 20 applied to Close — a volume-aware trend anchor. VWMA is new and unique to the paid version.
• Any period, any shift, in any combination. If your edge is EMA 12 vs EMA 26 vs SMMA 55, you no longer approximate it with the nearest preset.
2. NATIVE MA PLOTTING ON THE CHART
The paid version plots every MA that drives the logic directly on the chart:
• Early Fast and Slow crossover MAs (4 plots — Early and Full, Fast and Slow).
• Full Fast and Slow crossover MAs.
• All 22 validation MAs (11 Early + 11 Full).
That is 26 MAs total. For each one you get:
• Its own Color input.
• Its own Width input (1–5).
• A visibility toggle in the MA Visibility group.
Four group-level toggles control which categories draw:
• Show Early Crossover MAs.
• Show Full Crossover MAs.
• Show Early Validation MAs.
• Show Full Validation MAs.
You get the best of both worlds: a chart with every MA visible for visual verification and stack inspection, or a chart kept clean by turning the toggles off — all without ever removing the indicator or re-adding it.
3. INDEPENDENT EARLY AND FULL SIGNAL TIMING
In the free version, one Signal Timing input drives both the Early and Full subsystems. The paid version replaces that with two independent inputs:
• Early Signal Timing Mode.
• Full Signal Timing Mode.
This lets you build a shape the free version cannot produce. For example, Early on Intrabar and Full on On Close gives you the classic "fast alert, slow confirm" pattern — Early alerts fire live on the forming candle as a heads-up, while Full confirmation waits until the crossover candle has closed.
The same signal engine is available on TradingView as an indicator:
Multi-Timeframe Filtered MA Crossover Indicator
The TradingView version includes:
• The full 35-option MA dropdown (including VWMA via ta.vwma()).
• MA visibility toggles and per-MA color and width inputs for all 26 MAs.
• Independent Early and Full signal timing modes.
• All the filters — validation stack, MTF trend, RSI, MACD, Previous Candle Price, Trading Periods.
Two platform-specific notes:
• On TradingView, alerts are configured through TradingView's own alert dialog. The indicator supplies the alert text; the channel selection (popup, sound, email, mobile push, webhook) is handled by the platform.
• The TradingView version does not require MetaTrader to be running, and works on any symbol TradingView provides data for.
If you prefer to work in TradingView for charting and alerts but trade through MetaTrader, the two versions can run side by side and will fire on the same bars.
Please feel free to join this Telegram group where users can share their strategies and settings that work for them using this indicator --> t.me/MTFMACS
The indicator detects and displays М. Gartley's Butterfly pattern. The pattern is plotted by the extreme values of the ZigZag indicator (included in the resources, no need to install). After detecting the pattern, the indicator notifies of that by the pop-up window, a mobile notification and an email. The pattern and wave parameters are displayed on the screenshots. The default parameters are used for demonstration purposes only in order to increase the amount of detected patterns.
Parameters z
Liquidity Zones is a free MetaTrader 5 indicator by MarketStructureLab. It automatically highlights support and resistance zones, counts separate price returns and marks broken zones. The indicator helps you keep important price areas in view and assess how the market reacts to them. Colored zones, compact labels and historical levels make it useful for both beginners and experienced traders with their own analysis methods. Main features Zones based on confirmed price swings. Support zones come
This indicator automatically detects harmonic price patterns on your chart, both bullish and bearish, and shows them as soon as they form, including potential patterns that are still developing. For every pattern it draws the Potential Reversal Zone (PRZ), and for completed patterns it also draws two take-profit and two stop-loss levels.
Supported Patterns: Gartley, Bat, Butterfly, Crab, Deep Crab, Shark and Cypher. Each pattern can be switched on or off individually.
Key Features: Completed
Synthetic Timeframe Creator
Professional Custom Timeframe Visualization for MetaTrader 5
Revolutionize your multi-timeframe analysis with Synthetic Timeframe Creator.
Tired of switching between charts? Need to analyze specific time cycles that don't exist in standard timeframes?
This is your ultimate solution. Create custom D2, D3, W2, W3 (or any N-period) candles directly on your MT5 chart without needing custom symbols or complex workarounds.
KEY FEATURES
Flexible Timeframe Synthesis
Choos
The outside bar indicator shows a range of inside bars and the breakout up and down from the range. The breakout is always displayed at the start of a new range and is extended until another breakout. The calculation always takes place at the start of a new candle. So it is displayed accordingly in all time frames. In inside bar ( insidebar ) trading you can see the top and bottom of a range.
In outside bar ( outsidebar ) trading, the breakout from a range and thus the trend following.
The col
The Turtle Trading Indicator implements the original Dennis Richards and Bill Eckhart trading system, commonly known as The Turtle Trader. This trend following system relies on breakouts of historical highs and lows to take and close trades: it is the complete opposite to the "buy low and sell high" approach. The main rule is "Trade an N-day breakout and take profits when an M-day high or low is breached (N must me above M)". [ Installation Guide | Update Guide | Troubleshooting | FAQ | All Pr
Dynamic Supply and Demand indicator automatically identifies and displays Supply and Demand Zones on your chart based on price action patterns and market structure. These zones represent areas where institutional buying or selling pressure has historically occurred, making them key levels for potential price reactions. This form of indicator takes inspiration from ICT as well as traditional Support & Resistance formation. **For the first 50 candles (number depends on LookBackCandles) when indic
MT5 için "Double Shooting Star pattern" (Çift Kayan Yıldız Formasyonu) Crypto_Forex indikatörü; yeniden çizim (repaint) veya gecikme yapmaz. - "Double Shooting Star pattern" indikatörü, Price Action (Fiyat Hareketi) ticareti için oldukça güçlü bir araçtır; özellikle düşüş trendindeki piyasalar için harikadır. - İndikatör, grafikte nadir görülen ancak etkili bir formasyonu, yani düşüş yönlü (bearish) Çift Kayan Yıldız formasyonunu tespit eder: - Düşüş yönlü Çift Kayan Yıldız formasyonu - Grafikt
Professional Support & Resistance PRO Trade with Confidence. Let the Market Structure Guide You. Professional Support & Resistance PRO is an advanced MT5 indicator that automatically detects and plots high-probability Support and Resistance levels using intelligent price action analysis. Instead of cluttering your chart with unnecessary lines, it identifies the most significant levels where the market is most likely to react. Whether you're a scalper, day trader, swing trader, or position trader
Bir hareketli ortalamanın biçimini değil, bir piyasanın gerçek dönüşünü ölçen iki çizgi. Vortex Indicator MTF yukarı ve aşağı yönlü girdap hareketini bir pencere üzerinde toplar, her birini gerçek aralığa böler ve sinyalini ortaya çıkan çiftin kesişiminden alır, yani mumların kendisinden ölçülen bir yön değişiminden. İçinde hiç özyineleme yoktur, bu yüzden herhangi bir mumdan devam yapı gereği tamdır. Ücretsizdir: deneme süresi yok, kilitli işlev yok, yükseltme sayfası yok. Bir pencere üzerinde
The Penta-O is a 6-point retracement harmonacci pattern which usually precedes big market movements. Penta-O patterns can expand and repaint quite a bit. To make things easier this indicator implements a twist: it waits for a donchian breakout in the right direction before signaling the trade. The end result is an otherwise repainting indicator with a very reliable trading signal. The donchian breakout period is entered as an input. [ Installation Guide | Update Guide | Troubleshooting | FAQ | A
RelicusRoad Fractals, MetaTrader 4 ve MetaTrader 5 için bir fraktal göstergesidir; salınım tepelerini ve diplerini iki güçte işaretler: her iki yanında 7 mumluk bir Fast testi ve her iki yanında 15 mumluk bir Slow testi. Her iki yanda 7 mumluk bir pencere zaten birçok küçük kıvrımı süzer, Slow testi ise bunun iki katından fazlasını ister, bu yüzden daha kalın okları grafiğin çok daha geniş bir bölümünde tutan salınımları seçer. İki güç de birlikte gösterilir, bu yüzden küçük ve büyük salınımlar
Strifor Pivot ATR Target
MetaTrader 5 için ATR hedefli Pivot göstergesi ve analiz paneli Strifor Pivot ATR Target , günlük ve orta vadeli işlemler için tasarlanmış bir araçtır. Klasik pivot seviyelerini dinamik ATR hedefleri ve gelişmiş analiz paneli ile birleştirir. Bu gösterge, işlem aralığını, olası fiyat tepki bölgelerini ve hareket potansiyelini önceden değerlendirmenize yardımcı olur ve manuel hesaplamaları ve subjektif varsayımları ortadan kaldırır. Ana Özellikler Pivot seviyelerinin oto
Alligator Window Indicator : Potencialize suas análises no MetaTrader com o Alligator Window. Este indicador coloca o clássico Alligator de Bill Williams em uma janela separada, permitindo uma visualização mais clara e organizada. Ideal para traders que buscam precisão e eficiência em suas operações, o Alligator Window proporciona insights nítidos e facilita a identificação de tendências sem poluir o gráfico principal. Experimente agora e leve suas estratégias de trading a um novo patamar!
Demand and supply zones Support and Resistance areas Show broken zones Show tested and untested zones Show weak zones Fractal factors Notifications when price reaches point of Interest with Push notifications and pop ups Customizable History Clickable Works on all Timeframes Works on all pairs.
Free for a while till further notice and changes. The demand and supply bot coming soon
Price Action Auxiliary Indicator Suite 4-3: PivotPoints Indicator
This is a price action auxiliary indicator suite that I use regularly in my trading, covering the basic needs of price action trading. It can be loaded and used on any instrument.
A boon for manual price action trading, providing multiple auxiliary functions. Non-price action traders should purchase with caution, as this indicator suite does not provide any buy or sell signals; it is purely auxiliary.
This indicator suite cont
Temel Mum Çubuğu Formasyonları göstergemiz başlıca mum çubuğu formasyonlarını belirlemeyi her zamankinden daha kolay hale getiriyor. Çekiç, Akşam Yıldızı, Üç Beyaz Asker ve çok daha fazlası gibi formasyonları grafiğinize bir bakışta keşfedin. Sezgisel bir arayüz ve net görsel ipuçları ile göstergemiz, ticaret fırsatlarını hızlı ve doğru bir şekilde belirlemenize yardımcı olur / MT4 sürümü
Bu gösterge için Gösterge Tablosu Tarayıcısı: ( Basic Candlestick Patterns Dashboard )
Özellikler Doğr
MT4 Sürümü Golden Hunter , piyasalarda manuel olarak işlem yapan tüccarlar için geliştirilmiştir. Bu, 3 farklı göstergeden oluşan çok güçlü bir araçtır: Güçlü giriş stratejisi: Döviz çiftinin oynaklığını ölçen ve piyasa eğilimini belirleyen bir gösterge tarafından oluşturulur. LSMA: Fiyat verilerini yumuşatır ve kısa vadeli eğilimi tespit etmek için kullanışlıdır. Heikin Ashi: Gösterge grafiğe eklendiğinde, Japon mum çubukları Heikin Ashi mum çubuklarına dönüşecektir. Bu tür bir mum çubuğu fiya
Your chart. One glance. Total clarity. Built by @Ash_TheTrader for traders who are tired of guessing, Extreme Trading Dashboard is a professional-grade heads-up display that sits quietly in the corner of your chart — dark charcoal, rounded, semi-transparent, and genuinely easy on the eyes — until the moment it matters. Dual Session Highlighter Shade up to two independent time windows directly on your chart — London, New York, or your own custom kill-zone. Each gets its own color, so overlapp
Haftalık açılış fiyatını yön (bias) çizgisi olarak kullanır ve bu çizgiden gelen retlerde haftalık yön doğrultusunda işlem yapar. Nasıl çalışır EA, kurallarını sinyal zaman diliminin (varsayılan H1) her kapanan barında bir kez değerlendirir, bu nedenle sinyaller yeniden çizilmez ve mantık test cihazında ve canlı grafikte aynıdır. Kurulum oluştuğunda ve sembolde bu EA'ya ait açık pozisyon yoksa, stop loss ve hedef ile bir piyasa emri açar. Temel özellikler Bakiyenin yüzdesine göre risk bazlı lot
Understanding the levels of the previous day or week is very important information for your trading.
This indicateur allow to draw Previous day High/Low Previous week High/Low
Congifuration High & Low for: Previous day, week Line Style, color Label position, size, color Any questions or comments, send me a direct message here https://www.mql5.com/en/users/mvonline
A personal implementation of a famous trend principle known as higher high, higher close, lower low, lower close (HHHC - HHHL). It uses price action alone to determine trend direction, trend changes and pullback zones. [ Installation Guide | Update Guide | Troubleshooting | FAQ | All Products | Get Help ] Customizable breakout period Customizable colors and sizes It is non-repainting and non-backpainting It implements alerts of all kinds The indicator defines three price zones: Buy zones a
Product Overview Pattern Recognition Master System is a main‑chart classic candlestick pattern auto‑recognition indicator designed for both the MT4 and MT5 platforms. It automatically detects and labels eleven classic reversal and continuation patterns on the main chart, covering double tops and bottoms, head‑and‑shoulders tops and bottoms, hammer and hanging man, engulfing, doji, and morning and evening stars, with an independent cooldown period assigned to each pattern category to suppres
Güncel ve önceki günlük, haftalık ve aylık açılış fiyatlarını etiketli çizgiler olarak çizer, birçok gün içi trader'ın yön ve tepki noktası olarak kullandığı seviyeler. Temel özellikler Kapanmış barlarda hesaplanır, değerler yeniden çizilmez Her sembol ve zaman diliminde çalışır Tüm periyotlar, seviyeler ve renkler girdilerden değiştirilebilir Maksimum bar ayarı sayesinde kaynak dostu Gösterge silindiğinde nesneler otomatik olarak kaldırılır Girdiler Çizgiler: Günlük açılışları göster, Haftalık
Tam multi-timeframe destekli otomatik Fair Value Gap (FVG) tespiti. İndikatör, fiyat dengesizliklerini (üç mumluk dizide 1. mum ile 3. mum arasındaki boşluk) bulur ve grafiği gerçek zamanlı takip ederek uzayan canlı bölgeler olarak çizer. • Multi-timeframe: aynı anda birden fazla TF seçin (M1…MN) ve HTF dengesizliklerini doğrudan LTF grafiğinizde görün — M5 grafiğinde D1 boşlukları, canlı güncellenir. • Tam bölge yaşam döngüsü: dokunuşta yeniden renklendirme, kırılan bölgeleri silme, dokunulan b
Morning Range Breakout (Free Version) Morning Range Breakout (Free Version) is a straightforward trading advisor that implements a breakout strategy based on the morning range. It identifies the high and low within a specified time interval (e.g., 08:00–10:00 UTC) and opens a trade on a breakout upward or downward. The free version includes core functionality without restrictions. All parameters and messages are in English, per MQL5 Market requirements. Key Features Detects morning range based
Grazia Adaptive Trend Channel Sync with the Market’s Pulse. The Ultimate Volatility-Adaptive Channel. "Limited time offer! Free" 【Recommended for traders who:】 Find that traditional fixed-width channels are easily broken and become useless. Struggle with "stop-loss hunting" due to an inability to adapt to changing volatility. Want to objectively visualize the current market’s "room to move." 【Product Overview】 "Fixed channels cannot keep up with a constantly changing market." Grazia Adaptive
Her gün için seçilen seans başlangıcından (sunucu saati) sonraki ilk dakikaların tepesini ve dibini işaretler, ayrıca aralığın bir katında isteğe bağlı hedef çizgileri. Temel özellikler Kapanmış barlarda hesaplanır, değerler yeniden çizilmez Her sembol ve zaman diliminde çalışır Tüm periyotlar, seviyeler ve renkler girdilerden değiştirilebilir Maksimum bar ayarı sayesinde kaynak dostu Gösterge silindiğinde nesneler otomatik olarak kaldırılır Girdiler Açılış Aralığı (sunucu saati): Seans başlangı
Daily and Previous Day Levels draws the reference levels intraday traders check every morning: the previous day's high, low and close, today's open, today's running high and low, and the previous week's high and low.
How it works - Values come straight from the symbol's own D1 and W1 bars, so the day follows your broker's server day. - Each day gets its own line segment, from the day's first bar to its last. Past days stay readable and old lines never shift. You choose how many days to keep (5
FREE
Bu ürünün alıcıları ayrıca şunları da satın alıyor
Trend Sniper X , tüccarların trend yönünü ve olası dönüş noktalarını netlik ve hassasiyetle belirlemelerine yardımcı olan MetaTrader 5 için çoklu zaman dilimli bir trend takip göstergesidir. MT4 için: https://www.mql5.com/en/market/product/193245 Fiyat Bilgisi: Mevcut fiyat tanıtım amaçlıdır ve gelecek güncellemeler ile yeni özellikler yayınlandıkça değişebilir.
Bonus Fırsatı: Bu indikatör için ÜCRETSİZ Oto-Trade Assistant EA'yı almak için lütfen satın aldıktan sonra yazara mesaj gönderin. Code
Şehre yeni bir Kral geldi - Gösterge + Emir Yönetimi göstergeleri (TP1 + TP2 + TP3) + Opsiyonel Telegram Sinyal Gönderici DAHİL (ÜCRETSİZ) (TAM TRADING ve SİNYAL SİSTEMİ) Altın için en iyi EA’mız: Gold Slayer Bu gösterge; gelişmiş bir strateji, özelleştirilebilir emir yönetimine sahip bir trading sistemi ve envelope uzantılarını birleştiren bir mean reversion sistemi içerir. Ayrıca RSI gibi birçok akıllı onay filtresiyle desteklenerek yüksek olasılıklı dönüş girişlerini AL ve SAT sinyalleriyle y
Smart Trend Trading System — MetaTrader 5 Satın aldıktan sonra Smart Universal Expert Advisor'ı ÜCRETSİZ edinmek ve beraberinde çevrimiçi kurs, PDF kılavuzu ve özel gruba erişim almak için MQL5 üzerinden bana mesaj gönderin. STTS; trend yönünü, giriş ve çıkış sinyallerini, dönüş bölgelerini ve önemli fiyat seviyelerini doğrudan grafiğinizde bir araya getirir. Sistemi manuel işlemler için kullanabilir veya ayrı bir uyumlu EA’yı bağlayarak seçtiğiniz ayarlarla otomatik işlem gerçekleştirebilirsini
ZORYK — MetaTrader 5 İçin Gelişmiş XAUUSD Sinyal Sistemi Bu hissi biliyorsunuz. Altını analiz etmek için uzun zaman harcarsınız. Doğru giriş noktasını beklersiniz. Sonunda işlemi açarsınız ve fiyat hemen aleyhinize hareket etmeye başlar. İşlemi çok erken kapatırsınız, Stop Loss seviyesini değiştirirsiniz veya birkaç saniye tereddüt edersiniz. Daha sonra piyasa, başlangıçta beklediğiniz hedefe tam olarak ulaşır; ancak siz artık işlemin içinde değilsinizdir. Sorun her zaman yön değildi. Asıl sorun
Entry Points Pro, emri vermeden önce nereden gireceğinizi, stopu nereye koyacağınızı ve hangi lotla işlem yapacağınızı gösterir. FİYAT Şu anda 149 USD ve bu fiyattan satılan son kopya. Sonrasında fiyat 199 USD'ye çıkacak, nihai fiyat ise 349 USD.
Paramı piyasalarda işlem yaparak kazanıyorum ve bunu gösteriyorum, bu yüzden bu indikatörü herkese satmak zorunda değilim. Bu, kendi kafasıyla düşünen traderlar için bir araç, sihirli bir düğme değil. Ok mum kapanışında belirir ve repaint olmaz. İki ay
İşlem avantajınızı görüş alanınıza alın! M5 Sniper , MeanFX tarafından geliştirilen yeni bir indikatördür. Hassas işlem sinyallerini adaptif TP/SL seviyeleriyle birleştirir — bunun sonucunda mümkün olan en iyi istatistiksel işlemleri oluşturur! Fiyat her 5 satın alımda bir artar, bir sonraki fiyat 69$ olacaktır. Satın aldıktan sonra ipuçları/rehber ve bonus EA almak için bana mesaj gönderin. Onu öne çıkaran nedir? Kanıtlanmış istatistiksel performans Gold XAUUSD üzerinde ( neredeyse her varlıkta
SuperScalp Pro - Professional Multi-Layer Confluence Scalping System SuperScalp Pro, klasik Supertrend sistemini birden fazla akıllı doğrulama filtresiyle geliştiren ileri düzey bir scalping göstergesidir. Yanlış sinyalleri önemli ölçüde azaltırken başarı olasılığı daha yüksek Buy/Sell işlem fırsatlarını belirlemenize yardımcı olur. Buy ve Sell okları doğrudan grafik üzerinde net bir şekilde görüntülenir. ATR tabanlı Stop Loss ve Take Profit seviyeleri de gerçek zamanlı olarak otomatik hesaplanı
Gold Trend Coach, MetaTrader 5 için altın (XAUUSD) trend göstergesidir: mum kapanışında onaylanan (repaint yok) alış ve satış sinyalleri, stop loss ve üç take profit, sizi girişten TP3'e kadar yönlendiren bir koç, çoklu zaman dilimi paneli ve telefonunuza ve Telegram'a uyarılar. Londra ve New York seanslarında M1 ve M5 scalping ve M15 gün içi işlem için yapıldı. BONUS: Gold Trend Coach için ÜCRETSİZ otomatik işlem EA. Satın aldıktan sonra bana yazın, göstergenin sinyallerini kendisi işleyen EA'y
GoldenX Entry, adaptif Smart Entry Trend algoritmasına, sinyal skorlaması sistemine, piyasa rejimi algılayıcısına ve volatilite filtresine sahip bir MT5 indikatörüdür. Her sinyal; hesaplanmış bir giriş seviyesi, üç adet Take-Profit seviyesi (TP1, TP2, TP3) ve bir Stop-Loss seviyesi içerir. Farklı piyasa koşullarına uyum sağlamak için tasarlanmış çok katmanlı analitik yapı üzerine kuruludur ve yerleşik optimizasyon aracı ile istatistik takip sistemini birleştirir. Risk-ödül (RR) metrikleri ve geç
Önce dürüst olalım.
Hiçbir gösterge tek başına sizi kârlı yapmaz. Eğer biri size aksini söylüyorsa, size bir hayal satıyordur. Mükemmel al/sat okları gösteren her gösterge, kusursuzmuş gibi görünecek şekilde yapılabilir — sadece geçmişin doğru bir bölümünü yakınlaştırıp kazanan işlemleri ekran görüntüsü almanız yeterlidir. Biz bunu yapmıyoruz. SMC Intraday Formula bir araçtır. Piyasa yapısını sizin için okur, en yüksek olasılıklı fiyat bölgelerini belirler ve şu anda akıllı paranın izinin nası
Gann Made Easy , bay teorisini kullanarak ticaretin en iyi ilkelerine dayanan, profesyonel ve kullanımı kolay bir Forex ticaret sistemidir. WD Gann. Gösterge, Zararı Durdur ve Kâr Al Seviyeleri dahil olmak üzere doğru SATIN AL ve SAT sinyalleri sağlar. PUSH bildirimlerini kullanarak hareket halindeyken bile işlem yapabilirsiniz. Satın alma işleminden sonra, alım satım talimatlarını ve harika ek göstergeleri ücretsiz olarak almak için lütfen benimle iletişime geçin! Muhtemelen Gann ticaret yöntem
ULTRA, “hepsi bir arada” prensibiyle çalışan bir teknik göstergedir; piyasayı bağımsız olarak analiz eder, işlem sinyalleri üretir, stop-loss emirlerinin verileceği seviyeleri gösterir ve kârı garantilemek ya da zararı en aza indirmek için işlemlerin ne zaman kapatılması gerektiğini önerir. Başka bir deyişle, piyasayı nasıl analiz edeceğinizi bilmeseniz, seviyeleri (stop-loss'unuzu nereye koyacağınızı) belirleyemeseniz ya da para yönetimi konusunda zorluk yaşasanız da fark etmez. ULTRA tüm bunla
Boba Analysis Suite Boba Analysis Suite, MetaTrader 5 için geliştirilmiş bir analiz göstergesidir. Piyasa yapısını, önemli fiyat bölgelerini ve genel piyasa bağlamını tek bir grafik görünümünde bir araya getirir. Trader ve trading eğitmeni olarak edinilen uygulamalı deneyimden yola çıkarak geliştirilmiştir. Piyasanın yönünü değerlendirme, önemli seviyeleri belirleme ve birden fazla zaman dilimini birlikte inceleme gibi adımlardan oluşan sistematik bir analiz sürecini destekler. Piyasa Bağlamını
Sonraki Güncelleme — Sürüm 2.52 Çok Yakında! [YENİ] Piyasa Analizinizi ve İşlem Sürecinizi Geliştirmek İçin Tasarlanmış 4 Büyük Yeni Özelliğe Hazır Olun İşlem ihtiyaçlarınızı karşılamak üzere tasarlanmış 4 yeni özellikle piyasa analizini bir üst seviyeye taşıyoruz. İşte yeni özellikler: 1. TRADE OVERVIEW DASHBOARD 2. CONFLUENCE AT ZONE 3. STRONG & WEAK HIGH/LOW 4. OTE 1. TRADE OVERVIEW DASHBOARD Piyasanın genel görünümünü daha kolay anlamanıza yardımcı olan, işlem kararlarınızı desteklemek için
M1 SNIPER kullanımı kolay bir işlem göstergesi sistemidir. M1 zaman dilimi için tasarlanmış bir ok göstergesidir. Gösterge, M1 zaman diliminde scalping için bağımsız bir sistem olarak kullanılabilir ve mevcut işlem sisteminizin bir parçası olarak kullanılabilir. Bu işlem sistemi özellikle M1'de işlem yapmak için tasarlanmış olsa da, diğer zaman dilimleriyle de kullanılabilir. Başlangıçta bu yöntemi XAUUSD ve BTCUSD ticareti için tasarladım. Ancak bu yöntemi diğer piyasalarda işlem yaparken de
Gold Entry Sniper – Altın Scalping & Swing Trading için Profesyonel Çoklu Zaman Çerçeveli ATR Paneli Gold Entry Sniper , XAUUSD ve diğer enstrümanlar için doğru al/sat sinyalleri veren, ATR Trailing Stop mantığı ve çoklu zaman çerçevesi analizi ile geliştirilmiş gelişmiş bir MetaTrader 5 göstergesidir. Temel Özellikler ve Avantajlar Çoklu Zaman Çerçevesi Analizi – M1, M5, M15 trendlerini tek panelde gösterir. ATR Tabanlı Trailing Stop – Volatiliteye göre dinamik olarak ayarlanır. Profesyonel Gra
FiboSniper Pro – Multi-Filter Fibonacci System with Auto SL/TP and Control Panel FiboSniper Pro, seçilmiş Buy ve Sell sinyalleri üretmek için dinamik Fibonacci Envelopes ile birden fazla doğrulama filtresini birleştiren teknik bir göstergedir. Fibonacci seviyeleri Moving Average ve ATR temel alınarak hesaplanır ve ardından ADX, EMA, RSI, ATR, Volume, Time ve Candle yapısı ile filtrelenir. Gösterge, ATR tabanlı otomatik Stop Loss ve Take Profit seviyelerini doğrudan grafik üzerinde görüntüler ve
ARICoin is a powerful trading companion designed to generate high-probability entry signals with dynamic TP/SL/DP levels based on volatility. Built-in performance tracking shows win/loss stats, PP1/PP2 hits, and success rates all updated live. Key Features: Buy/Sell signals with adaptive volatility bands Real-time TP/SL/DP levels based on ATR Built-in MA Filter with optional ATR/StdDev volatility Performance stats panel (Success, Profit/Loss, PP1/PP2) Alerts via popup, sound, push, or email Cust
ScalpPoint is a powerful trading companion designed to generate high-probability entry signals with dynamic TP/SL/DP levels based on volatility. Built-in performance tracking shows win/loss stats, PP1/PP2 hits, and success rates — all updated live. Key Features: Buy/Sell signals with adaptive volatility bands Real-time TP/SL/DP levels based on ATR Built-in MA Filter with optional ATR/StdDev volatility Performance stats panel (Success, Profit/Loss, PP1/PP2) Alerts via popup, sound, push, or emai
Auto Optimized SpeedAngle , sürekli İleriye Dönük Optimizasyon (Walk-Forward Optimization, WFO) yoluyla eğri uydurmayı (curve-fitting) ortadan kaldıran kurumsal düzeyde bir momentum vektörleme sistemidir. Piyasa rejimleri değiştiğinde etkinliğini yitiren statik girdilere güvenmek yerine, gösterge, örneklem dışı (Out-of-Sample, OOS) doğrulama kullanarak parametrelerini dinamik olarak yeniden kalibre eder ve böylece gösterilen sinyallerin geçmişteki rastgele anomalileri değil, gerçek bir istatisti
Adaptive Price Action Engine Göstergeyi al, EA'sı (Uzman Danışman) bedava gelsin Kendi Kendini Optimize Eden Multi-Timeframe Trend ve Mum Formasyonu Analizi Piyasalar sürekli değişir ve her Price Action formasyonu her piyasa koşulunda aynı değere sahip değildir. Adaptive Price Action Engine , değişen piyasa koşullarına uyum sağlamak amacıyla trend yapısını, Multi-Timeframe analizini, mum formasyonlarını ve istatistiksel optimizasyonu tek bir analiz sistemi içerisinde birleştirir. İki Adaptif Mod
Crystal Heikin Ashi Signals—Professional Trend & Signal Detection Indicator Advanced Heikin Ashi Visualization with Intelligent Signal System for Manual & Automated Trading
Final Price: $149 ---------> Price goes up $10 after every 10 sales .
Limited slots available — act fast .
Overview
User Guide PDF Crystal Heikin Ashi Signals is a professional-grade MetaTrader 5 indicator that combines pure Heikin Ashi candle visualization with an advanced momentum-shift detection system. Designed for both m
Scalper Vault, gün içi işlemlerde istikrar yakalamak isteyen yatırımcılar için tasarlanmış, güçlü ve tam donanımlı bir alım satım sistemidir. Bu yüksek hassasiyetli gösterge; hem Forex hem de İkili Opsiyon yatırımcıları için kurumsal düzeyde analizler sunan, bağımsız ve eksiksiz bir alım satım sistemi işlevi görür. SATIN ALIM İŞLEMİNDEN SONRA BENİMLE İLETİŞİME GEÇİN; ALIM SATIM İPUÇLARIMI VE HARİKA BİR BONUSU ALIN! Tahmin yürütme zorunluluğunu ve karmaşık manuel analiz süreçlerini ortadan kaldı
TREND YAKALAYICI GÖSTERGE
Trend Yakalayıcı Gösterge, yazarın tescilli ve özelleştirilmiş uyarlanabilir trend analiz göstergelerinin bir kombinasyonunu kullanarak piyasa fiyat hareketlerini analiz eder. Kısa vadeli gürültüyü filtreleyerek ve temel momentum gücüne, volatilite genişlemesine ve fiyat yapısı davranışına odaklanarak gerçek piyasa yönünü belirler. Ayrıca, hareketli ortalamalar, RSI ve volatilite filtreleri gibi yumuşatma ve trend filtreleme özelleştirilmiş göstergelerinin bir kombina
Tokyo Indicator; trend yönü, potansiyel işlem sinyalleri ve piyasa koşulları hakkında net ve görsel bir genel bakış sunar. Renk kodlu ve kademeli trend çizgisi, yükseliş evrelerini (mavi) düşüş evrelerinden (macenta) ayırt eder. Trend değiştiğinde, buna karşılık gelen yön okları potansiyel alım ve satım fırsatlarını vurgular. Entegre bir panel; mevcut sinyali, piyasa eğilimini, momentumu, volatiliteyi ve sinyal kalitesini tek bir kullanışlı görünümde bir araya getirir. Bu sayede yatırımcılar, fa
Atomic Analyst — MetaTrader 5 Satın aldıktan sonra Smart Universal Expert Advisor'ı ÜCRETSİZ edinmek ve beraberinde çevrimiçi kurs, PDF kılavuzu ve özel gruba erişim almak için MQL5 üzerinden bana mesaj gönderin. Atomic Analyst; fiyat hareketini, trend yönünü, giriş ve çıkış sinyallerini, Stop Loss ve birden fazla Take Profit seviyesini doğrudan grafiğinizde bir araya getirir. SİNYALİ GÖRÜN. İŞLEM KOŞULLARINI ANLAYIN. Atomic Analyst, analizini anlaşılır görsel bilgiler halinde sunar: • Olası gir
Unix Scalper — MetaTrader 5 Satın aldıktan sonra Smart Universal Expert Advisor'ı ÜCRETSİZ edinmek ve beraberinde çevrimiçi kurs, PDF kılavuzu ve özel gruba erişim almak için MQL5 üzerinden bana mesaj gönderin. İşlem fırsatını belirleyin. Planı görün. Nasıl işlem yapacağınıza karar verin. UNIX Scalper; piyasa analizini, BUY/SELL/WAIT kararlarını ve Entry, Stop Loss, TP1 ve TP2 seviyelerini düzenli bir panelde bir araya getirir. SİNYALİ VE PLANI GÖRÜN • Net kararlar: BUY, SELL veya WAIT.
• Belir
SIO Oscillator: Kendi Kendini Optimize Eden Yarı Varyans Dengesizlik Osilatörü İndikatörü satın alın, ona dayalı Uzman Danışmanı (EA) ÜCRETSİZ edinin. Çoğu osilatör, tüm fiyat hareketlerini aynı şekilde değerlendirir. SIO ise yükseliş ve düşüş baskısını birbirinden ayırır ve aralarındaki dengesizliği ölçerek piyasayı gerçekte kimin kontrol ettiğini gösterir: alıcılar mı, satıcılar mı. Dengesizlik bir uç noktaya ulaştığında SIO, giriş, Stop Loss ve Take Profit seviyeleriyle birlikte net bir sinya
Volatility Master for MetaTrader is a real-time dashboard tool that scans up to 50 symbols to identify high-volatility , trending markets instantly. With bullish/bearish signals, customizable alerts, and a user-friendly interface, it helps you avoid range-bound conditions and focus on high-probability trades. Clarity leads to confidence. Trade confidently and protect your capital effectively with this powerful dashboard. We don't offer free or bonus indicators in exchange of reviews from you.
SMC PRO TOOLKIT — SMART MONEY ANALYSIS & STRUCTURED TRADE PLANNING SMC Pro ToolKit is a professional Smart Money Concepts analysis workspace for MetaTrader 5. It combines market structure, multi-timeframe analysis, institutional price zones, setup evaluation, confirmation tools, volume context, alerts, and risk planning inside one organized chart environment. One workspace. Multiple layers of confirmation. One structured trading plan.
OPEN COMPLETE USER GUIDE
MULTI-CONDITION SETUP ENGINE At
Please feel free to join this Telegram group where users can share their strategies and settings that work for them using this indicator --> t.me/MTFMACS ALSO AVAILABLE ON TRADINGVIEW
The MTFMACS family is now available on TradingView for users who prefer charting on that platform. Contact me via the Telegram group for direct access.
————————————————————————————————— BEFORE YOU PURCHASE — PLEASE READ A free version of this indicator is available. Please purchase this paid version only if you
Please feel free to join this Telegram group where users can share their strategies and settings that work for them using this Expert Advisor --> t.me/MTFMACS ALSO AVAILABLE ON TRADINGVIEW
The signal engine of this EA is available on TradingView as a backtesting and study tool. The TradingView version runs the same crossover, validation, and MTF filter logic and includes all 35 MA method/price combinations (including VWMA). Use it to evaluate your configuration against historical data, then re