QuantMatrix Wick Pressure
- Indicateurs
-
Rafael Barreto Haddad
 Chercheur en systèmes de trading quantitatif | Créateur de QuantMatrix Research Series | MetaTrader 5
Créateur de la série de recherche QuantMatrix pour MetaTrader 5. - Version: 2.10
- Mise à jour: 14 août 2026
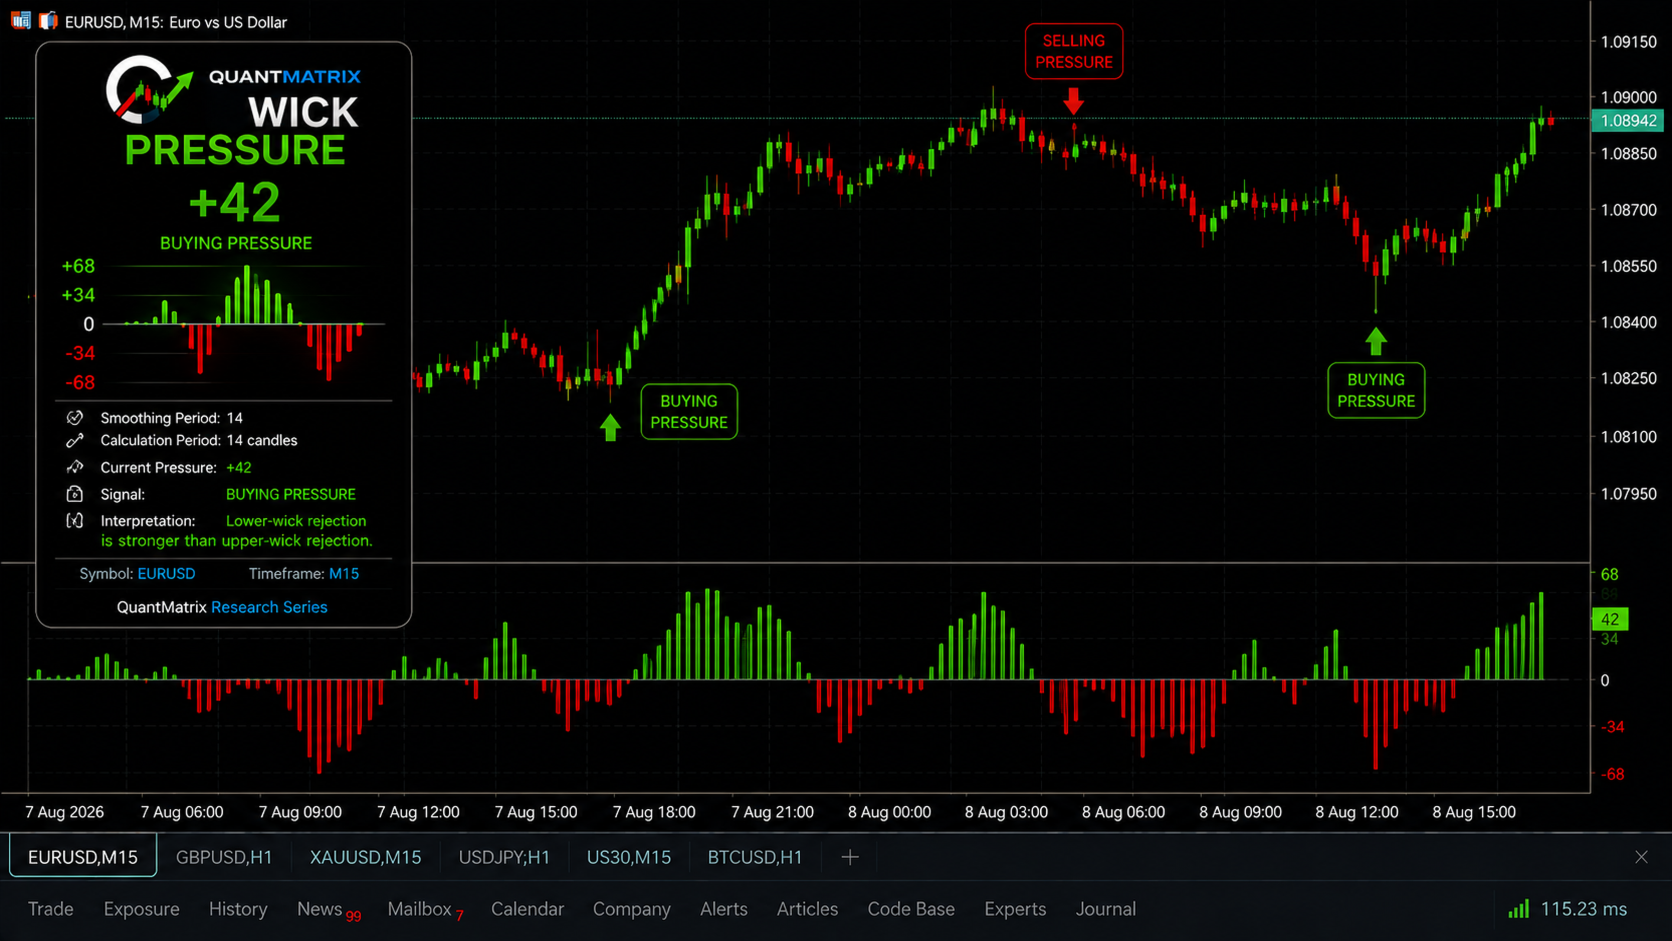
QuantMatrix Wick Pressure is a technical indicator for MetaTrader 5 that measures the relationship between upper and lower candlestick wicks and converts this information into a numerical pressure measurement.
Candlestick wicks represent price movement that occurred beyond the candle body before price returned from those levels.
The indicator measures this rejection behavior over consecutive candles and displays the result in a separate indicator window.
Positive values indicate stronger lower-wick rejection during the analyzed period.
Negative values indicate stronger upper-wick rejection.
Values near zero indicate a more balanced relationship between upper and lower wick rejection.
Pressure Interpretation
The indicator can be used to observe changes in rejection pressure over time.
Positive pressure indicates that lower-wick rejection is dominant in the analyzed sample.
Negative pressure indicates that upper-wick rejection is dominant.
Pressure near zero indicates that neither side has a significant advantage according to the wick calculation.
Changes in pressure can also provide information about how candlestick rejection behavior is evolving.
For example, a sequence of increasingly positive readings indicates that lower-wick rejection is becoming stronger relative to upper-wick rejection.
A sequence of increasingly negative readings indicates the opposite condition.
Confirmation Tool
QuantMatrix Wick Pressure is designed primarily as a market context and confirmation indicator.
A wick by itself does not determine future price direction. The same wick structure can occur under different trend, volatility and price-location conditions.
For this reason, Wick Pressure can be combined with other forms of analysis such as:
-
Trend analysis
-
Support and resistance
-
Price structure
-
Breakout analysis
-
Volatility analysis
-
Momentum indicators
-
Other price-action methods
For example, positive Wick Pressure occurring near a support area can provide additional information about lower-price rejection.
Negative Wick Pressure near a resistance area can provide additional information about upper-price rejection.
These conditions are observations derived from price behavior and are not automatic trading instructions.
Smoothing
Individual candles can produce short-term variations in wick measurements.
QuantMatrix Wick Pressure can calculate pressure over several consecutive candles to reduce the influence of individual candle variations.
The smoothing period can be configured by the user.
This allows the trader to choose between a more responsive measurement and a smoother representation of wick pressure.
Display
The indicator is displayed in a separate window below the main price chart.
The central zero level separates positive and negative pressure.
This allows changes in rejection pressure to be monitored without modifying the original candlestick chart.
Features
-
Upper-wick analysis
-
Lower-wick analysis
-
Numerical wick-pressure measurement
-
Positive and negative pressure values
-
Buying and selling rejection context
-
Zero reference level
-
Configurable smoothing period
-
Separate indicator window
-
Automatic symbol detection
-
Automatic timeframe detection
-
Can be used as confirmation with other technical analysis methods
-
Does not open, modify or close trades
Symbol and Timeframe
QuantMatrix Wick Pressure automatically uses the symbol and timeframe of the chart where it is attached.
The same indicator can therefore be applied to different MetaTrader 5 instruments and chart periods.
QuantMatrix Research Series
QuantMatrix Wick Pressure is part of the QuantMatrix series of quantitative market analysis tools developed by Rafael Haddad.
The indicator converts candlestick wick information into a numerical measurement intended to provide additional market context.
The displayed values are derived from historical and current price data. They do not predict or guarantee future price direction and do not guarantee trading results.